. 2020 Apr 10;21(1):289.
doi: 10.1186/s12864-020-6669-y.

Copy number variation in human genomes from three major ethno-linguistic groups in Africa

Affiliations

Copy number variation in human genomes from three major ethno-linguistic groups in Africa

Oscar A Nyangiri et al. BMC Genomics. .

Abstract

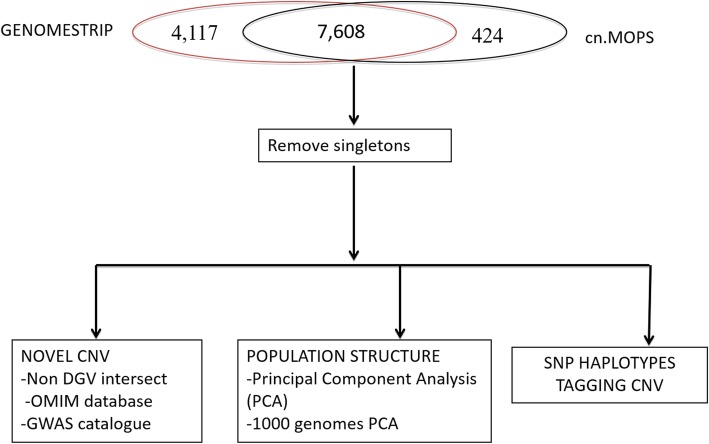
Background: Copy number variation is an important class of genomic variation that has been reported in 75% of the human genome. However, it is underreported in African populations. Copy number variants (CNVs) could have important impacts on disease susceptibility and environmental adaptation. To describe CNVs and their possible impacts in Africans, we sequenced genomes of 232 individuals from three major African ethno-linguistic groups: (1) Niger Congo A from Guinea and Côte d'Ivoire, (2) Niger Congo B from Uganda and the Democratic Republic of Congo and (3) Nilo-Saharans from Uganda. We used GenomeSTRiP and cn.MOPS to identify copy number variant regions (CNVRs).

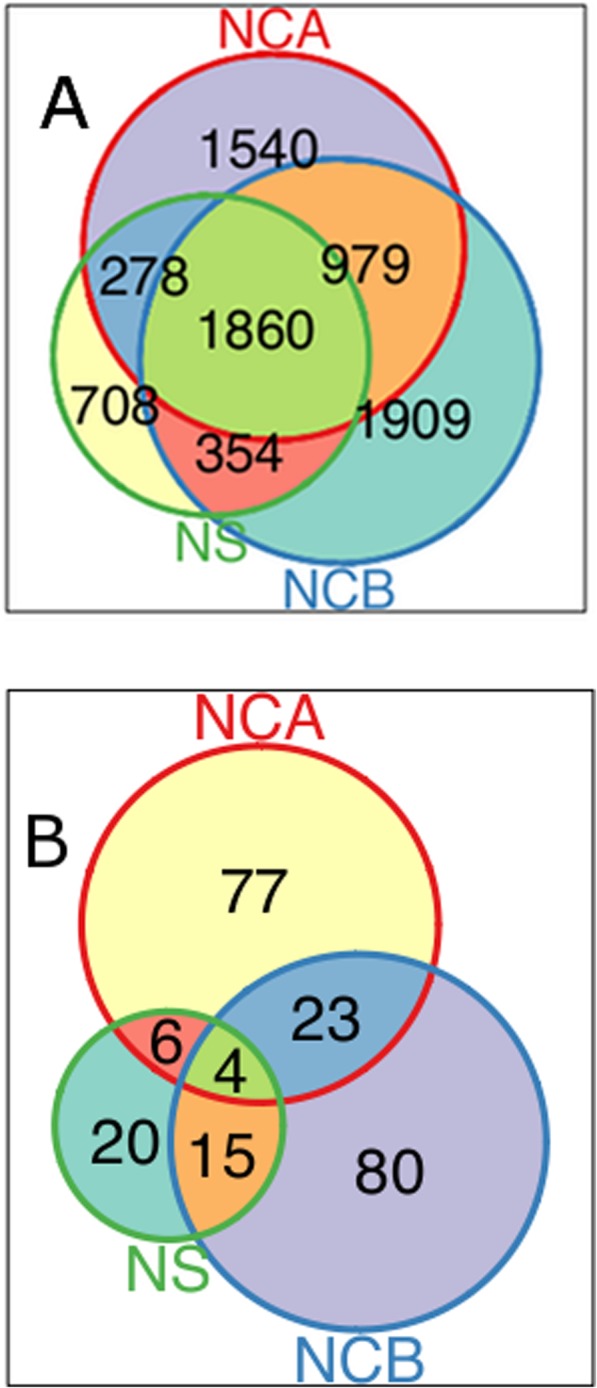
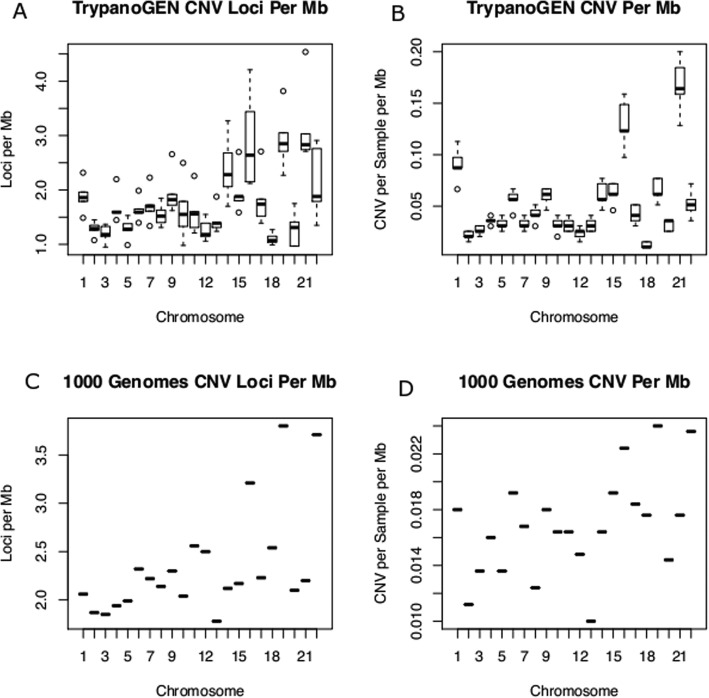
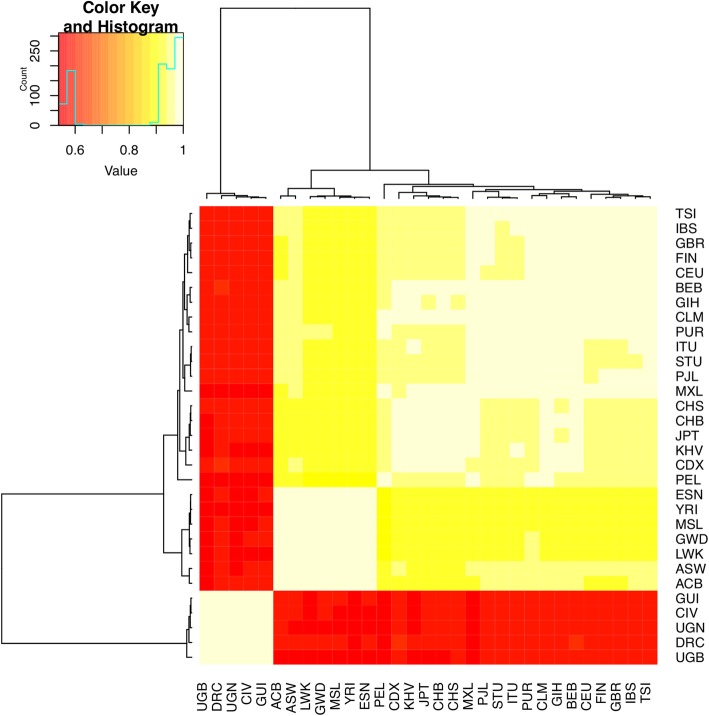
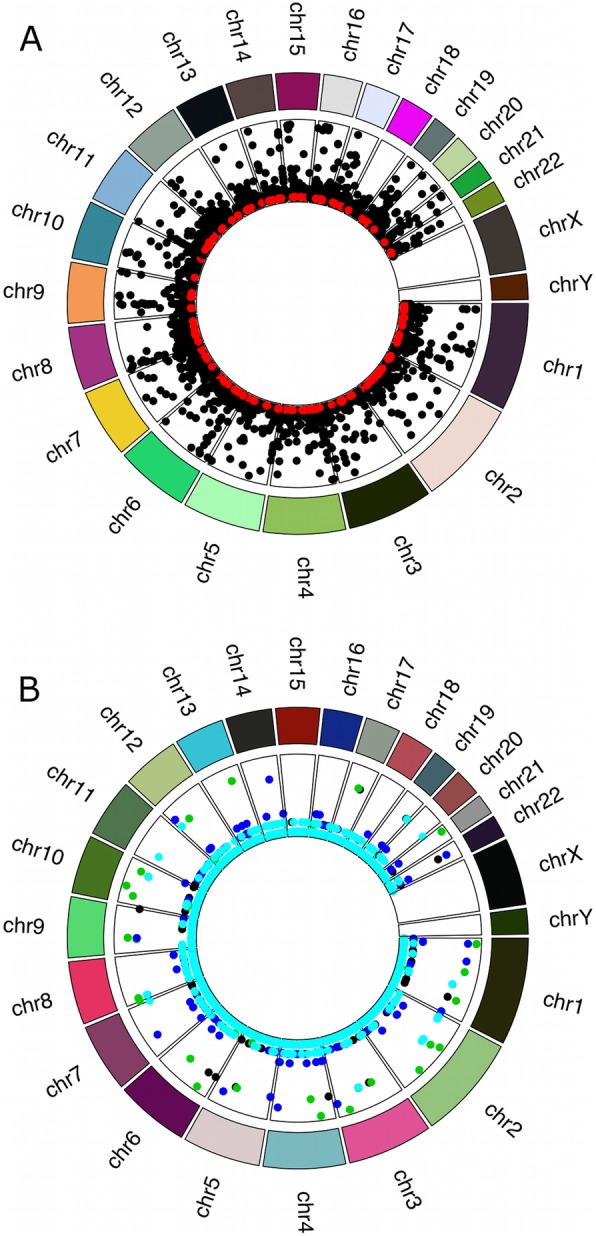
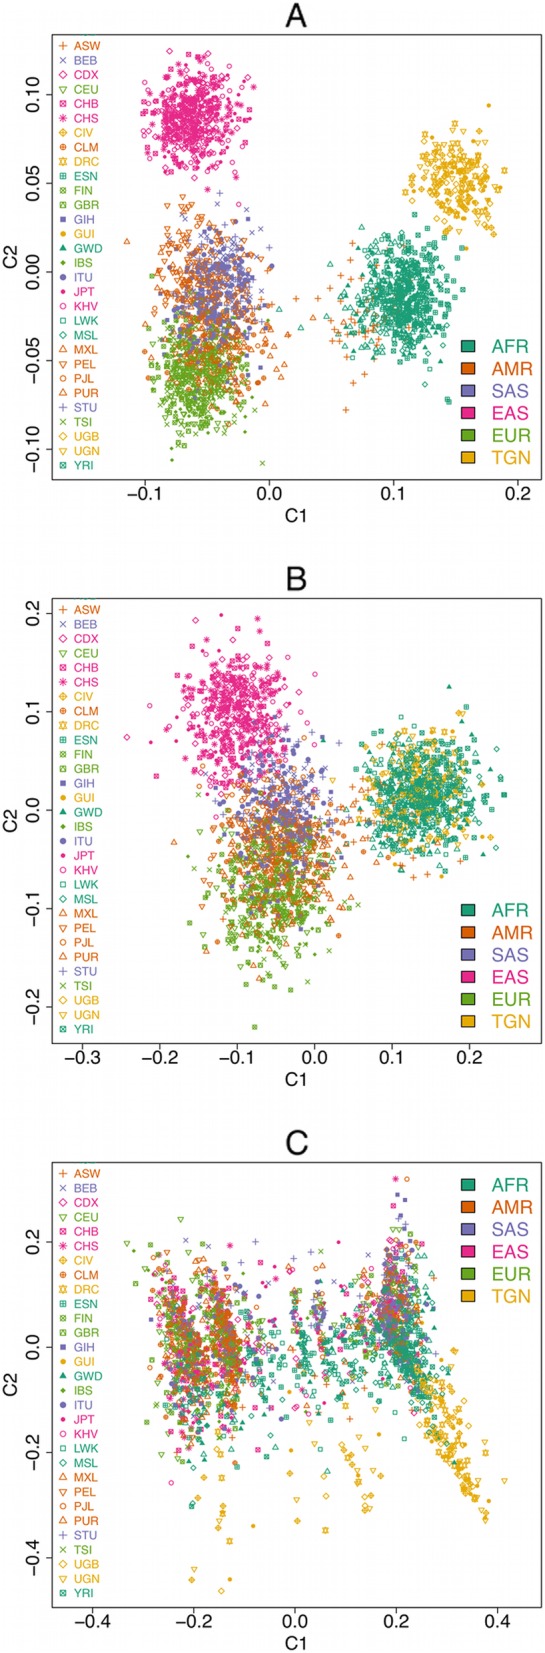
Results: We detected 7608 CNVRs, of which 2172 were only deletions, 2384 were only insertions and 3052 had both. We detected 224 previously un-described CNVRs. The majority of novel CNVRs were present at low frequency and were not shared between populations. We tested for evidence of selection associated with CNVs and also for population structure. Signatures of selection identified previously, using SNPs from the same populations, were overrepresented in CNVRs. When CNVs were tagged with SNP haplotypes to identify SNPs that could predict the presence of CNVs, we identified haplotypes tagging 3096 CNVRs, 372 CNVRs had SNPs with evidence of selection (iHS > 3) and 222 CNVRs had both. This was more than expected (p < 0.0001) and included loci where CNVs have previously been associated with HIV, Rhesus D and preeclampsia. When integrated with 1000 Genomes CNV data, we replicated their observation of population stratification by continent but no clustering by populations within Africa, despite inclusion of Nilo-Saharans and Niger-Congo populations within our dataset.

Conclusions: Novel CNVRs in the current study increase representation of African diversity in the database of genomic variants. Over-representation of CNVRs in SNP signatures of selection and an excess of SNPs that both tag CNVs and are subject to selection show that CNVs may be the actual targets of selection at some loci. However, unlike SNPs, CNVs alone do not resolve African ethno-linguistic groups. Tag haplotypes for CNVs identified may be useful in predicting African CNVs in future studies where only SNP data is available.

Keywords: Adaptation; CNV; Niger Congo A; Niger Congo B; Nilo-Saharan; Signatures of selection; Structural variation; Tag haplotypes.


Conflict of interest statement

The authors declare that they have no competing interests.

Figures

Fig. 1
Fig. 1
Selection of high confidence CNV and analysis strategy. GenomeSTRiP CNVR overlapping cn.MOPS CNVR were selected and singletons assessed for removal. The resulting consensus dataset was annotated to identify novel CNVs, show population structure deduced from CNV calls and tag SNP analysis
Fig. 2
Fig. 2
Venn diagram showing counts of CNVR shared between populations. a All CNVR from Niger Congo A (NCA), Niger Congo B (NCB) and Nilo-Saharan (NS) ethnic groups. CNVR overlapping 5 kb genomic regions were plotted for each population. A majority of the CNVR are shared between populations, but Nilo-Saharans appear to have the least CNVR, with most of them shared with the Niger Congo A and Niger Congo B. b Sharing of novel CNV regions between populations. Most novel CNVR are unique to individual populations studied whereas others are shared. To enable comparison, the genome was divided into 5 kb regions and regions with novel CNVR in each of these regions for each population were compared for overlaps
Fig. 3
Fig. 3
CNV density comparison between TrypanoGEN and the 1000 Genomes project. Counts of Loci per Mb and Counts of CNV per Mb for each chromosome in TrypanoGEN and 1000 Genomes project data. a Counts of CNVR per Mb in TrypanoGEN b CNV loci counts per Mb in TrypanoGEN c Counts of CNVR per Mb in 1000 Genomes d CNV loci counts per Mb in TrypanoGEN Both sets show similar patterns of CNV per chromosome, with 1000 Genomes data having tighter interquartile ranges
Fig. 4
Fig. 4
Heat Map showing Pearson Correlation coefficient between the Count of CNV in 10 Mb windows in each population across the genomes of TrypanoGEN and 1000 Genomes samples. The histogram in the legend indicates the number of correlations with each value of Pearson’s r, there are large numbers of correlations between 0.5 and 0.6 and also between 0.9 and 1. Correlation coefficients are high (> 0.9) between populations from the same dataset but lower (0.5–0.6) between populations from different data sets
Fig. 5
Fig. 5
Genomic distribution of CNVR and their frequency in our samples. a Known and novel CNVR are distributed throughout the genome, with novel CNVR having lower frequencies compared to known CNVR. The centre of the circle has the least frequency of < 1% whereas the outermost bounds represent higher frequencies of up to 100%. Novel CNVR shown in red are lower frequency compared to known CNVR shown in black. A few known CNVRs show high frequencies. b Comparison of frequencies in the various populations. No major differences in CNVR frequencies were found between populations. All populations are represented in the plot with different colours. The centre of the plot has the least frequency of 0% whereas the outermost bounds represent higher CNVR frequencies. Frequencies are similar across populations. The frequencies of CNVRs with CNV frequencies < 20% are set to 0% to enhance visibility. Cyan shows the CNV frequency of those common to GAS and all populations, UBB are in black, DRC are in green, CIV are in dark blue and UGN are in red
Fig. 6
Fig. 6
PCA plot showing CNV population structure in our data compared to 1000 Genomes. The PCA distinguishes major continental populations from each other, but is not able to resolve specific populations within the continental populations. Africans in the 1000 Genomes (AFR) are closer to our data (TGN). Conventions for major continental populations are described by the 1000 genomes project [8, 23]. b PCA plot showing population structure for bi-allelic deletion CNV. Phase information is non-ambiguous for bi-allelic deletions. The Africans in the 1000 Genomes overlay the TrypanoGEN African samples, indicating similar CNV in the datasets. c PCA plot showing population structure due to bi-allelic insertion CNV. There was no specific pattern observed as fewer bi-allelic insertions were available in the data

Similar articles

Cited by

References

    1. Redon R, Ishikawa S, Fitch KR, Feuk L, Perry GH, Andrews TD, et al. Global variation in copy number in the human genome. Nature. 2006;444:444–454. doi: 10.1038/nature05329. - DOI - PMC - PubMed
    1. Sudmant PH, Mallick S, Nelson BJ, Hormozdiari F, Krumm N, Huddleston J, et al. Global diversity, population stratification, and selection of human copy-number variation. Science. 2015;349:aab3761. doi: 10.1126/science.aab3761. - DOI - PMC - PubMed
    1. Sudmant PH, Rausch T, Gardner EJ, Handsaker RE, Abyzov A, Huddleston J, et al. An integrated map of structural variation in 2,504 human genomes. Nature. 2015;526:75–81. doi: 10.1038/nature15394. - DOI - PMC - PubMed
    1. Gamazon ER, Stranger BE. The impact of human copy number variation on gene expression. Brief Funct Genomics. 2015;14:352–357. doi: 10.1093/bfgp/elv017. - DOI - PMC - PubMed
    1. Perry GH, Dominy NJ, Claw KG, Lee AS, Fiegler H, Redon R, et al. Diet and the evolution of human amylase gene copy number variation. Nat Genet. 2007;39:1256–1260. doi: 10.1038/ng2123. - DOI - PMC - PubMed

LinkOut - more resources