. 2020 Apr 9;18(1):162.
doi: 10.1186/s12967-020-02313-z.

The endless frontier? The recent increase of R&D productivity in pharmaceuticals

Affiliations

The endless frontier? The recent increase of R&D productivity in pharmaceuticals

Fabio Pammolli et al. J Transl Med. .

Abstract

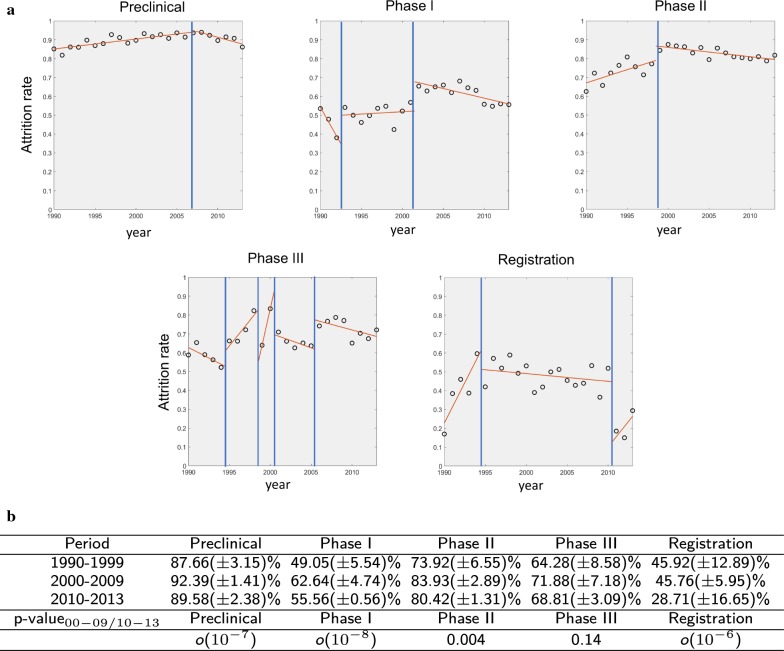
Background: Studies on the early 2000s documented increasing attrition rates and duration of clinical trials, leading to a representation of a "productivity crisis" in pharmaceutical research and development (R&D). In this paper, we produce a new set of analyses for the last decade and report a recent increase of R&D productivity within the industry.

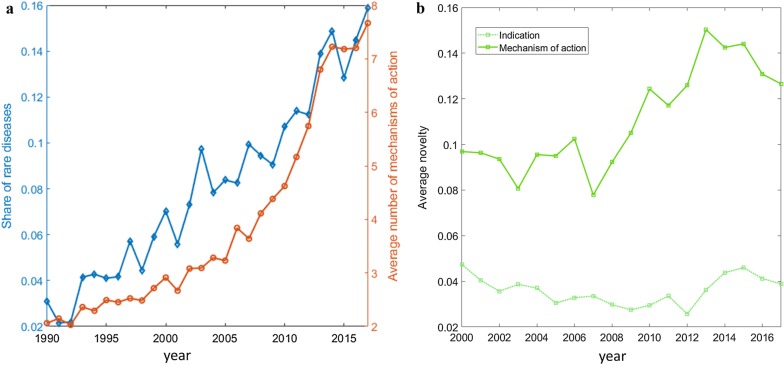
Methods: We use an extensive data set on the development history of more than 50,000 projects between 1990 and 2017, which we integrate with data on sales, patents, and anagraphical information on each institution involved. We devise an indicator to quantify the novelty of each project, based on its set of mechanisms of action.

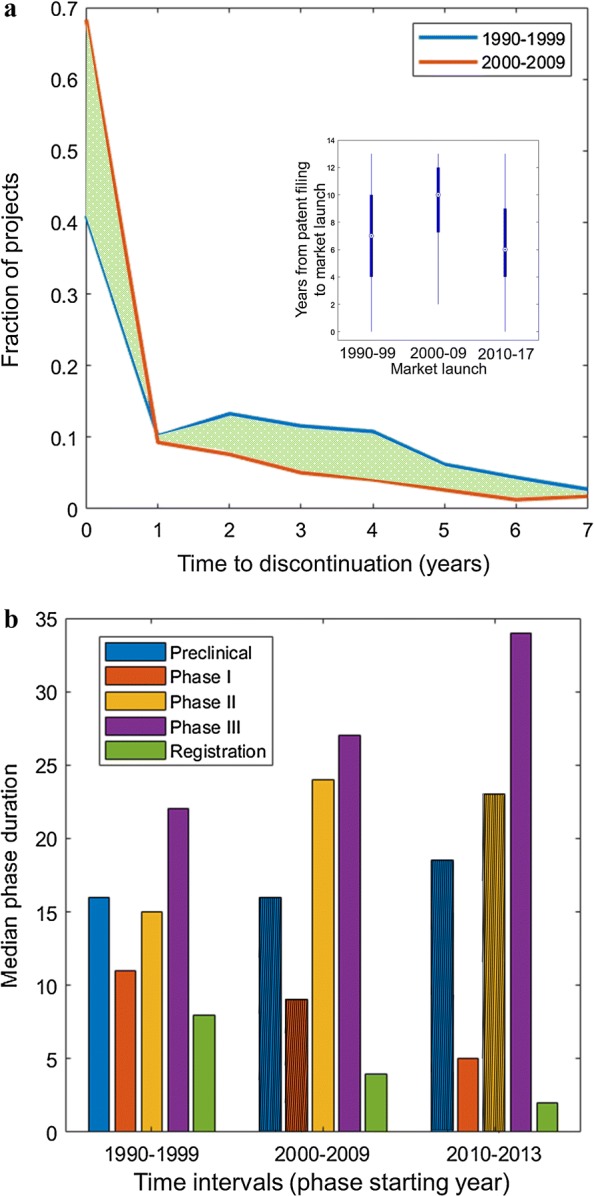
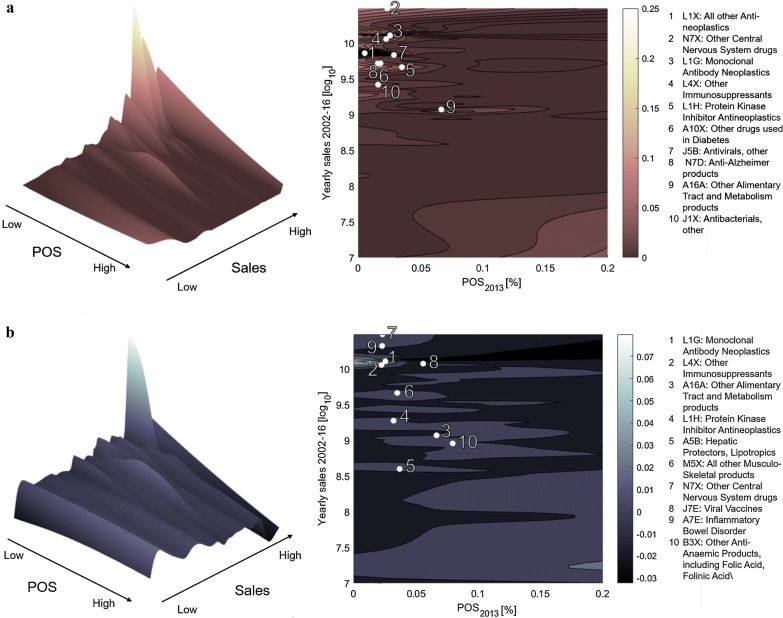
Results: First, we investigate how R&D projects are allocated across therapeutic areas and find a polarization towards high uncertainty/high potential reward indications, with a strong focus on oncology. Second, we find that attrition rates have been decreasing at all stages of clinical research in recent years. In parallel, for each phase, we observe a significant reduction of time required to identify projects to be discontinued. Moreover, our analysis shows that more recent successful R&D projects are increasingly based on novel mechanisms of action and target novel indications, which are characterized by relatively small patient populations. Third, we find that the number of R&D projects on advanced therapies is also growing. Finally, we investigate the relative contribution to productivity variations of different types of institutions along the drug development process, with a specific focus on the distinction between the roles of Originators and Developers of R&D projects. We document that in the last decade Originator-Developer collaborations in which biotech companies act as Developers have been growing in importance. Moreover, we show that biotechnology companies have reached levels of productivity in project development that are equivalent to those of large pharmaceutical companies.

Conclusions: Our study reports on the state of R&D productivity in the bio-pharmaceutical industry, finding several signals of an improving performance, with R&D projects becoming more targeted and novel in terms of indications and mechanisms of action.

Keywords: Attrition rates; Pharmaceutical innovation; R&D productivity.


Conflict of interest statement

The authors declare that they have no competing interests.

Figures

Fig. 1
Fig. 1
a Time evolution of attrition rates at different stages of drug development. Black circles: data; red solid lines: linear regression in the corresponding time window; blue vertical solid line: changepoint. In a given year, the attrition rate for each development phase is defined as the percentage of projects that started the phase in that year and failed to pass to the subsequent phase within 4 years (accordingly, 2013 is the last year we do consider). b Average (± standard deviation) yearly phase-by-phase attrition rates in three different time intervals (1990–1999, 2000–2009, 2010–2013). We also report the significance level of a Wilcoxon rank sum test [25] on the difference of attrition rates in 2000–2009 and 2010–2013
Fig. 2
Fig. 2
a Time needed for project discontinuation; 1990–1999 (blue), 2000–2009 (red). We highlight in green the area between the two curves. We show the fraction of projects that are discontinued after x years from the start of preclinical research. The distribution accounts for a maximum discontinuation time of 8 years, so we focus on projects started before 2010. Inset: boxplot of the time interval between patent filing and market launch years, based on the year of market launch, in three different time intervals (1990–1999, 2000–2009, 2010–2017). b Median phase duration per each phase of the drug development process, in three different time intervals (phases started in 1990–1999, 2000–2009, 2010–2013). The duration of a development phase in a year is defined as the median time required to the projects that started the focal phase in the given year to pass to the subsequent phase. The median duration is computed considering only transitions with duration lower than or equal to 4 years, to make a sound comparison across decades. When the median of a phase duration is not significantly different from that of the previous decade, the corresponding value is barred
Fig. 3
Fig. 3
Distribution of R&D projects, by probability of success and size of the market. In each panel, the probability of success (POS) is shown on the x axis and the logarithm of potential sales (yearly average computed in 2002–2016) on the y axis. A contour plot and a three-dimensional view of the same distribution are shown. In the contour plot we highlight the top 10 ATC3 classes by the focal metric being shown on the vertical axis. These are listed besides the contour plots. a The vertical axis shows the percentage distribution of research and development (R&D) projects by POS and sales level. The distribution of R&D efforts is concentrated in the upper left hand corner of the plot (indicating high sales and low POS). b The vertical axis shows the share variation between 2002–2009 and 2010–2017, again as a function of POS and sales. Positive values (peaks in the plot) represent areas in which the research efforts have increased from 2002–2009 to 2010–2017, whereas negative values (holes in the plot) correspond to a reduction of research intensity
Fig. 4
Fig. 4
Share of rare indications, number of mechanisms of action, and novelty of indications and mechanisms of action. a Evolution in time of the share of projects targeting rare diseases (i.e. having a prevalence of fewer than 200,000 affected individuals in the US) and of the average number of mechanisms of action per project, between 1990 and 2017, by project starting year (i.e. the year the focal project entered preclinical research). b Evolution in time of median novelty of indication/mechanism of action per project, between 2000 and 2017, by project starting year

References

    1. Bush V. Science, the endless frontier: a report to the president. Washington, D. C.: U.S. Government Printing Office; 1945.
    1. Gambardella A. Science and innovation: the US pharmaceutical industry during the 1980s. Cambridge: Cambridge University Press; 1995.
    1. Pammolli F, Riccaboni M. Perspective: market structure and drug innovation. Health Affairs. 2004;26(1):48–50. doi: 10.1377/hlthaff.23.1.48. - DOI - PubMed
    1. McKelvey M, Orsenigo L, Pammolli F. Pharmaceuticals analyzed through the lens of a sectoral innovation system. In: Malerba F, editor. Sectoral systems of innovation: concepts, issues and analyses of six major sectors in Europe. Milan: Bocconi University; 2004. pp. 73–120.
    1. Pammolli F, Magazzini L, Riccaboni M. The productivity crisis in pharmaceutical R&D. Nat Rev Drug Discov. 2011;10:428–438. doi: 10.1038/nrd3405. - DOI - PubMed

Substances