. 2020 Jun 1;80(11):2243-2256.
doi: 10.1158/0008-5472.CAN-19-3580. Epub 2020 Apr 9.

H2A Monoubiquitination Links Glucose Availability to Epigenetic Regulation of the Endoplasmic Reticulum Stress Response and Cancer Cell Death

Affiliations

H2A Monoubiquitination Links Glucose Availability to Epigenetic Regulation of the Endoplasmic Reticulum Stress Response and Cancer Cell Death

Yilei Zhang et al. Cancer Res. .

Abstract

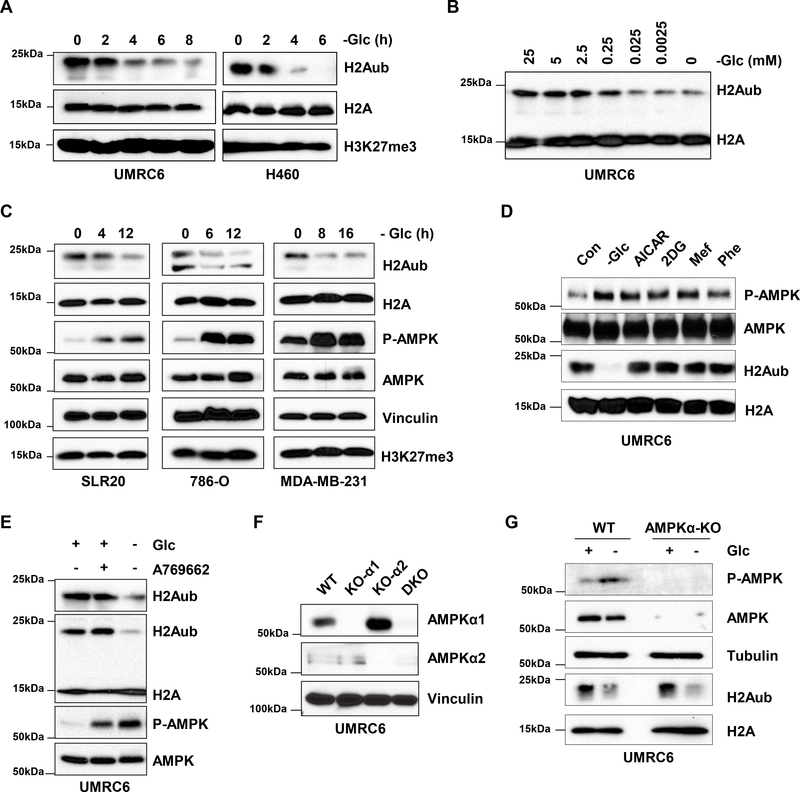
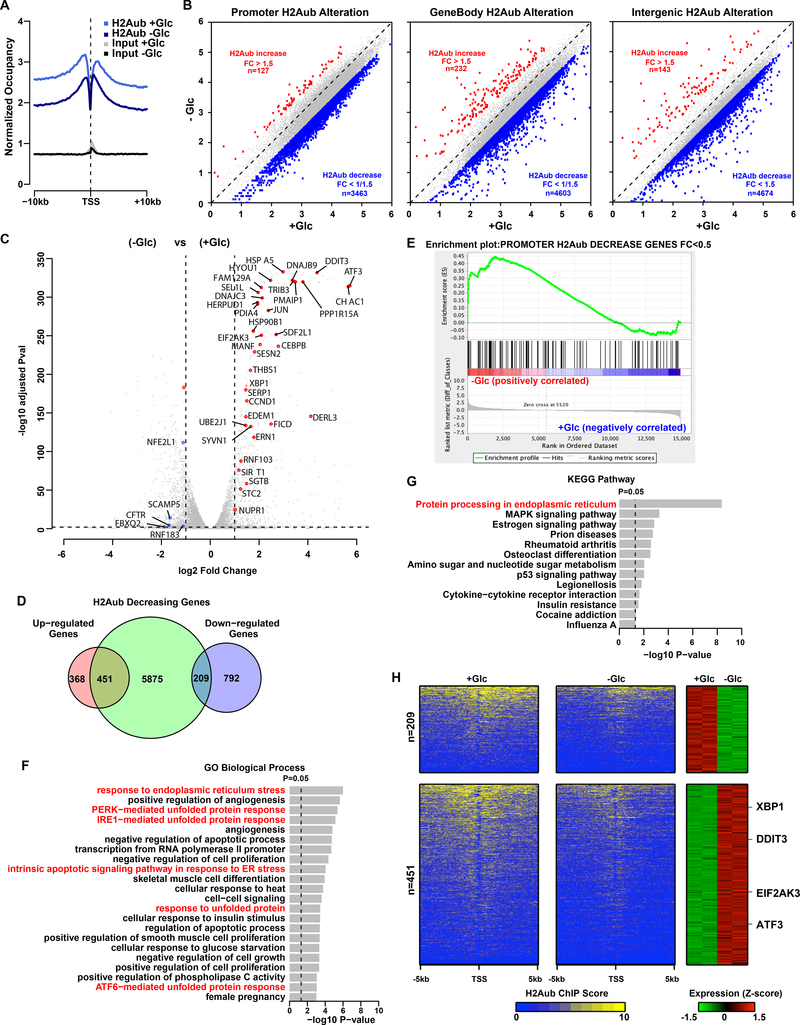
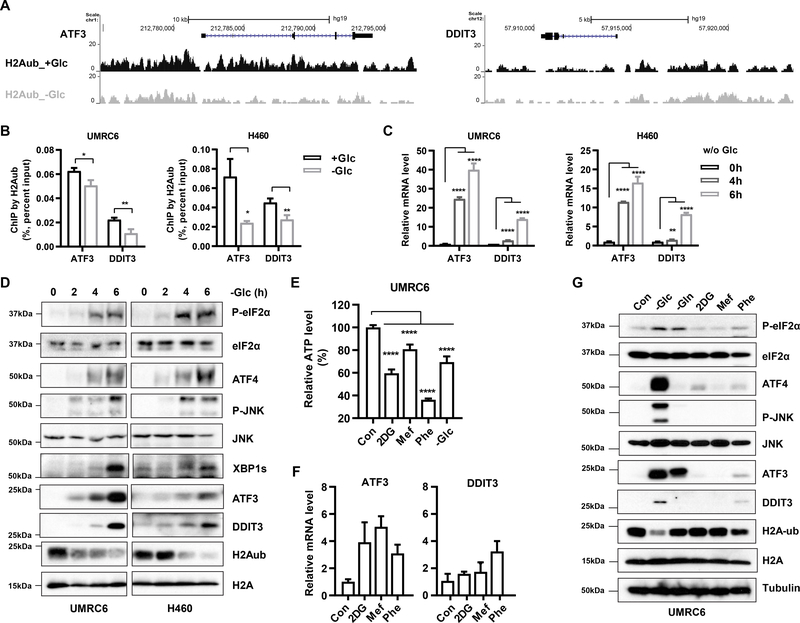
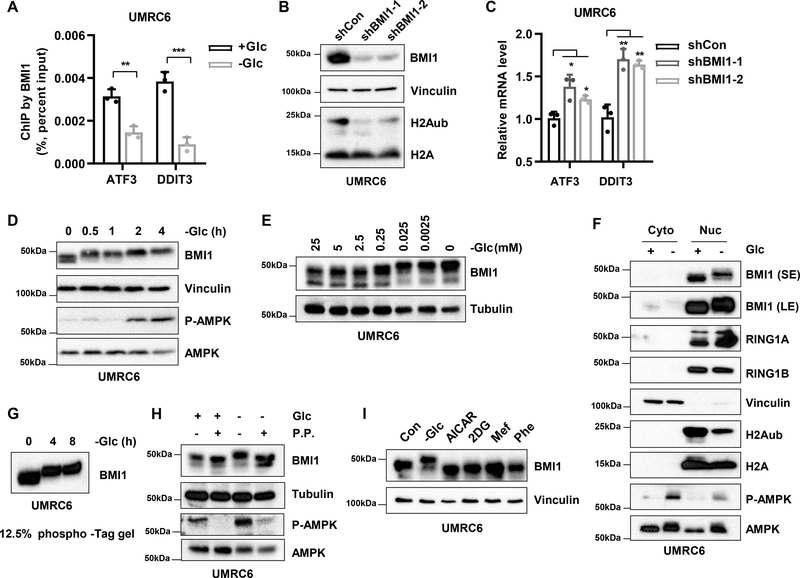
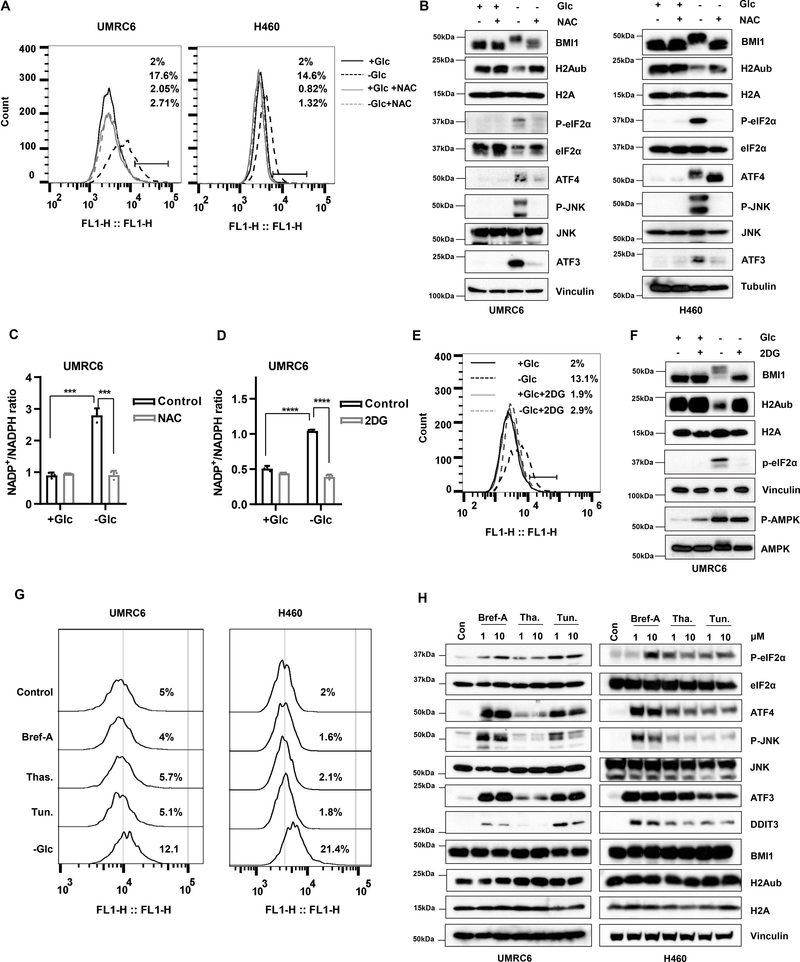
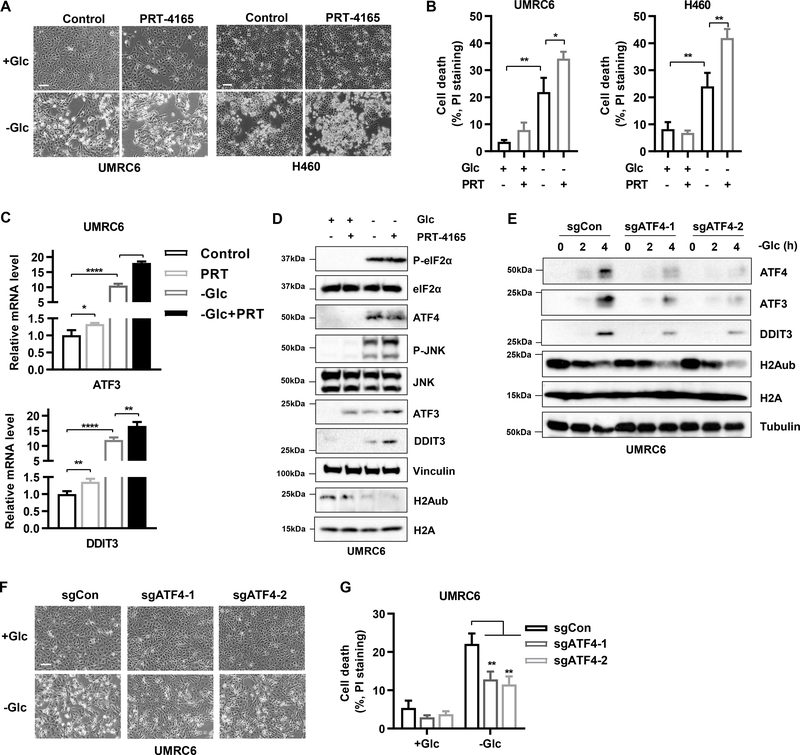
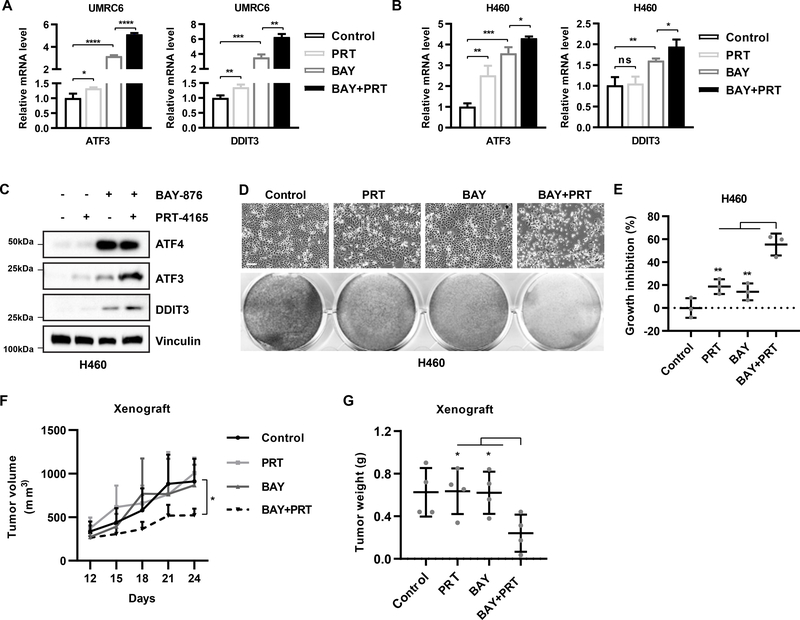
Epigenetic regulation of gene transcription has been shown to coordinate with nutrient availability, yet the mechanisms underlying this coordination remain incompletely understood. Here, we show that glucose starvation suppresses histone 2A K119 monoubiquitination (H2Aub), a histone modification that correlates with gene repression. Glucose starvation suppressed H2Aub levels independently of energy stress-mediated AMP-activated protein kinase activation and possibly through NADPH depletion and subsequent inhibition of BMI1, an integral component of polycomb-repressive complex 1 (PRC1) that catalyzes H2Aub on chromatin. Integrated transcriptomic and epigenomic analyses linked glucose starvation-mediated H2Aub repression to the activation of genes involved in the endoplasmic reticulum (ER) stress response. We further showed that this epigenetic mechanism has a role in glucose starvation-induced cell death and that pharmacologic inhibition of glucose transporter 1 and PRC1 synergistically promoted ER stress and suppressed tumor growth in vivo. Together, these results reveal a hitherto unrecognized epigenetic mechanism coupling glucose availability to the ER stress response. SIGNIFICANCE: These findings link glucose deprivation and H2A ubiquitination to regulation of the ER stress response in tumor growth and demonstrate pharmacologic susceptibility to inhibition of polycomb and glucose transporters.


Conflict of interest statement

Conflict of interest statement: No potential conflicts of interest were disclosed.

Figures

Figure 1.
Figure 1.
Glucose starvation decreases H2Aub independent of energy stress and AMPK. A, Western blots show that glucose deprivation decreases H2A monoubiquitination (H2Aub) levels in UMRC6 and H460 tumor cell lines in a time-dependent manner. B, Western blots show that glucose deprivation for 4 hours decreases H2Aub levels in UMRC6 tumor cells in a concentration-dependent manner. C, Western blots show that glucose deprivation decreases H2Aub levels in additional tumor cell lines in a time-dependent manner. D, Western blots show H2Aub levels in UMRC6 tumor cells after a 4-hour incubation in glucose-free medium or a 16-hour incubation with 1 mM 5-aminoimidazole-4-carboxamide ribonucleotide (AICAR), 10 mM 2-deoxy-D-glucose (2DG), 2 mM metformin (Mef), or 2 mM phenformin (Phe). E, Western blots show H2Aub levels in UMRC6 cells after a 4-hour incubation in glucose-free medium or a 16-hour incubation with 200 μM A769662. F, Western blots show AMPKα1 or AMPKα2 expression in CRISPR/Cas9-mediated knockout (KO) cells. G, Western blots show H2Aub and phosphorylated AMPKα levels in wild-type (WT) or AMPKα1/2 double-knockout (AMPKα-KO) cells after 4 hours of glucose withdrawal.
Figure 2.
Figure 2.
Genome-wide analyzes link H2Aub regulation to endoplasmic reticulum (ER) stress upon glucose deprivation. A, Average profiles of H2Aub in the indicated conditions. Glc, glucose; TSS, transcription start site. B, Scatter plots show changes in H2Aub occupancy due to glucose deprivation at the promoter, genebody, and intergenic regions. H2Aub occupancy was calculated as log2 kilobase per million read (RPKM) value. FC, fold change. C, Volcano plot shows changes in gene expression due to glucose deprivation, with ER stress genes highlighted in red. P values were adjusted by Bonferroni correction. D, Venn diagram shows overlap between 6,535 genes with decreased H2Aub occupancies and 1,820 differentially expressed genes (fold change > 2, false discovery rate < 0.05) upon glucose deprivation in UMRC6 cells. E, Gene set enrichment analysis showing that the 324 genes with >2-fold reduction in H2Aub were positively enriched in glucose deprivation upregulated genes. F, Gene ontology (GO) and G, Kyoto Encyclopedia of Genes and Genomes (KEGG) enrichment analyses of the 451 H2Aub decreased and upregulated genes. P values were determined by Fisher’s exact test and adjusted by Bonferroni correction. H, Left 2 panels, heatmaps show the H2Aub profile around the TSS of 209 downregulated and 451 upregulated genes from overlap analysis in D, in decreasing order. Right panel shows the expression levels of the corresponding genes.
Figure 3.
Figure 3.
Glucose starvation decreases H2Aub binding on ER stress genes and induces their expression. A, H2Aub ChIP–seq occupancy profiles at the ATF3 and DDIT3 loci in UMRC6 cells treated or not treated with glucose. B, ChIP-qPCR analysis of H2Aub levels on ATF3 and DDIT3 gene promoters upon glucose starvation in UMRC6 and H460 tumor cells. C, RT-PCR analysis of mRNA levels of ATF3 and DDIT3 genes upon glucose starvation for indicated times in UMRC6 and H460 cells. D, Western blots show activation of ER stress signaling in UMRC6 and H460 cells upon glucose starvation for the indicated times. E, UMRC6 cells were treated with 10 mM 2-deoxyglucose (2DG), 2 mM meformin, or 2 mM phenformin for 6 hours, or glucose-free medium for 3 hours, after which ATP levels were measured in the treated cells and normalized to levels in untreated cells. F, UMRC6 cells were treated as described in E followed by RT-PCR analysis for mRNA levels of ATF3 and DDIT3 genes. G, Western blots show H2Aub levels and ER stress signaling in UMRC6 cells after a 16-hour incubation with 10 mM 2DG, 2 mM meformin, or 2 mM phenformin, a 3-hour incubation in glucose-free medium, or a 6-hour incubation in glutamine-free medium. Error bars are mean ± s.d., n=3 (B, C, F) or 5 (E) independent repeats. Two-tailed unpaired Student’s t tests were used to compare two groups. *P < 0.05; **P < 0.01; ***P < 0.001; ****P < 0.0001.
Figure 4.
Figure 4.
Glucose starvation promotes BMI1 phosphorylation and decreases its binding to ER stress genes. A, ChIP-qPCR analysis of BMI1 binding on ATF3 and DDIT3 gene promoters in UMRC6 cells after 8 hours of glucose (Glc) deprivation. B, Western blots show decreased H2Aub levels upon BMI1 knockdown in UMRC6 cells. C, RT-PCR analysis of mRNA levels of ATF3 and DDIT3 in UMRC6 cells after BMI1 knockdown. D, Western blots show protein levels in UMRC6 cells cultured in glucose-free medium for the indicated times. E, Western blots show protein levels in UMRC6 cells cultured for 6 hours in medium with the indicated glucose concentrations. F, UMRC6 cultured in media with or without glucose for 4 hours followed by fractionation and Western blotting analysis. Vinculin, a marker for cytosol (Cyto); H2A, a marker for nucleus (Nuc). G, Phosphorylation of BMI1 in UMRC6 cells upon glucose deprivation was analyzed by Phos-tag sodium dodecyl sulfate polyacrylamide gel electrophoresis (SDS-PAGE). H, UMRC6 cells were cultured with or without glucose for 4 hours, after which cell lysates were subjected to lambda phosphatase (P.P.) treatment followed by western blotting. I, Western blots show protein levels in UMRC6 cells after the treatments described in Fig. 1D. Error bars are mean ± s.d., n=3 independent repeats. Two-tailed unpaired Student’s t tests were used to compare two groups. *P < 0.05; **P < 0.01; ***P < 0.001; ****P < 0.0001.
Figure 5.
Figure 5.
Glucose starvation regulates BMI1 phosphorylation and H2Aub likely through NADPH depletion. A, Relative ROS levels of UMRC6 and H460 cells in glucose-free medium with or without 5 mM N-acetyl cysteine for 4 hours were measured by H2DCFDA staining followed by FACS analysis. B, Western blotting analyzes of protein levels in UMRC6 and H460 cells treated as described in A. C, NADP+ and NADPH levels in UMRC6 cells treated cultured in medium with or without glucose combined with vehicle or NAC (5mM) for 4 hours. NADP+ /NADPH ratio was plotted. D, NADP+ and NADPH levels in UMRC6 cells cultured in medium with or without glucose combined with vehicle or 2DG (10mM) for 4 hours were measured and plotted as NADP+/NADPH ratio. E, Relative ROS levels in UMRC6 cells treated as described in D followed by H2DCFDA staining and FACS analysis. F, UMRC6 cells were treated as described in D followed by Western blotting analysis. G, Relative ROS levels in UMRC6 and H460 cells after a 16-hour incubation with 10 μM brefeldin A (Bref-A), thapsigargin (Thas.), or tunicamycin (Tun.) or a 4-hour incubation with glucose-free medium were measured by H2DCFDA staining followed by FACS analysis. H, Western blots show H2Aub levels and ER stress signaling in URMC6 and H460 cells treated with the indicated drugs at the concentrations described in G. Error bars are mean ± s.d., n=3 independent repeats. Two-tailed unpaired Student’s t tests were used to compare two groups. *P < 0.05; **P < 0.01; ***P < 0.001; ****P < 0.0001.
Figure 6.
Figure 6.
PRC1 inactivation cooperates with ATF4 induction to promote cell death under glucose starvation. A, Representative photos of UMRC6 and H460 cells pretreated or not pretreated with 50 μM PRT-4165 for 16 hours followed by culturing in glucose-free medium for 4 hours. Scale bar, 100 μm. B, Propidium iodide staining of cells treated as described in A followed by FACS analysis. C, RT-PCR analysis of ATF3 and DDIT3 mRNA levels in UMRC6 cells pretreated or not pretreated with 50 μM PRT-4165 for 16 hours followed by culturing in glucose-free medium for 4 hours. D, Western blots show protein levels in UMRC6 cells pretreated with 50 μM PRT-4165 and then cultured in medium with or without glucose. E, Western blots show protein levels in CRISPR/Cas9 mediated ATF4-knockout cells cultured in glucose-free medium for 4 hours. F, Representative photos of the treated cells in D. G, Propidium iodide staining of cells treated as described in E followed by FACS analysis. Error bars are mean ± s.d., n=3 independent repeats. Two-tailed unpaired Student’s t tests were used to compare two groups. *P < 0.05; **P < 0.01; ***P < 0.001; ****P < 0.0001.
Figure 7.
Figure 7.
Combined inhibition of GLUT1 and PRC1 synergistically promotes ER stress and suppresses tumor growth. A, RT-PCR analysis of ATF3 and DDIT3 mRNA levels in URMC6 cells treated with 2 μM BAY-876, 50 μM PRT-4165, or both for 16 hours. B, RT-PCR analysis of ATF3 and DDIT3 mRNA levels in H460 cells treated with 5 μM BAY-876, 50 μM PRT-4165, or both for 16 hours. C, Western blots show protein levels in H460 cells treated with 5 μM BAY-876, 50 μM PRT-4165, or both for 24 hours. D, Representative photos of H460 cells treated with 5 μM BAY-876, 50 μM PRT-4165, or both for 48 hours. Bottom row shows cells stained with crystal violet solution. E, Growth inhibition after drug treatments was calculated after quantification of crystal violet staining for H460 cells as described in D. F, Tumor volume of xenografts generated from H460 cells after the indicated treatments, which were given as daily injections. n=4. G, Tumor weights at the end of treatment in each treatment group. n=4. Error bars are mean ± s.d., n=3 (A, B, E) or 4 (G) independent repeats. Two-tailed unpaired Student’s t tests were used to compare two groups. *P < 0.05; **P < 0.01; ***P < 0.001; ****, P < 0.0001.

References

    1. Efeyan A, Comb WC, Sabatini DM. Nutrient-sensing mechanisms and pathways. Nature 2015;517:302–10 - PMC - PubMed
    1. Lu C, Thompson CB. Metabolic regulation of epigenetics. Cell Metab 2012;16:9–17 - PMC - PubMed
    1. Sharma U, Rando OJ. Metabolic Inputs into the Epigenome. Cell Metab 2017;25:544–58 - PubMed
    1. Jaenisch R, Bird A. Epigenetic regulation of gene expression: how the genome integrates intrinsic and environmental signals. Nat Genet 2003;33 Suppl:245–54 - PubMed
    1. Campbell SL, Wellen KE. Metabolic Signaling to the Nucleus in Cancer. Mol Cell 2018;71:398–408 - PubMed

Publication types

MeSH terms