. 2020 Apr 10;368(6487):eaaz5390.
doi: 10.1126/science.aaz5390.

Widespread receptor-driven modulation in peripheral olfactory coding

Affiliations

Widespread receptor-driven modulation in peripheral olfactory coding

Lu Xu et al. Science. .

Abstract

Olfactory responses to single odors have been well characterized but in reality we are continually presented with complex mixtures of odors. We performed high-throughput analysis of single-cell responses to odor blends using Swept Confocally Aligned Planar Excitation (SCAPE) microscopy of intact mouse olfactory epithelium, imaging ~10,000 olfactory sensory neurons in parallel. In large numbers of responding cells, mixtures of odors did not elicit a simple sum of the responses to individual components of the blend. Instead, many neurons exhibited either antagonism or enhancement of their response in the presence of another odor. All eight odors tested acted as both agonists and antagonists at different receptors. We propose that this peripheral modulation of responses increases the capacity of the olfactory system to distinguish complex odor mixtures.


Conflict of interest statement

Competing interests: E.M.C.H., W.L., and V.V. declare a potential financial conflict of interest relating to the licensing of SCAPE microscopy intellectual property to Leica Microsystems for commercial development. S.F., E.M.C.H., V.V., and W.L. receive funds for advising Firmenich SA in work related to that presented here.

Figures

Fig. 1.
Fig. 1.. Imaging of intact olfactory epithelium using SCAPE microscopy.
(A) Schematic of an intact olfactory epithelium imaging platform for SCAPE microscopy. A custom-designed glass-bottomed perfusion chamber was placed above the inverted objective with water immersion. The right half of the mouse head was mounted in the perfusion chamber with the olfactory turbinates exposed. The perfusion chamber was designed to control the perfusion flow through the nasal cavity with the inlet at the nostril and the outlet at the throat (blue arrows). The imaging area typically covered the ventral half of either turbinate IIb or III and some of the neighboring turbinates (yellow rectangle). (B) Three-dimensional volumetric rendering of SCAPE data acquired from the olfactory epithelium at the resting level without odor stimulus showing a 1600 × 1200 × 350 μm field of view. A zoom-in side view (Y-Z, orange box) and a top-down view (X-Y, yellow box) are shown on the right. Both views are the maximum-intensity projections of 10-μm substacks. Scale bar, 50 μm.
Fig. 2.
Fig. 2.. GCaMP time courses of individual OSNs extracted from the raw SCAPE image.
(A) Chemical structures of the three odors used as odor stimuli (odor set 1). (B) OSN responses to acetophenone (ACE, 100 μM) alone and to the three-odor mixture (MIX, each at 100 μM). Each image was cropped from a 1000 × 500 × 200 μm volume taken at peak responses. Two OSNs are highlighted. Scale bar, 20 μm. (C and C’) Time courses of the highlighted OSNs [yellow and orange boxes in (B)]. Data were extracted directly from the raw volumetric time series and calculated as ΔF/F. A 30-s-long odor stimulus (MIX or each odor alone) was delivered in each trial, with a 2.5-min interval between stimulus applications.
Fig. 3.
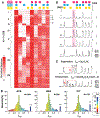
Fig. 3.. Response profile of odor set 1.
(A) Heatmap of normalized peak responses (N = 11,936, 5 mice) to 100 μM concentrations of ACE, BEA, CIT, or their mixtures. Odor stimuli (columns) were given in a pseudorandom manner for each mouse and realigned for this presentation as denoted by the colored squares at the top. OSNs (rows) were clustered into eight subgroups (I to VIII) on the basis of k-means clustering. (B) Time courses of individual OSNs in subgroups I and II showing inhibition and suppression (cells I and ii; primarily suppressed by citral), no effect (cell iii), and enhancement (cells iv and v). The final peak shows the response to 50 μM forskolin (FORK) as a control for all viable OSNs. (C) Quantification of the modulation effects. For suppression, Imod was calculated as (d0d1)/d1, where d0 is the corrected response to the mixture and d1 is the dominant single-odor response. When calculating enhancement, the formula was modified to Imod = max{[(d0d2d3) – d1]/d1, 0}, where d2 and d3 are the responses to nondominant odors. When [(d0d2d3) – d1]/d1 resulted in a negative value, the Imod value was set to zero to avoid misinterpretation. Note that this method may underestimate the effect of enhancement. (D) Representations of the modulation effects on ACE-, BEA-, and CIT-dominant neurons (subgroups II, III, and IV, respectively). Red indicates that cell responses to the individual odors were inhibited by the mixture and blue indicates enhancement.
Fig. 4.
Fig. 4.. Dose-dependent suppression or enhancement of acetophenone by 100 μM citral.
(A) Normalized response heatmap of acetophenone-activated neurons suppressed by citral (N = 410). Neurons were stimulated by an increasing concentration of ACE (10 to 300 μM) in the presence or absence of 100 μM CIT, as denoted by colored squares at the top. (B) Time course of an individual OSN suppressed by 100 μM citral. (C) Effect of 100 μM citral as an antagonist. Dose-dependent responses (mean ± SEM) were plotted and fitted with the Hill equation. Responses to acetophenone alone are plotted in black (Hill coefficient = 1.34, EC50 = 23.0 μM); responses to acetophenone + citral are plotted in red (Hill coefficient = 1.99, EC50 = 101.2 μM). (D) Normalized response heatmap of acetophenone-activated neurons enhanced by citral (N = 301). (E) Time course of an individual OSN showing enhancement. (F) Effect of 100 μM citral as an enhancer. Only the 119 OSNs with no baseline response to 100 μM citral were used to plot the dose-dependent curves (mean ± SEM). Responses to acetophenone alone are plotted in black and responses to acetophenone + citral are plotted in red. Acetophenone alone: Hill coefficient = 1.95, EC50 = 125.1 μM; acetophenone + citral: Hill coefficient = 0.87, EC50 = 44.1 μM.
Fig. 5.
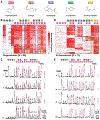
Fig. 5.. Acetophenone responses can be modulated by multiple odors.
(A) Chemical structures of acetophenone and odors tested as modulators. (B) Normalized response heatmap of suppressed OSNs (N = 80). OSNs were first stimulated with 100 μM dorisyl, isoraldeine, γ-terpinene, or isoamyl acetate individually. Each of the odors was then tested against 30 μM ACE. Odor stimuli are denoted by colored squares at the top [color coding as in (A)]. The columns of the heatmap were reordered for easier visualization of the suppression effects. Neurons showing suppression effects are boxed in different colors corresponding to the different modulators. (C) Time courses of four OSNs showing suppression. Responses to 30 μM acetophenone alone are highlighted by pink rectangles; arrows with different colors indicate suppression and/or inhibition by the corresponding odors. (D) Normalized response heatmap of enhanced OSNs (N = 73). The columns of the heatmap were reordered for easier visualization of the enhancement effects. OSNs showing enhancement effects were boxed in different colors corresponding to the different modulators. (E) Time courses of four OSNs showing enhancement. Arrows with different colors indicate enhancement by the corresponding odors.
Fig. 6.
Fig. 6.. Diversified coding capacity through modulation.
Two conceptual models are shown to contrast their robustness in odor mixture coding. (Left) No Modulation model: Suppose odors X, Y, and Z (all monomolecular compounds) can each activate a subset of odorant receptors. In this model, mixing odor Y with odor X would recruit two more receptors, but adding Z will not produce a different perception, although its response profile only partially overlaps with X and Y. (Right) Modulation model: In this model, all receptors are subject to modulation in addition to their activation profiles. Under one possible circumstance (one similar to what we observed), mixing odors X and Y results in the inhibition of receptor 2 and the enhancement of receptor 8. Adding odor Z into the mixture inhibits receptor 5 and enhances receptor 7. As a result, the sparsity is increased because of inhibition and the spectrum of odor coding is expanded through enhancement. Together, these modulation effects serve to increase the robustness of pattern detection as a mechanism of perception. This model also implies that “silent” receptors (R7 and R8 in this case) might be as important as the activated ones in pattern recognition of an olfactory object.

References

    1. Buck L, Axel R, A novel multigene family may encode odorant receptors: A molecular basis for odor recognition. Cell 65, 175–187 (1991). doi: 10.1016/0092-8674(91)90418-X; pmid: 1840504 - DOI - PubMed
    1. Zhang X, Firestein S, The olfactory receptor gene superfamily of the mouse. Nat. Neurosci 5, 124–133 (2002). doi: 10.1038/nn800; pmid: 11802173 - DOI - PubMed
    1. Godfrey PA, Malnic B, Buck LB, The mouse olfactory receptor gene family. Proc. Natl. Acad. Sci. U.S.A 101, 2156–2161 (2004). doi: 10.1073/pnas.0308051100; pmid: 14769939 - DOI - PMC - PubMed
    1. Malnic B, Godfrey PA, Buck LB, The human olfactory receptor gene family. Proc. Natl. Acad. Sci. U.S.A 101, 2584–2589 (2004). doi: 10.1073/pnas.0307882100; pmid: 14983052 - DOI - PMC - PubMed
    1. Niimura Y, Matsui A, Touhara K, Extreme expansion of the olfactory receptor gene repertoire in African elephants and evolutionary dynamics of orthologous gene groups in 13 placental mammals. Genome Res. 24, 1485–1496 (2014). doi: 10.1101/gr.169532.113; pmid: 25053675 - DOI - PMC - PubMed

Publication types