. 2020 Apr 10;368(6487):181-186.
doi: 10.1126/science.aba0210.

Intravital imaging of mouse embryos

Affiliations

Intravital imaging of mouse embryos

Qiang Huang et al. Science. .

Abstract

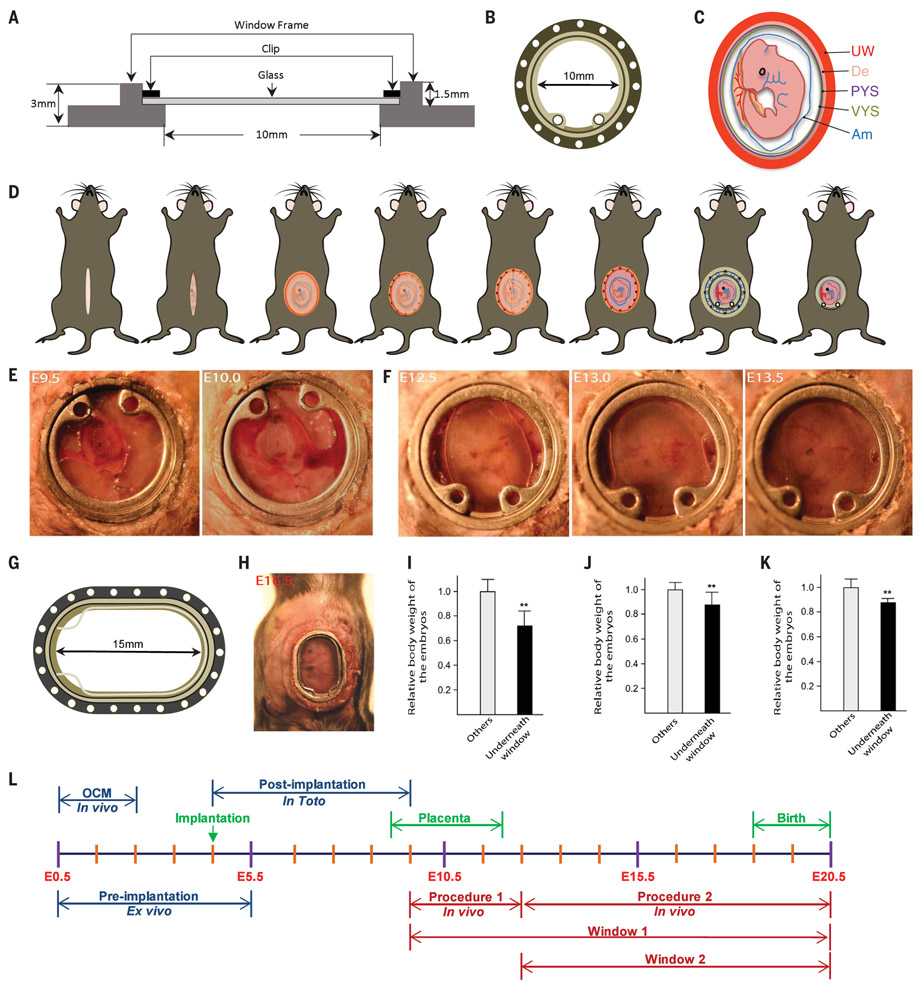
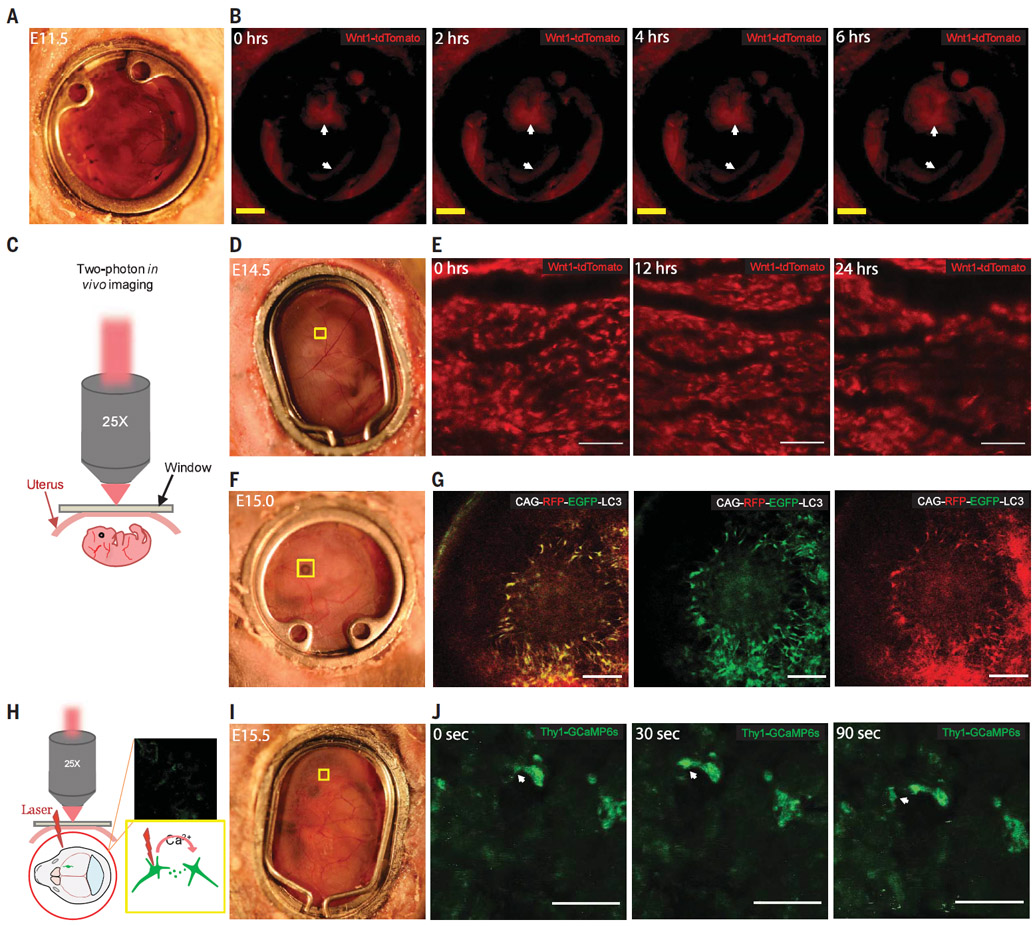
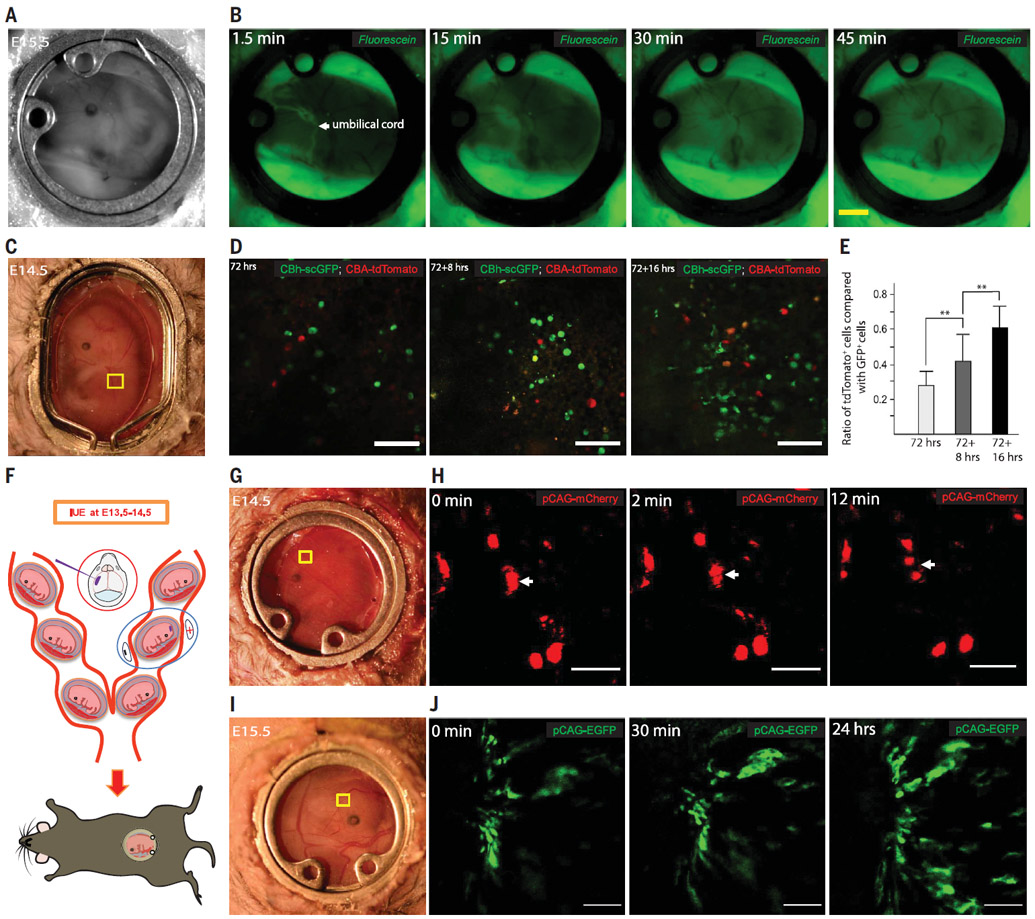
Embryonic development is a complex process that is unamenable to direct observation. In this study, we implanted a window to the mouse uterus to visualize the developing embryo from embryonic day 9.5 to birth. This removable intravital window allowed manipulation and high-resolution imaging. In live mouse embryos, we observed transient neurotransmission and early vascularization of neural crest cell (NCC)-derived perivascular cells in the brain, autophagy in the retina, viral gene delivery, and chemical diffusion through the placenta. We combined the imaging window with in utero electroporation to label and track cell division and movement within embryos and observed that clusters of mouse NCC-derived cells expanded in interspecies chimeras, whereas adjacent human donor NCC-derived cells shrank. This technique can be combined with various tissue manipulation and microscopy methods to study the processes of development at unprecedented spatiotemporal resolution.


Figures

Fig. 1.
Fig. 1.. Intravital imaging of mouse embryos.
(A and B) Schematic illustration of (A) side view and (B) top view of the embryonic window. (C) Illustration of a mouse embryo at E9.5. UW, uterine muscle; De, decidua; PYS, parietal yolk sac; VYS, visceral yolk sac; Am, amnion. (D) Overview of the stripping surgical protocol. (E) Embryo growth from E9.5 to E10.0. (F) Embryo growth from E12.5 to E13.5. (G and H) An elliptical window used for imaging later stages. (G) Schematic illustration of the elliptical window. (H) View of the elliptical window at E16.5. (I to K) Embryo weights at (I) E14.5, 3 days after stripping surgery; (J) E15.5; and (K) E18.5, 3 days after nonstripping surgery. Data are mean ± SD; n = 3 dams, **P < 0.01. (L) Timeline of embryo development and imaging procedures.
Fig. 2.
Fig. 2.. Tracking live embryo development in transgenic mice.
(A and B) Light-field view and 6-hour continuous fluorescence imaging, respectively, of a Wnt1-cre:tdTomato E11.5 mouse embryo. Neurons in the midbrain are labeled with tdTomato, as indicated with the arrows. Scale bar, 2 mm. (C) Schematic of in vivo two-photon microscopy. (D and E) Light-field view and 24-hour imaging of the marked brain region, respectively, of an E14.5 Wnt1-cre:tdTomato mouse embryo. Scale bar, 100 μm. (F and G) Light-field view and fluorescent imaging, respectively, of the marked eye region of a CAG-RFP-EGFP-LC3 mouse embryo (RFP, right; eGFP, middle; overlay, left). Scale bar, 100 μm. (H) Schematic illustration of the imaging setup. (I and J) Light field view and GCaMP6s signal, respectively, in the marked brain region in a Thy1-GCaMP6s embryo at E15.5. White arrows indicate neurotransmission. Scale bar, 25 μm.
Fig. 3.
Fig. 3.. Imaging chemical diffusion, embryonic AAV transduction, and cell movements after in utero electroporation.
(A) View of an embryo at E15.5. (B) Diffusion of fluorescein into an embryo after dam retro-orbital injection. Scale bar 2 mm (C) Light-field view of an E14.5 embryo, 72 hours after AAV8g9-pTR-CBh-scGFP and AAV8g9-pTR-CBA-tdTomato co-injection. (D) GFP and tdTomato expression in the marked region in (C). Scale bar, 100 μm. (E) Ratio of tdTomato+ and GFP+ cells. Data are mean ± SD; n = 3 dams, **P < 0.01. (F) Schematic of in utero electroporation. (G) Light-field view of an E14.5 embryo, 1 day after electroporation of pCAG-mCherry. (H) Movement of cells in the region marked in (G). Scale bar, 50 μm. (I) Light-field view of an E15.5 embryo, 1 day after electroporation of pCAG-EGFP. (J) Twenty four–hour imaging of the brain region marked in (I) showing cell migration. Scale bar, 100 μm.
Fig. 4.
Fig. 4.. Imaging chimeric embryos.
(A) Schematic of imaging a chimeric embryo grown from blastocysts microinjected with labeled mESCs. (B) A blastocyst chimeric embryo, injected with GFP+ cells, at E14.5 and E15.5. Scale bar, 2 mm. (C) Imaging from E14.5 to E15.5 (24 hours) of the region marked in (B). Scale bar, 100 μm. (D) Chimeric embryo are co-injected with PSC-derived hNCCs (GFP+) and mNCCs (tdTlomato+) at E8.5 and imaged at E14.5. (E to H) Position of hNCC (eGFP) and mNCC (tdTomato) in an E14.5 embryo, 6 days after injection. (E) Bright field. (F) Overlay. (G) tdTomato. (H) eGFP. Scale bar, 2 mm. (I) Twenty four–hour imaging of the area marked in (E) to (H). Scale bar, 100 μm.

Comment in

  • Watching embryos develop.
    Vogt N. Vogt N. Nat Methods. 2020 Jun;17(6):560. doi: 10.1038/s41592-020-0864-2. Nat Methods. 2020. PMID: 32499621 No abstract available.

References

    1. Hadjantonakis AK, Dickinson ME, Fraser SE, Papaioannou VE, Nat. Rev. Genet 4, 613–625 (2003). - PubMed
    1. Di Cristofano A, Pesce B, Cordon-Cardo C, Pandolfi PP, Nat. Genet 19, 348–355 (1998). - PubMed
    1. Gregg CL, Butcher JT, Differentiation 84, 149–162 (2012). - PMC - PubMed
    1. Pantazis P, Supatto W, Nat. Rev. Mol. Cell Biol 15, 327–339 (2014). - PubMed
    1. McDole K et al., Cell 175, 859–876.e33 (2018). - PubMed

Publication types

MeSH terms