. 2020 Apr 9;10(1):6147.
doi: 10.1038/s41598-020-63169-3.

Differential Role for a Defined Lateral Horn Neuron Subset in Naïve Odor Valence in Drosophila

Affiliations

Differential Role for a Defined Lateral Horn Neuron Subset in Naïve Odor Valence in Drosophila

Hadas Lerner et al. Sci Rep. .

Abstract

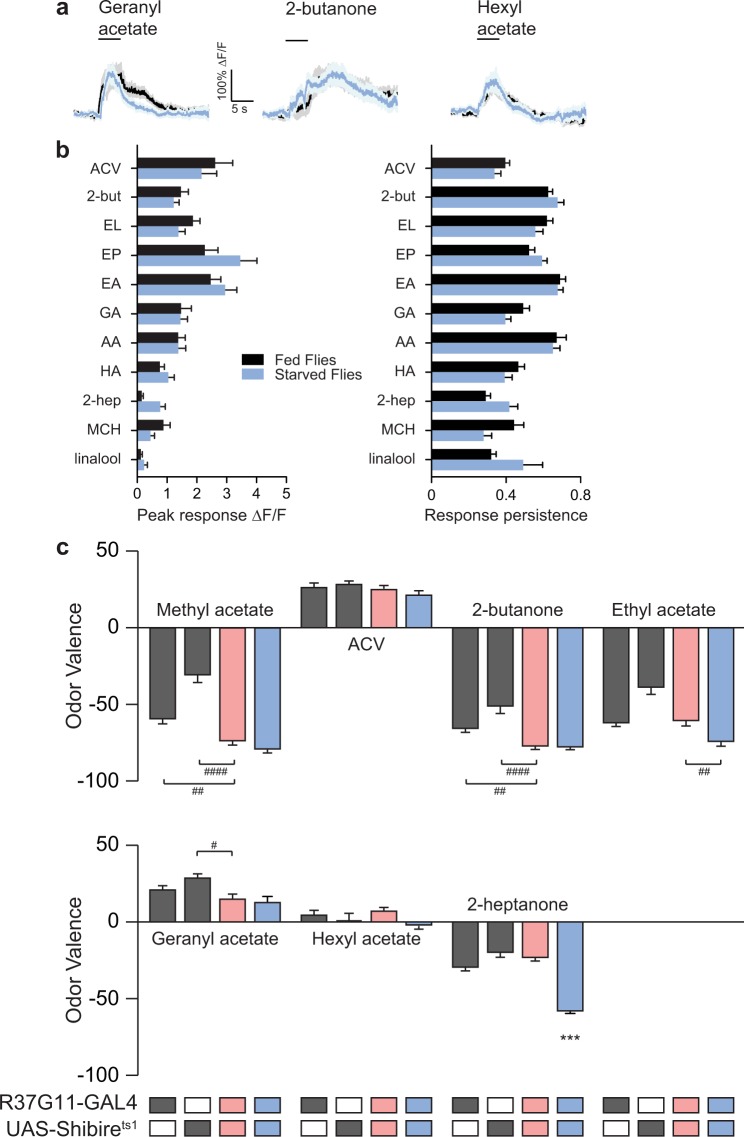
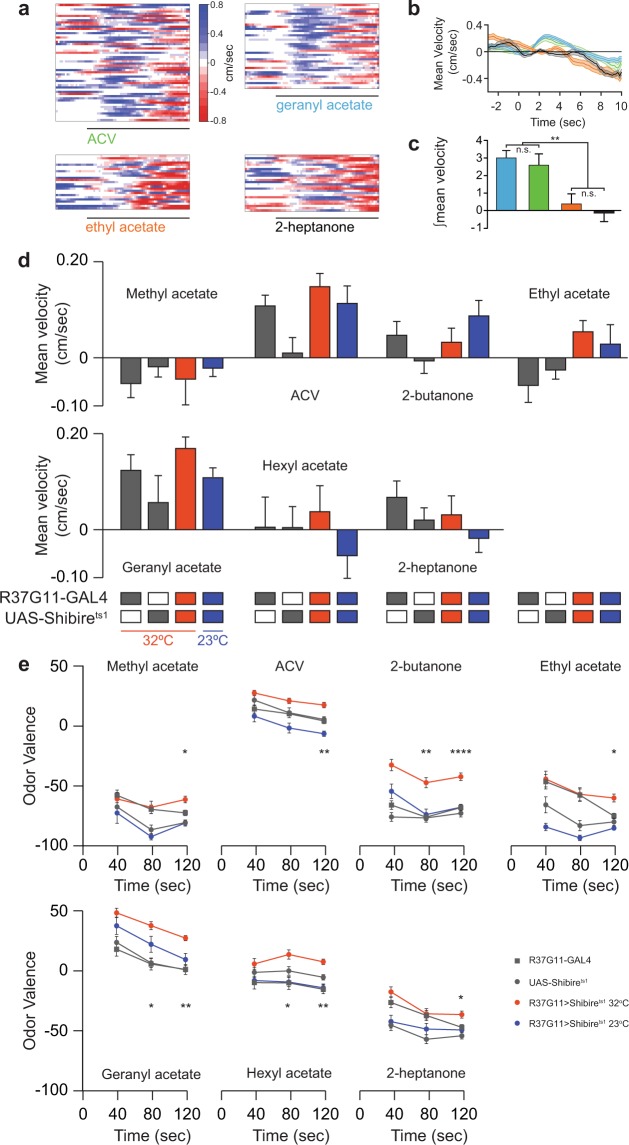
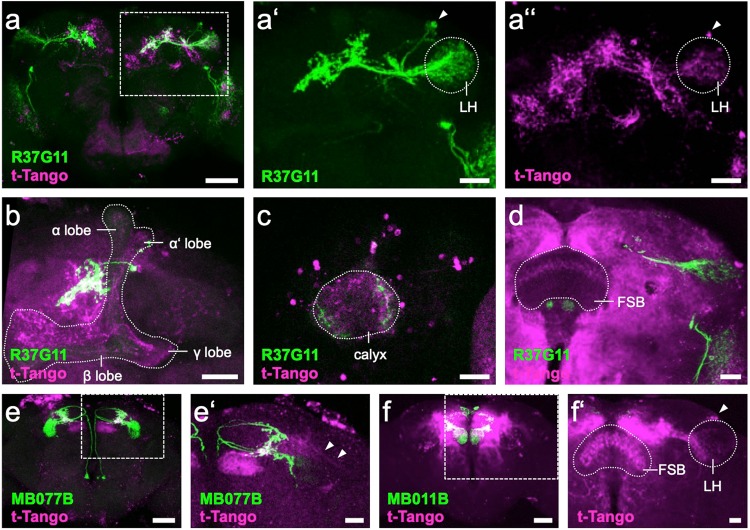
Value coding of external stimuli in general, and odor valence in particular, is crucial for survival. In flies, odor valence is thought to be coded by two types of neurons: mushroom body output neurons (MBONs) and lateral horn (LH) neurons. MBONs are classified as neurons that promote either attraction or aversion, but not both, and they are dynamically activated by upstream neurons. This dynamic activation updates the valence values. In contrast, LH neurons receive scaled, but non-dynamic, input from their upstream neurons. It remains unclear how such a non-dynamic system generates differential valence values. Recently, PD2a1/b1 LH neurons were demonstrated to promote approach behavior at low odor concentration in starved flies. Here, we demonstrate that at high odor concentrations, these same neurons contribute to avoidance in satiated flies. The contribution of PD2a1/b1 LH neurons to aversion is context dependent. It is diminished in starved flies, although PD2a1/b1 neural activity remains unchanged, and at lower odor concentration. In addition, PD2a1/b1 aversive effect develops over time. Thus, our results indicate that, even though PD2a1/b1 LH neurons transmit hard-wired output, their effect on valence can change. Taken together, we suggest that the valence model described for MBONs does not hold for LH neurons.


Conflict of interest statement

The authors declare no competing interests.

Figures

Figure 1
Figure 1
PD2a1/b1 neurons display variable odor responses to high odor concentrations. (a) Representative single odor response traces obtained from the same neuron. Different odor response dynamics and amplitudes were observed. Odor pulse is highlighted in red. (b) Representative activity maps demonstrating variable population odor responses in the same fly to 2-butanone and ethyl benzoate. Pre-odor pulse and during odor pulse activity maps are depicted. (c,g) Peak ∆F/F responses during odor response for GCaMP6f-labelled cells driven by drivers R37G11-GAL4 (c) and R48F03-GAL4 (g), respectively. (55 ≥ n ≥ 20 and 46 ≥ n ≥ 14 cells, respectively. At least 5 different flies were imaged from each genotype.) (d,h) Percentage of responding neurons obtained from all neurons from all flies pooled for cells labeled by R37G11-GAL4 (d) and R48F03-GAL4 (h). (55 ≥ n ≥ 20 and 46 ≥ n ≥ 14 cells, respectively. At least 5 different flies were imaged from each genotype.) (e,i) Response persistence for R37G11-GAL4 (e) and R48F03-GAL4 (i). Response persistence was measured as the inverse of the ratio between the maximal peak of the odor response and the average response 5 seconds after the maximal peak time. (55 ≥ n ≥ 20 and 46 ≥ n ≥ 14 cells, respectively. At least 5 different flies from each genotype were imaged.) (f,j) Heatmaps of normalized selected parameters: peak response, number of responding cells, area under the curve, time to peak, and response persistence for R37G11-GAL4 and R48F03-GAL4, respectively. To compare different odors across several parameters, we normalized the results by calculating a Z-score for each odor value. The calculated Z-scores were further divided by the maximal Z-score for each parameter to yield a maximum value of 1. In general, a high correlation was observed between the different parameters. (k–m) Correlation between the parameters obtained for R37G11-GAL4 and R48F03-GAL4 for peak ∆F/F (k), the percentage of responding neurons (l) and the response persistence (m). (See Supplementary Table S1 for statistical analysis).
Figure 2
Figure 2
PD2a1/b1 neurons exhibit correlated population activity. (a) Odor responses from four PD2a1/b1 cell bodies in the same fly to three odors as indicated. A high correlation between the temporal pattern of the responses was observed. (b) Odor responses from one PD2a1/b1 neuron to seven odors. The temporal dynamics of the responses are not correlated. (c) Left, an example of the correlation values of six PD2a1/b1 neurons in the same fly obtained for the seven odors on the right. Right, an example of the correlation values of seven odors obtained for the six neurons on the left. (d) Within-fly mean correlation values for both driver lines (R37G11-GAL4 and R48F03-GAL4) for neurons and odors. High correlation values were obtained for the neurons and low correlation values for the odors (n = 26 flies and n = 9 flies, respectively). (e) Left, an example of the correlation values for a single odor obtained for all PD2a1/b1 neurons from all flies. Right, an example of the correlation values when the neuronal responses were shuffled (see Methods). (f) Left, between-flies mean correlation values for both driver lines (R37G11-GAL4, and R48F03-GAL4, n = 26 flies; the number of neurons ranged from 20 to 55 and n = 9 flies; the number of neurons ranged from 14 to 46, respectively). Right, Between-flies correlation for shuffled neurons and for artificial neurons (see Methods).
Figure 3
Figure 3
PD2a1/b1 neurons contribute to aversive responses to high odor concentrations. (a) An example of traces obtained for naïve flies for 2-butanone. Gray, parental control groups; red, the experimental group at 32 °C; blue, the experimental control group at 23 °C. Naïve response to an odor (gray) was tested against mineral oil (white). (b) Mean valence scores (see Methods) from experiments as in a, for the designated odors. Odors are arranged according to their response profile as in Fig. 2 and Supplementary Fig. S2. A consistent shift towards more positive valence values was observed during PD2a1/b1 inhibition for all odors that activate PD2a1/b1 neurons, except for ethyl lactate. No effect during PD2a1/b1 inhibition was observed for odors that only weakly activate PD2a1/b1 neurons. (137 ≥ n ≥ 21 flies for all conditions, * indicates a significant difference of the indicated group from all other groups according to a multiple comparison test. The lowest value of all multiple comparison tests is presented. # indicates a significant difference only between the two indicated groups. *, #p < 0.05, **, ##p < 0.01, ###p < 0.0005, ****p < 0.0001, see Supplementary Table S1 for statistical analysis).
Figure 4
Figure 4
PD2a1/b1 neurons do not contribute to aversive responses at low odor concentrations. (a) Average traces obtained from PD2a1/b1 axonal projections in response to increased concentrations of the designated odors. For 2-butanone and ethyl acetate, a change in the temporal dynamics of the odor response was observed at high odor concentrations. (17 ≥ n ≥ 6 flies for all odors). (b) Peak response analysis of the data presented in a. Except for ACV and 2-heptanone, saturation in odor response was observed at 1×10⁻² odor concentration (see Supplementary Table S1 for statistical analysis). (c) Mean valence scores (see Methods), for the designated odors (results for an odor concentration of 1×10⁻² as obtained from Fig. 2 and are presented for comparison). In general (except for 10−3 ACV) no effect of PD2a1/b1 neurons was observed at low odor concentrations (137 ≥ n ≥ 21 flies for all conditions, *p < 0.05, **p < 0.01, ****p < 0.0001, see Supplementary Table S1 for statistical analysis). (d) Absolute value of the magnitude of the valence change as a function of the mean peak response. Valence change was calculated as the smallest difference from the control groups (parental and temperature). No significant correlation was found (R = 0.228, p-value = 0.3617).
Figure 5
Figure 5
Starvation abolishes the effect of PD2a1/b1 neurons on behavioral output without changing their odor responses. (a) Averaged traces of odor responses for fed (black) and starved (light blue) flies; no effect of starvation was observed. (b) Analysis of peak odor responses and response persistence for the designated odors in fed and starved flies. No statistical difference was observed (49 ≥ n ≥ 18 cells, from at least 5 different flies; see Supplementary Table S1 for statistical analysis). (c) Mean valence scores of starved flies for the designated odor. Gray, parental controls; light red, the experimental group at 32 °C; blue, the experimental control group at 23 °C. Starvation abolished the effect of silencing PD2a1/b1 neurons. (87 ≥ n ≥ 47 flies, *indicates a significant difference of the indicated group from all other groups according to a multiple comparison test. The lowest value of all multiple comparison tests is presented. #indicates a significant difference only between the two indicated groups. #p < 0.05, ##p < 0.01, ***p < 0.0005, ####p < 0.0001, see Supplementary Table S1 for statistical analysis.).
Figure 6
Figure 6
The effect of PD2a1/b1 neurons on odor valence develops with time. (a) Heat maps of the initial walking velocity of single flies at the onset of the odor pulse, 3 seconds prior to the odor pulse, and 10 seconds following the odor pulse (black line). A positive velocity indicates movement towards the odor pulse. For the attractive odors (ACV and geranyl acetate), a clear positive velocity was observed for most flies. (b) Mean velocity of the heat maps presented in a. A clear movement towards the odor source was observed for the attractive odors. Odors are according to the color coding in panel a. (c) Analysis of the integral of the response for the flies presented in a for the first 3 seconds following odor onset. Odors are according to the color coding in panel a (** p < 0.01, see Supplementary Table S1 for statistical analysis). (d) Mean velocity scores during the first 3 seconds following odor onset for the designated odor. Gray, parental controls; red, the experimental group at 32 °C; blue, the experimental control group at 23 °C. No significant difference was observed (53 ≥ n ≥ 18 flies). (e) Mean valence scores (see Methods) obtained over time for the designated odors. Gray, parental controls; red, the experimental group at 32 °C; blue, the experimental control group at 23 °C. PD2a1/b1 neurons contribution to odor valence develops with time. Values at 120 seconds were similar to those presented in Fig. 2 (155 ≥ n ≥ 17 flies for all conditions, *p < 0.05, **p < 0.01, ****p < 0.0001, see Supplementary Table S1 for statistical analysis.).
Figure 7
Figure 7
trans-Tango downstream targets of PD2a1/b1, MBON- 𝛾2α’1 and MBON- β’2mp neurons. (a) R37G11-GAL4-driven myrGFP (green) labels 6-7 cells in the LH, whereas the trans-Tango signal (magenta) appears to be strongest in overlapping neuropil regions and in random sparse KC subsets in the MB (boxed area enlarged in a’ and a”). (a’) R37G11-GAL4-driven myrGFP (green) labels 6-7 cells (arrowhead) in the LH (stippled). (a”) R37G11-GAL4-driven trans-Tango signal (magenta) marks cells (arrowhead) in the LH (stippled). (b) Confocal stack of MB (stippled), highlighting the PD2a1/b1 neurites in proximity to the vertical lobe and a trans-Tango signal in all sublobes, i.e., αβ, αβ’, and 𝛾. (c) Confocal stack of MB calyx (stippled) showing innervation by R37G11-GAL4-driven GFP (green) and trans-Tango signal in both KC somata and the calyx neuropil. (d) Confocal stack of left hemibrain highlighting R37G11-GAL4-driven myrGFP (green) and postsynaptic trans-Tango signal in layer 6 of the FSB (stippled). (e) MB077B-GAL4-driven myrGFP (green) labels 3-4 MBON-𝛾2α’1 neurons, whereas a fairly restricted putative downstream trans-Tango signal (magenta) most prominently labels MBON- β’2mp (boxed area enlarged in e’). (e’) Confocal stack of left hemibrain highlighting MB077B-GAL4-driven mCD8::GFP (green) and postsynaptic trans-Tango signal (magenta) in β’2mp of the MB and in putative LHON neurites (arrowheads). (f) MB011B-GAL4-driven myrGFP (green) labels MBON- 𝛾5β2α and MBON- β’2mp, whereas the putative downstream trans-Tango signal (magenta) labels several different cell types (boxed area enlarged in f’). (f’) Confocal stack of right hemisphere highlighting the postsynaptic signal of MBON- β’2mp in PD2 LHONs (arrowhead) in the LH (stippled) and in layer 4 & 5 of the FSB (stippled). (a–f’): Confocal stack views of 1-2 µm-thick optical section data. Scale bars: a,e,f: 50 µm; a’,a”,b-d,e’,f’: 20 µm.

References

    1. Touhara K, Vosshall LB. Sensing Odorants and Pheromones with Chemosensory Receptors. Annu. Rev. Physiol. 2009;71:307–332. doi: 10.1146/annurev.physiol.010908.163209. - DOI - PubMed
    1. Li Q, Liberles SD. Aversion and Attraction through Olfaction. Curr. Biol. 2015;25:R120–R129. doi: 10.1016/j.cub.2014.11.044. - DOI - PMC - PubMed
    1. Buck L, Axel R. A novel multigene family may encode odorant receptors: A molecular basis for odor recognition. Cell. 1991;65:175–187. doi: 10.1016/0092-8674(91)90418-X. - DOI - PubMed
    1. Vosshall LB, Amrein H, Morozov PS, Rzhetsky A, Axel R. A Spatial Map of Olfactory Receptor Expression in the Drosophila Antenna. Cell. 1999;96:725–736. doi: 10.1016/S0092-8674(00)80582-6. - DOI - PubMed
    1. Hallem EA, Carlson JR. The odor coding system of Drosophila. Trends Genet. 2004;20:453–459. doi: 10.1016/j.tig.2004.06.015. - DOI - PubMed

Publication types

LinkOut - more resources