. 2020 Mar 26:11:221.
doi: 10.3389/fgene.2020.00221. eCollection 2020.

Computing Skin Cutaneous Melanoma Outcome From the HLA-Alleles and Clinical Characteristics

Affiliations

Computing Skin Cutaneous Melanoma Outcome From the HLA-Alleles and Clinical Characteristics

Anjali Dhall et al. Front Genet. .

Abstract

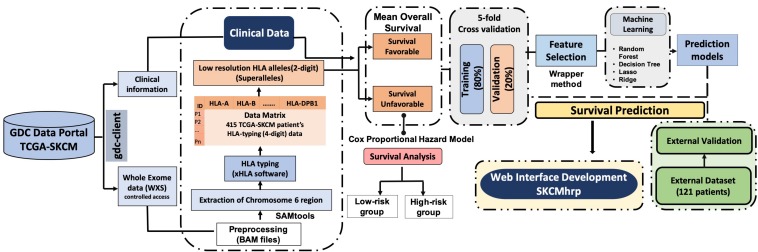
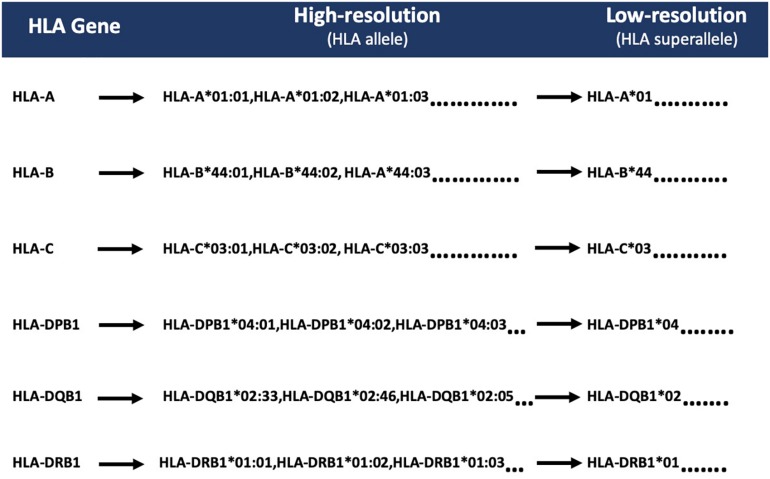
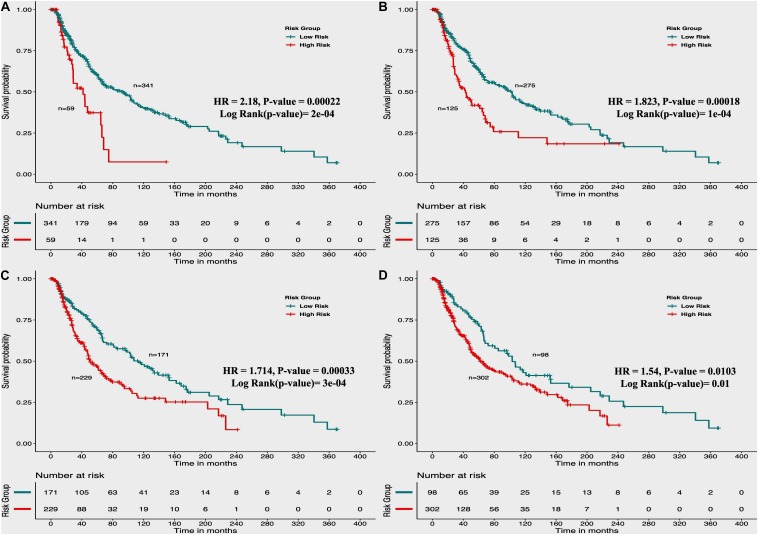
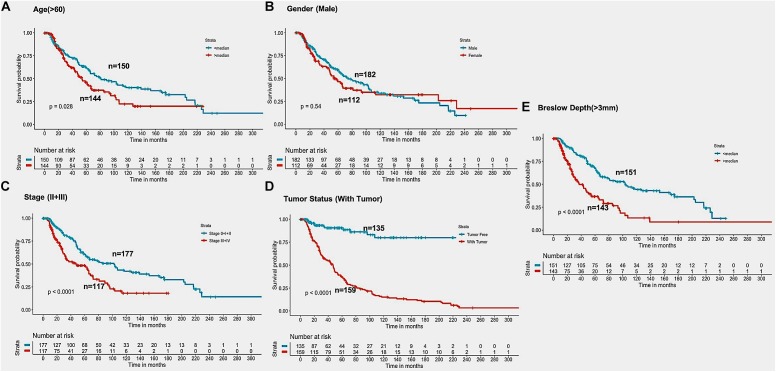
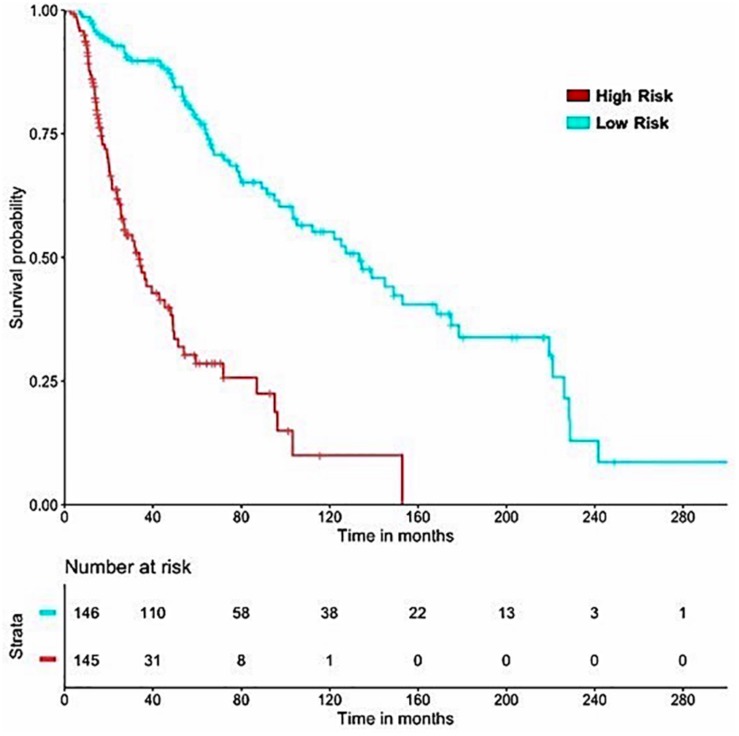
Human leukocyte antigen (HLA) are essential components of the immune system that stimulate immune cells to provide protection and defense against cancer. Thousands of HLA alleles have been reported in the literature, but only a specific set of HLA alleles are present in an individual. The capability of the immune system to recognize cancer-associated mutations depends on the presence of a particular set of alleles, which elicit an immune response to fight against cancer. Therefore, the occurrence of specific HLA alleles affects the survival outcome of cancer patients. In the current study, prediction models were developed, using 401 cutaneous melanoma patients, to predict the overall survival (OS) of patients using their clinical data and HLA alleles. We observed that the presence of certain favorable superalleles like HLA-B55 (HR = 0.15, 95% CI 0.034-0.67), HLA-A01 (HR = 0.5, 95% CI 0.3-0.8), is responsible for the improved OS. In contrast, the presence of certain unfavorable superalleles such as HLA-B50 (HR = 2.76, 95% CI 1.284-5.941), HLA-DRB112 (HR = 3.44, 95% CI 1.64-7.2) is responsible for the poor survival. We developed prediction models using key 14 HLA superalleles, demographic, and clinical characteristics for predicting high-risk cutaneous melanoma patients and achieved HR = 4.52 (95% CI 3.088-6.609, p-value = 8.01E-15). Eventually, we also provide a web-based service to the community for predicting the risk status in cutaneous melanoma patients (https://webs.iiitd.edu.in/raghava/skcmhrp/).

Keywords: HLA; Hazard ratio; cutaneous melanoma; machine learning; prognosis; regression; superalleles; survival analysis.


Figures

FIGURE 1
FIGURE 1
Pipeline representing the workflow of the study.
FIGURE 2
FIGURE 2
Representation of HLA superalleles on the basis of common HLA gene (-A, -B, -C, -DPB1, -DQB1, -DRB1) and field1 (F1).
FIGURE 3
FIGURE 3
Kaplan Meier (KM) survival curves for the risk estimation of melanoma patient cohort based on the risk score with significant p-value (A) Melanoma samples stratified on the basis of cut-off (≥2 Risk Score), (B) Stratified samples by taking cut-off (≥1 Risk Score), (C) Stratified samples by taking cut-off (≥0 Risk Score), (D) Stratified samples by taking cut-off (≥–1 Risk Score).
FIGURE 4
FIGURE 4
Kaplan Meier survival curves for risk estimation of SKCM cohort, show a significant difference in the high-risk/low-risk groups. (A) Patients with age (>60 years) are stratified into high/low risk with HR = 1.45, 95%CI = 1.039–2.024 and p-value = 0.028, (B) Stratification of low-risk and high-risk groups on the basis of gender with HR = 1.11, 95%CI = 0.7901–1.52, and p-value = 0.545, (C) Stage (III + IV) patients are on high risk as compared to Stage (0 + I + II) patients with HR = 1.94, 95%CI = 1.386-2.722, p-value < 0.001, (D) Patients with Tumor status (With Tumor) were stratified on high/low-risk with HR = 8.29, 95%CI = 4.688–14.67, and p-value < 0.001, (E) Patients having Breslow depth > 3 mm are stratified into high/low-risk corresponding 95%CI 1.788–3.509, HR = 2.5, and p-value < 0.001.
FIGURE 5
FIGURE 5
SKCM-patients were stratified based on predicted OS by using Lasso recursive regression model after applying fivefold cross validation. Samples with predicted OS < median (predicted OS) were at fourfold higher risk as compared to the patients predicted OS > median (predicted OS) (HR = 4.52, 95% CI = 3.088 to 6.609, p-value = 8.01E-15).

References

    1. Akiyama Y., Tanosaki R., Inoue N., Shimada M., Hotate Y., Yamamoto A., et al. (2005). Clinical response in Japanese metastatic melanoma patients treated with peptide cocktail-pulsed dendritic cells. J. Transl. Med. 3:4. 10.1186/1479-5876-3-4 - DOI - PMC - PubMed
    1. Aptsiauri N., Cabrera T., Mendez R., Garcia-Lora A., Ruiz-Cabello F., Garrido F. (2007). Role of altered expression of HLA class I molecules in cancer progression. Adv. Exp. Med. Biol. 601 123–131. 10.1007/978-0-387-72005-0-13 - DOI - PubMed
    1. Balch C. M., Gershenwald J. E., Soong S. J., Thompson J. F., Atkins M. B., Byrd D. R., et al. (2009). Final version of 2009 AJCC melanoma staging and classification. J. Clin. Oncol. 27 6199–6206. 10.1200/JCO.2009.23.4799 - DOI - PMC - PubMed
    1. Beck S., Trowsdale J. (2000). The human major histocompatability complex: lessons from the DNA sequence. Annu. Rev. Genomics Hum. Genet. 1 117–137. 10.1146/annurev.genom.1.1.117 - DOI - PubMed
    1. Bevan M. J. (2006). Cross-priming. Nat. Immunol. 7 363–365. 10.1038/ni0406-363 - DOI - PubMed