. 2020 Feb 20;7(7):1902576.
doi: 10.1002/advs.201902576. eCollection 2020 Apr.

Highly Efficient 2D NIR-II Photothermal Agent with Fenton Catalytic Activity for Cancer Synergistic Photothermal-Chemodynamic Therapy

Affiliations

Highly Efficient 2D NIR-II Photothermal Agent with Fenton Catalytic Activity for Cancer Synergistic Photothermal-Chemodynamic Therapy

Qiuhong Zhang et al. Adv Sci (Weinh). .

Abstract

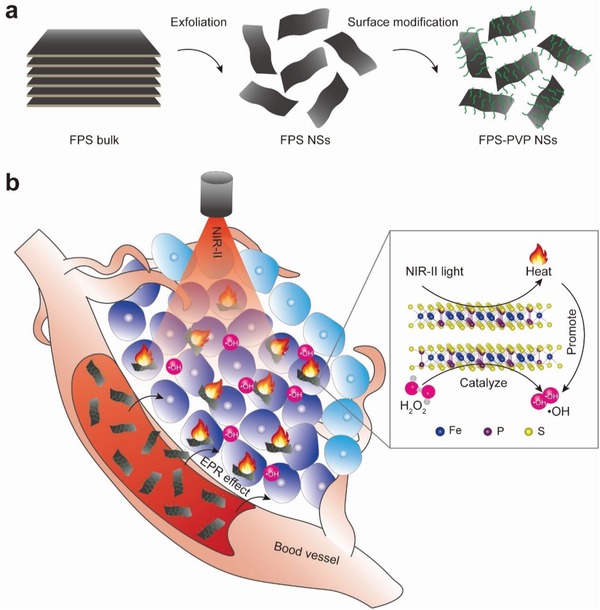
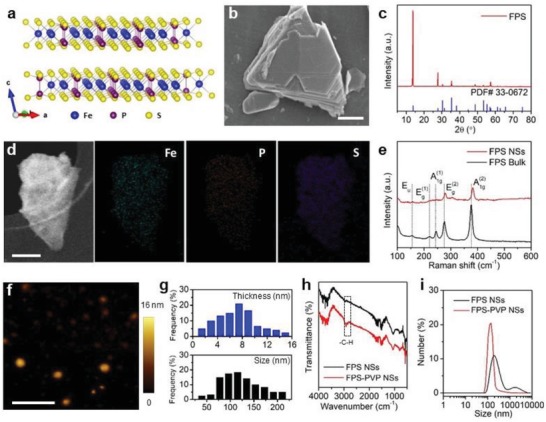
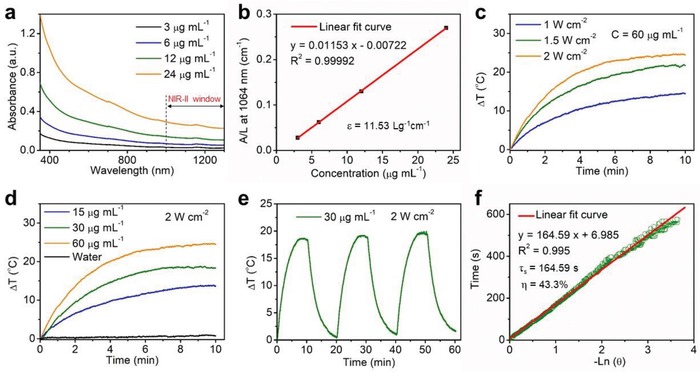
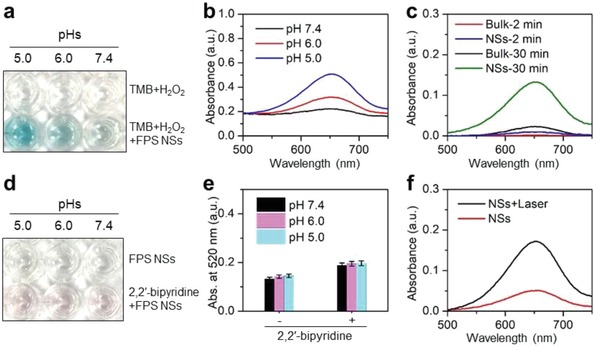
Photothermal therapy (PTT) has emerged as a promising cancer therapeutic modality with high therapeutic specificity, however, its therapeutic effectiveness is limited by available high-efficiency photothermal agents (PTAs), especially in the second near-infrared (NIR-II) biowindow. Here, based on facile liquid-exfoliated FePS3 nanosheets, a highly efficient NIR-II PTA with its photothermal conversion efficiency of up to 43.3% is demonstrated, which is among the highest reported levels in typical PTAs. More importantly, such Fe-based 2D nanosheets also show superior Fenton catalytic activity facilitated by their ultrahigh specific surface area, simultaneously enabling cancer chemodynamic therapy (CDT). Impressively, the efficiency of CDT could be further remarkably enhanced by its photothermal effect, leading to cancer synergistic PTT/CDT. Both in vitro and in vivo studies reveal a highly efficient tumor ablation under NIR-II light irradiation. This work provides a paradigm for cancer CDT and PTT in the NIR-II biowindow via a single 2D nanoplatform with desired therapeutic effect. Furthermore, with additional possibilities for magnetic resonance imaging, photoacoustic tomography, as well as drug loading, this Fe-based 2D material could potentially serve as a 2D "all-in-one" theranostic nanoplatform.

Keywords: FePS3 nanosheets; Fenton agent; NIR‐II biowindow; photothermal agents; reactive oxygen species.


Conflict of interest statement

The authors declare no conflict of interest.

Figures

Figure 1
Figure 1
a) Scheme of synthetic process of FPS‐PVP NSs. b) Schematic illustration of cancer synergistic CDT and PTT in NIR‐II biowindow enabled by FPS‐PVP NSs. Inset is the ball‐and‐stick model of FPS.
Figure 2
Figure 2
Characterizations of FPS. a) Schematic diagram of layered FPS based on a ball‐and‐stick model. b) SEM image of FPS bulk. Scale bar is 2 µm. c) X‐ray diffraction pattern of FPS bulk. d) STEM image and corresponding EDS mapping images of FPS NSs. Scale bar is 50 nm. e) Raman spectra of FPS bulk and NSs. f) Atomic force microscopy image of FPS NSs. Scale bar is 500 nm. g) Statistical analysis of the thickness and lateral size of FPS NSs from atomic force microscopy images. h) Fourier transform infrared spectra of FPS NSs and FPS‐PVP NSs. i) Hydrodynamic sizes of FPS NSs and FPS‐PVP NSs dispersed in water.
Figure 3
Figure 3
In vitro photothermal performance. a) Vis–NIR absorbance spectra of FPS‐PVP NSs at different Fe concentrations (3, 6, 12, and 24 µg mL−1). b) Normalized extinction intensity divided by the length of the cell (A/L) at different concentrations for λ = 1064 nm. c) The heating curves of FPS‐PVP NSs under irradiation of 1064 nm laser at varied power intensities (1, 1.5, and 2 W cm−2). d) The heating curves of FPS‐PVP NSs at different Fe concentrations (15, 30, and 60 µg mL−1) under irradiation of 1064 nm laser (2 W cm−2). e) The heating and cooling curves of FPS‐PVP NSs for three laser on/off cycles. f) Plot of cooling time versus the negative natural logarithm of the temperature driving force obtained from the cooling stage shown in (e) for evaluating PTCE.
Figure 4
Figure 4
In vitro ROS generation. a) Catalytic oxidation of TMB by FPS‐PVP NSs at different pH values. b) Vis–NIR absorbance spectra of oxidized TMB. c) Vis–NIR absorbance spectra of oxidized TMB for FPS‐PVP NSs and their bulk counterpart. d) Detection of ferrous ions released from FPS‐PVP NSs. e) Absorbance at 520 nm of the FPS‐PVP NSs and 2,2′‐bipyridine mixtures. f) Vis–NIR absorbance spectra of oxidized TMB for FPS‐PVP NSs with/without NIR‐II laser irradiation.
Figure 5
Figure 5
Cell uptake, intracellular ROS generation, and cancer cell inhibition. a) Cell uptake and b) cell viability of HeLa cells co‐incubated with FPS‐PVP NSs at varied Fe concentrations (6, 12, 24, and 48 µg mL−1) under different co‐incubation time (2, 12, 24, and 48 h). c) Cell viability of HeLa cells treated with FPS‐PVP NSs at varied Fe concentrations under irradiation with 1064 nm laser at varied power intensities (0, 0.8, and 1.0 W cm−2). d) Confocal fluorescence images of ROS generation. HeLa cells were co‐incubated with FPS‐PVP NSs for 2 and 12 h (without/with NIR‐II irradiation). The bright field shows the morphology of HeLa cells. Scale bars are 30 µm. *P < 0.05, **P < 0.01, and ***P < 0.001.
Figure 6
Figure 6
In vivo biosafety evaluations. a) Blood biochemistry and b) blood routine examinations of mice after receiving i.v. injection with FPS‐PVP NSs for 1, 30, and 90 days. The units of ALT, AST, and ALP are U L−1; the units of BUN and CREA are mmol L−1 and µmol L−1, respectively; the units of WBC, RBC, HGB, HCT, MCV, MCH, PLT, and MCHC are 109 L−1, 1012 L−1, g L−1, %, fL, pg, g L−1, and 109 L−1, respectively. c) Histological slices obtained from main tissues (heart, liver, spleen, lung, and kidney) of mice after receiving i.v. injection with FPS‐PVP NSs for 90 days. Scale bars are 50 µm. Time‐dependent biodistribution of d) P and e) Fe elements in main tissues and tumor of the FPS‐PVP NSs treated mice.
Figure 7
Figure 7
In vivo cancer therapy. a) Infrared thermal images and b) temperature profiles at the tumor sites of mice after various treatments. c) Tumor growth curves of mice after various treatments for 12 days (n = 5, mean ± standard deviation; *P < 0.05 and ***P < 0.001). d) Body weights and e) survival rate of mice after various treatments for 12 days. f) Photographs of tumor‐bearing mice in different groups taken on the 0th, 3rd, 6th, and 12th day after treatment. g) Micrographs of H&E and Ki‐67 stained tumor slices. Scale bars are 50 µm.

References

    1. Wang Q. H., Kalantar‐Zadeh K., Kis A., Coleman J. N., Strano M. S., Nat. Nanotechnol. 2012, 7, 699. - PubMed
    1. Fiori G., Bonaccorso F., Iannaccone G., Palacios T., Neumaier D., Seabaugh A., Banerjee S. K., Colombo L., Nat. Nanotechnol. 2014, 9, 768. - PubMed
    1. Bonaccorso F., Colombo L., Yu G. H., Stoller M., Tozzini V., Ferrari A. C., Ruoff R. S., Pellegrini V., Science 2015, 347, 1246501. - PubMed
    1. Deng D. H., Novoselov K. S., Fu Q., Zheng N. F., Tian Z. Q., Bao X. H., Nat. Nanotechnol. 2016, 11, 218. - PubMed
    1. Chen Y., Tan C. L., Zhang H., Wang L. Z., Chem. Soc. Rev. 2015, 44, 2681. - PubMed

LinkOut - more resources