Review
. 2020 Feb 13;7(7):1903171.
doi: 10.1002/advs.201903171. eCollection 2020 Apr.

Z-Scheme Photocatalytic Systems for Solar Water Splitting

Affiliations
Review

Z-Scheme Photocatalytic Systems for Solar Water Splitting

Boon-Junn Ng et al. Adv Sci (Weinh). .

Abstract

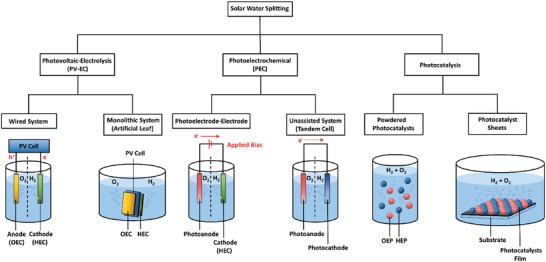
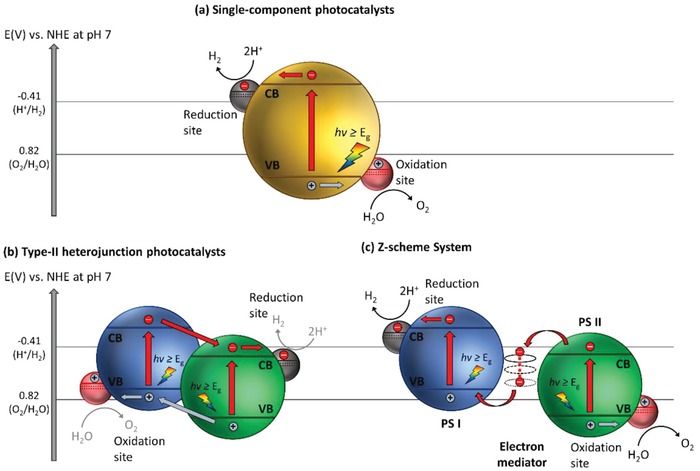
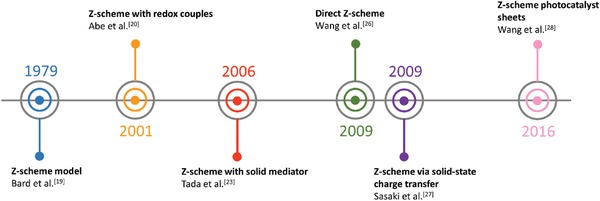
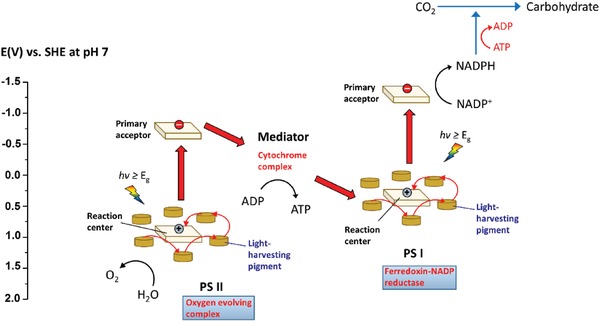
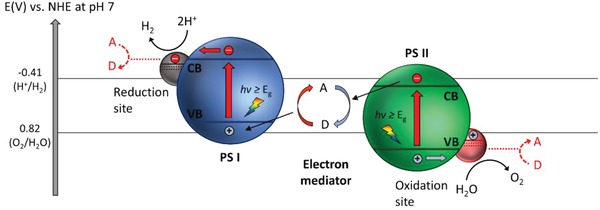
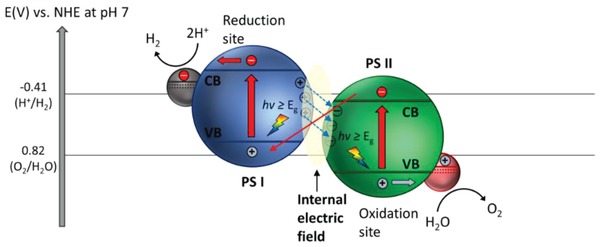
As the world decides on the next giant step for the renewable energy revolution, scientists have begun to reinforce their headlong dives into the exploitation of solar energy. Hitherto, numerous attempts are made to imitate the natural photosynthesis of plants by converting solar energy into chemical fuels which resembles the "Z-scheme" process. A recreation of this system is witnessed in artificial Z-scheme photocatalytic water splitting to generate hydrogen (H2). This work outlines the recent significant implication of the Z-scheme system in photocatalytic water splitting, particularly in the role of electron mediator and the key factors that improve the photocatalytic performance. The Review begins with the fundamental rationales in Z-scheme water splitting, followed by a survey on the development roadmap of three different generations of Z-scheme system: 1) PS-A/D-PS (first generation), 2) PS-C-PS (second generation), and 3) PS-PS (third generation). Focus is also placed on the scaling up of the "leaf-to-tree" challenge of Z-scheme water splitting system, which is also known as Z-scheme photocatalyst sheet. A detailed investigation of the Z-scheme system for achieving H2 evolution from past to present accompanied with in-depth discussion on the key challenges in the area of Z-scheme photocatalytic water splitting are provided.

Keywords: Z‐scheme; artificial photosynthesis; electron mediators; hydrogen; water splitting.


Conflict of interest statement

The authors declare no conflict of interest.

Figures

Figure 1
Figure 1
Schematic illustration of solar water splitting technologies: PV‐EC, PEC, and photocatalysis.
Figure 2
Figure 2
Fundamental photocatalytic water splitting mechanism in particulate system. The potential difference between CB and H+/H2 is abbreviated as ɳ HER while the potential difference between VB and O2/H2O is abbreviated as ɳ OER.
Figure 3
Figure 3
Schematic illustration of a) single component photocatalysts, b) type‐II heterojunction photocatalysts, and c) Z‐scheme photocatalytic system.
Figure 4
Figure 4
Timeline for the evolution in different generation of Z‐scheme.
Figure 5
Figure 5
Graphical representation illustrating two‐step photoexcitation system in natural photosynthesis of green plant.
Figure 6
Figure 6
Schematic band energy diagram of PS‐A/D‐PS Z‐scheme system.
Figure 7
Figure 7
Effect of midgap states as electron donor level. Proposed band structure of Rh‐doped SrTiO3. Adapted with permission.43 Copyright 2004, American Chemical Society.
Figure 8
Figure 8
Degree of rA+B/rA ratio with cutoff wavelength of light. UV–vis DRS of a) WO3, b) CaTaO2N, and c) BaTaO2N. Adapted with permission.35 Copyright 2009, American Chemical Society.
Figure 9
Figure 9
Properties of Fe3+/Fe2+ redox system. a) Adsorption isotherms of Fe3+ and Fe2+ on TiO2 powder. b) Photocatalytic generation of Fe2+ and O2 using Fe3+ as the electron acceptor. The reaction was carried out in 0.05 dm3 of aqueous FeCl3 containing TiO2 powder. Adapted with permission.45 Copyright 1997, American Chemical Society.
Figure 10
Figure 10
Optical properties of Sillén‐Aurivillius class of bismuth oxyhalides. a) UV–vis of Bi4NbO8Cl, Bi4NbO8Br, BiOCl and BiOBr. b) Schematic of band structure for Bi4NbO8Cl and BiOCl. Adapted with permission.49 Copyright 2016, American Chemical Society.
Figure 11
Figure 11
Optical properties of doped TiO2. a) UV–vis DRS of TiO2 and doped TiO2. b) Schematic illustration of band structure for TiO2 doped with different atoms. Adapted with permission.52 Copyright 2017, Royal Society of Chemistry.
Figure 12
Figure 12
Electronic configuration of various doped metal oxide. A) Band structure for Ir and La co‐doped BaTa2O6. B) UV–vis DRS of ATa2O6:Ir,La where A is equal to a) Ca, b) Sr, and c–e) Ba. Samples of (a–c) were prepared via borate‐flux method whereas (d,e) were prepared using NaCl‐flux and SSR methods. Adapted with permission.[qv: 37d] Copyright 2017, Royal Society of Chemistry.
Figure 13
Figure 13
Z‐scheme water splitting of doped metal oxide in [Co(bpy)3]3+/2+ redox system. Mechanism of water splitting reaction containing Ru‐doped BaTa2O6:Ir,La as HEP, BiVO4 as OEP in solution with [Co(bpy)3]SO4 complex under visible light. Adapted with permission.[qv: 37d] Copyright 2017, Royal Society of Chemistry.
Figure 14
Figure 14
Separated gas evolution of H2 and O2 from photocatalytic overall water splitting. a,b) Schematic illustration of on‐site separation of H2 and O2 gases from two‐compartment PS‐A/D‐PS system. Adapted with permission.54 Copyright 2013, American Chemical Society.
Figure 15
Figure 15
Schematic band energy diagram of PS‐C‐PS Z‐scheme system.
Figure 16
Figure 16
All‐solid‐state Z‐scheme with Au as electron mediator. a) HRTEM image and b) schematic illustration of charge transfer in CdS/Au/TiO2. Adapted with permission.23 Copyright 2006, Nature Publishing Group.
Figure 17
Figure 17
a) Charge transfer mechanism of CdS/Au/TiO1.96C0.04. b) UV–vis of TiO1.96C0.04 and CdS/Au/TiO1.96C0.04. Adapted with permission.68 Copyright 2011, American Chemical Society.
Figure 18
Figure 18
Synthetic protocol of preparation of CdS/Au/ZnO Z‐scheme structure via two‐step assembly method. Adapted with permission.[qv: 67a] Copyright 2013, Royal Society of Chemistry.
Figure 19
Figure 19
Geometry of PS‐C‐PS system that resembles butterfly wings. a,b) FESEM images of WA‐TiO2. c) TEM image of WA‐TiO2. d,e) TEM images of CdS/Au/WA‐TiO2. Adapted with permission.69 Copyright 2013, Elsevier.
Figure 20
Figure 20
PS‐C‐PS system with in situ generation of conductor. a) Synthetic protocol of Ag2S/Ag/TiO2. b,c) FESEM and HRTEM images of Ag2S/Ag/TiO2 and d) the corresponding EDX mapping. Adapted with permission.70 Copyright 2015, Springer.
Figure 21
Figure 21
a) Computed band structure of bulk TiO2 and Ag2S. b) Schematic of electron flow in Ag/Ag2S system. c) Computed differential charge distribution at interface of Ag2S and Ag. d) Schematic illustration of Z‐scheme formation for Ag2S/Ag/TiO2. Adapted with permission.70 Copyright 2015, Springer.
Figure 22
Figure 22
a) Synthetic protocol and b) charge transfer profile of CdS/Cd/ZnO Z‐scheme system. Adapted with permission.66 Copyright 2012, Wiley.
Figure 23
Figure 23
Schematic illustration of charge transfer profile for Ru/SrTiO3:La,Rh‐Ir‐CoOx/Ta3N5 Z‐scheme system. Adapted with permission.71 Copyright 2014, American Chemical Society.
Figure 24
Figure 24
A) C 1s XPS spectra of a) GO, b) hydrazine‐reduced GO, c) PRGO/BiVO4, d) PRGO/SrTiO3:Rh, and e) Ru/SrTiO3:Rh‐(PRGO/BiVO4). B) Schematic illustration of charge transfer mechanism in Ru/SrTiO3:Rh‐(PRGO/BiVO4). Adapted with permission.25 Copyright 2011, American Chemical Society.
Figure 25
Figure 25
Charge transfer mechanism of Pt/metal sulfides‐CoOx/BiVO4 in a) RGO‐mediated Z‐scheme and b) PEC. c) Current‐potential curves of BiVO4, CoOx/BiVO4, and Pt/CuGaS2. d) Overall water splitting of Pt/CuGaS2‐RGO‐BiVO4 Z‐scheme system with and without CoOx under visible light. Adapted with permission.78 Copyright 2016, American Chemical Society.
Figure 26
Figure 26
Heteroatoms doped GO in Z‐scheme. a) Schematic illustration of charge transfer mechanism of NGO‐QDs. b) Representative HRTEM image of NGO‐QDs. c) Energy band energy diagram of NGO‐QDs. Adapted with permission.80 Copyright 2014, Wiley.
Figure 27
Figure 27
Schematic illustration of a) Zn0.5Cd0.5S‐CNTs‐TiO2 and b) its charge transfer mechanism. c) HRTEM image of Zn0.5Cd0.5S‐CNTs‐TiO2. d) Band energy diagram of Zn0.5Cd0.5S‐CNTs‐TiO2. Adapted with permission.[qv: 17a] Copyright 2017, Elsevier.
Figure 28
Figure 28
Schematic illustration of a) charge transfer mechanism and b) its corresponding band position of BiVO4‐CQDs‐CdS Z‐scheme system. Adapted with permission.85 Copyright 2017, Elsevier.
Figure 29
Figure 29
Schematic band energy diagram of PS‐PS or direct Z‐scheme system.
Figure 30
Figure 30
Physical formation of direct Z‐scheme. Optical microscope images of aqueous suspension containing Ru/SrTiO3:Rh and BiVO4 under different pH. a) 7, b) 4, c) 3.4, and d) 2.5. e) Schematic illustration of contact behaviors of Ru/SrTiO3:Rh‐BiVO4 suspension under neutral and acidic conditions. Adapted with permission.27 Copyright 2009, American Chemical Society.
Figure 31
Figure 31
Chemical formation of direct Z‐scheme. a) Schematic illustration of band structure of ZnO/CdS direct Z‐scheme. b) Fluorescence emission decay spectra of ZnO, CdS and (ZnO)1/(CdS)0.2. Adapted with permission.[qv: 26a] Copyright 2009, Royal Society of Chemistry.
Figure 32
Figure 32
Metal loading method for direct Z‐scheme verification. a,b) TEM and HRTEM images of anatase/rutile TiO2 nanocomposites loaded with Pt nanoparticles. c) Plausible electronic profile of anatase/rutile TiO2 nanocomposites during photodeposition of Pt. Adapted and reproduced with permission.93 Copyright 2014, Elsevier.
Figure 33
Figure 33
Charge transfer mechanism in direct Z‐scheme and heterojunction. a) Direct Z‐scheme and b) type‐II heterojunction of BP‐BiVO4 coupling during sacrificial testing. Reproduced with permission.94 Copyright 2018, Wiley.
Figure 34
Figure 34
Radical testing for direct Z‐scheme verification. a) PL spectra of g‐C3N4/TiO2 nanocomposites in solution containing 5 × 10⁻⁴ M TA under irradiation (excitation at 315 nm). b) Effect of scavengers on degradation of ISN using g‐C3N4/TiO2 nanocomposites. c) Charge transfer mechanism of g‐C3N4/TiO2 in both direct Z‐scheme and type‐II heterojunction systems. Adapted and reproduced with permission.97 Copyright 2015, Elsevier.
Figure 35
Figure 35
XPS method for direct Z‐scheme verification. High resolution XPS spectra of a) C 1s and b) N 1s of g‐C3N4 and g‐C3N4/ZnO. High resolution XPS spectra of c) Zn 2p and d) O 1s of ZnO and g‐C3N4/ZnO. Adapted with permission.99 Copyright 2015, Royal Society of Chemistry.
Figure 36
Figure 36
Formation of direct Z‐scheme. Schematic illustration of electronic band structure diagram of g‐C3N4/ZnO before and after contact. Reproduced with permission.22 Copyright 2017, Wiley.
Figure 37
Figure 37
Heterojunction and direct Z‐scheme in g‐C3N4/W18O49. a,b) Electronic band structure diagram and c,d) energy diagram during Fermi level alignment in type‐II heterojunction and Z‐scheme system. Adapted and reproduced with permission.100 Copyright 2017, Elsevier.
Figure 38
Figure 38
Fermi level difference between g‐C3N4 and W18O49 with and without addition of sacrificial reagent measured by a) OCP and b) DFT. Calculated potential measured by DFT of c) g‐C3N4 and d) W18O49. Adapted with permission.100 Copyright 2017, Elsevier.
Figure 39
Figure 39
High resolution XPS of TEOA‐adsorbed g‐C3N4/W18O49, pure g‐C3N4/W18O49 and their respective individual components of a) O 1s and b) N 1s. Adapted with permission.100 Copyright 2017, Elsevier.
Figure 40
Figure 40
Electronic configuration of direct Z‐scheme in g‐C3N4/Fe2O3. Calculated WF of a) g‐C3N4 and b) Fe2O3. c) Estimated band configuration of g‐C3N4/Fe2O3. d) HRTEM image of Pt‐loaded g‐C3N4/Fe2O3. Adapted with permission.101 Copyright 2018, Wiley.
Figure 41
Figure 41
Electronic configuration of p–n junction in g‐C3N4/Bi4Ti3O12. a) Band structure diagram of g‐C3N4 and Bi4Ti3O12. b) Charge transfer mechanism of g‐C3N4/Bi4Ti3O12 nanocomposites. Adapted and reproduced with permission.102 Copyright 2016, Elsevier.
Figure 42
Figure 42
Technological map of three different solar H2 production approaches for practical solar energy conversion. Adapted and reproduced with permission.3 Copyright 2019, Royal Society of Chemistry.
Figure 43
Figure 43
a) Large‐scale photocatalytic H2 production using reactor containing immobilized Pt/g‐C3N4. Adapted with permission.113 Copyright 2015, Wiley. b) Photocatalytic water splitting panel with immobilized RhCrOx/Al:SrTiO3. Adapted with permission.9 Copyright 2018, Elsevier.
Figure 44
Figure 44
Particulate Z‐scheme photocatalyst sheets. Band configuration and plausible charge transfer mechanism in particulate Z‐scheme photocatalyst sheets. Adapted with permission.114 Copyright 2018, American Chemical Society.
Figure 45
Figure 45
a) Preparation of Z‐scheme photocatalyst sheets using particle transfer method. b) Schematic illustration of charge transfer mechanism and overall water splitting reaction of SrTiO3:La,Rh/Au/BiVO4:Mo Z‐scheme sheets. Adapted with permission.28 Copyright 2016, Nature Publishing Group.
Figure 46
Figure 46
SEM–EDX mapping of a–e) top view and f–j) cross‐sectional view of SrTiO3:La,Rh‐C‐BiVO4:Mo photocatalyst sheets. Adapted with permission.115 Copyright 2017, American Chemical Society.
Figure 47
Figure 47
a) PESA results for Au, graphite, sputtered carbon and glassy carbon. b) Effect of background pressure on overall water splitting performance of Ru‐loaded SrTiO3:La,Rh‐C‐BiVO4:Mo photocatalyst sheets. Adapted with permission.115 Copyright 2017, American Chemical Society.
Figure 48
Figure 48
Photocatalyst sheets with direct Z‐scheme configuration. a) False‐colored SEM image of Si/TiO2 nanotree arrays. b) Photographs of TiO2, Si and Si/TiO2 films compared to a US quarter (right). c,d) Enlarged SEM images of Si/TiO2 nanotree arrays. Adapted with permission.116 Copyright 2013, American Chemical Society.
Figure 49
Figure 49
Mechanism of electron flows in Si/TiO2 nanotree arrays. a) Schematic illustration of charge transfer in Si/TiO2 nanotree arrays. b) Electronic configuration of Si/TiO2 nanotree arrays in overall water splitting. Adapted with permission.116 Copyright 2013, American Chemical Society.
Figure 50
Figure 50
Relationship between STH conversion efficiency and maximum wavelength of photons available for water splitting at different values of AQY for photocatalytic water splitting. Adapted and reproduced with permission.119 Copyright 2014, Springer.
Figure 51
Figure 51
A) Electronic band structure of photocatalysts after interstitial doping of heteroatoms. Adapted with permission.122 Copyright 2012, American Chemical Society. B) UV–vis DRS of a) SrTiO3, b) SrTiO3:Rh, c,d) SrTiO3:La/Rh prepared by one‐step SSR and two‐step SSR. Adapted with permission.71 Copyright 2014, American Chemical Society.
Figure 52
Figure 52
Photocatalytic overall water splitting of WO3‐based Z‐scheme redox system. Rate of gas evolution over PtOx/H‐Cs‐WO3 as OEP and Pt/SrTiO3:Cr,Ta as HEP in I3 /I and IO3 /I system under different pH. Adapted with permission.[qv: 36c] Copyright 2013, Royal Society of Chemistry.
Figure 53
Figure 53
A) Consumptions of H2 and O2 due to backward reactions on Pt/SrTiO3:Rh‐BiVO4 (Triangle) and Ru/SrTiO3:Rh‐BiVO4 (Circle). B) Overall water splitting of a) Ru/SrTiO3:Rh‐BiVO4 and b) Pt/SrTiO3:Rh‐BiVO4. Adapted with permission.[qv: 37c] Copyright 2008, Elsevier.
Figure 54
Figure 54
a) HRTEM image of Rh/Cr2O3‐loaded (Ga1− xZnx)(N1− xOx). b) Schematic of overall water splitting mechanism on nanostructured core/shell co‐catalyst loaded HEP. Adapted and reproduced with permission.125 Copyright 2006, Wiley. c) ORR activity of C/Ti and Au/Ti electrodes. Adapted with permission.115 Copyright 2017, American Chemical Society.

References

    1. Global B., BP Statistical Review of World Energy 2017. (Online), https://www.bp.com/content/dam/bp/business-sites/en/global/corporate/pdf... (accessed September 2019).
    1. Irena., Renewable Energy Topic. (Online) https://resourceirena.irena.org/gateway/dashboard/index.html?topic=4&sub... (accessed September 2019).
    1. Kim J. H., Hansora D., Sharma P., Jang J. W., Lee J. S., Chem. Soc. Rev. 2019, 48, 1908. - PubMed
    1. a) Putri L. K., Ng B.‐J., Er C.‐C., Ong W.‐J., Chang W. S., Mohamed A. R., Chai S.‐P., Appl. Surf. Sci. 2020, 504, 144427;
    2. b) Kong X. Y., Tan W. L., Ng B.‐J., Chai S.‐P., Mohamed A. R., Nano Res. 2017, 10, 1720;
    3. c) Tang J.‐Y., Kong X. Y., Ng B.‐J., Chew Y.‐H., Mohamed A. R., Chai S.‐P., Catal. Sci. Technol. 2019, 9, 2335.
    1. a) Xu J., Cao X., Chem. Eng. J. 2015, 260, 642;
    2. b) Putri L. K., Ng B.‐J., Tan K. H., Lim F. S., Ong W.‐J., Chang W. S., Chai S.‐P., Catal. Today 2018, 315, 93.

LinkOut - more resources