. 2020 May;34(5):7192-7207.
doi: 10.1096/fj.202000110R. Epub 2020 Apr 10.

Structural and functional divergence of GDAP1 from the glutathione S-transferase superfamily

Affiliations

Structural and functional divergence of GDAP1 from the glutathione S-transferase superfamily

Matthew R Googins et al. FASEB J. 2020 May.

Abstract

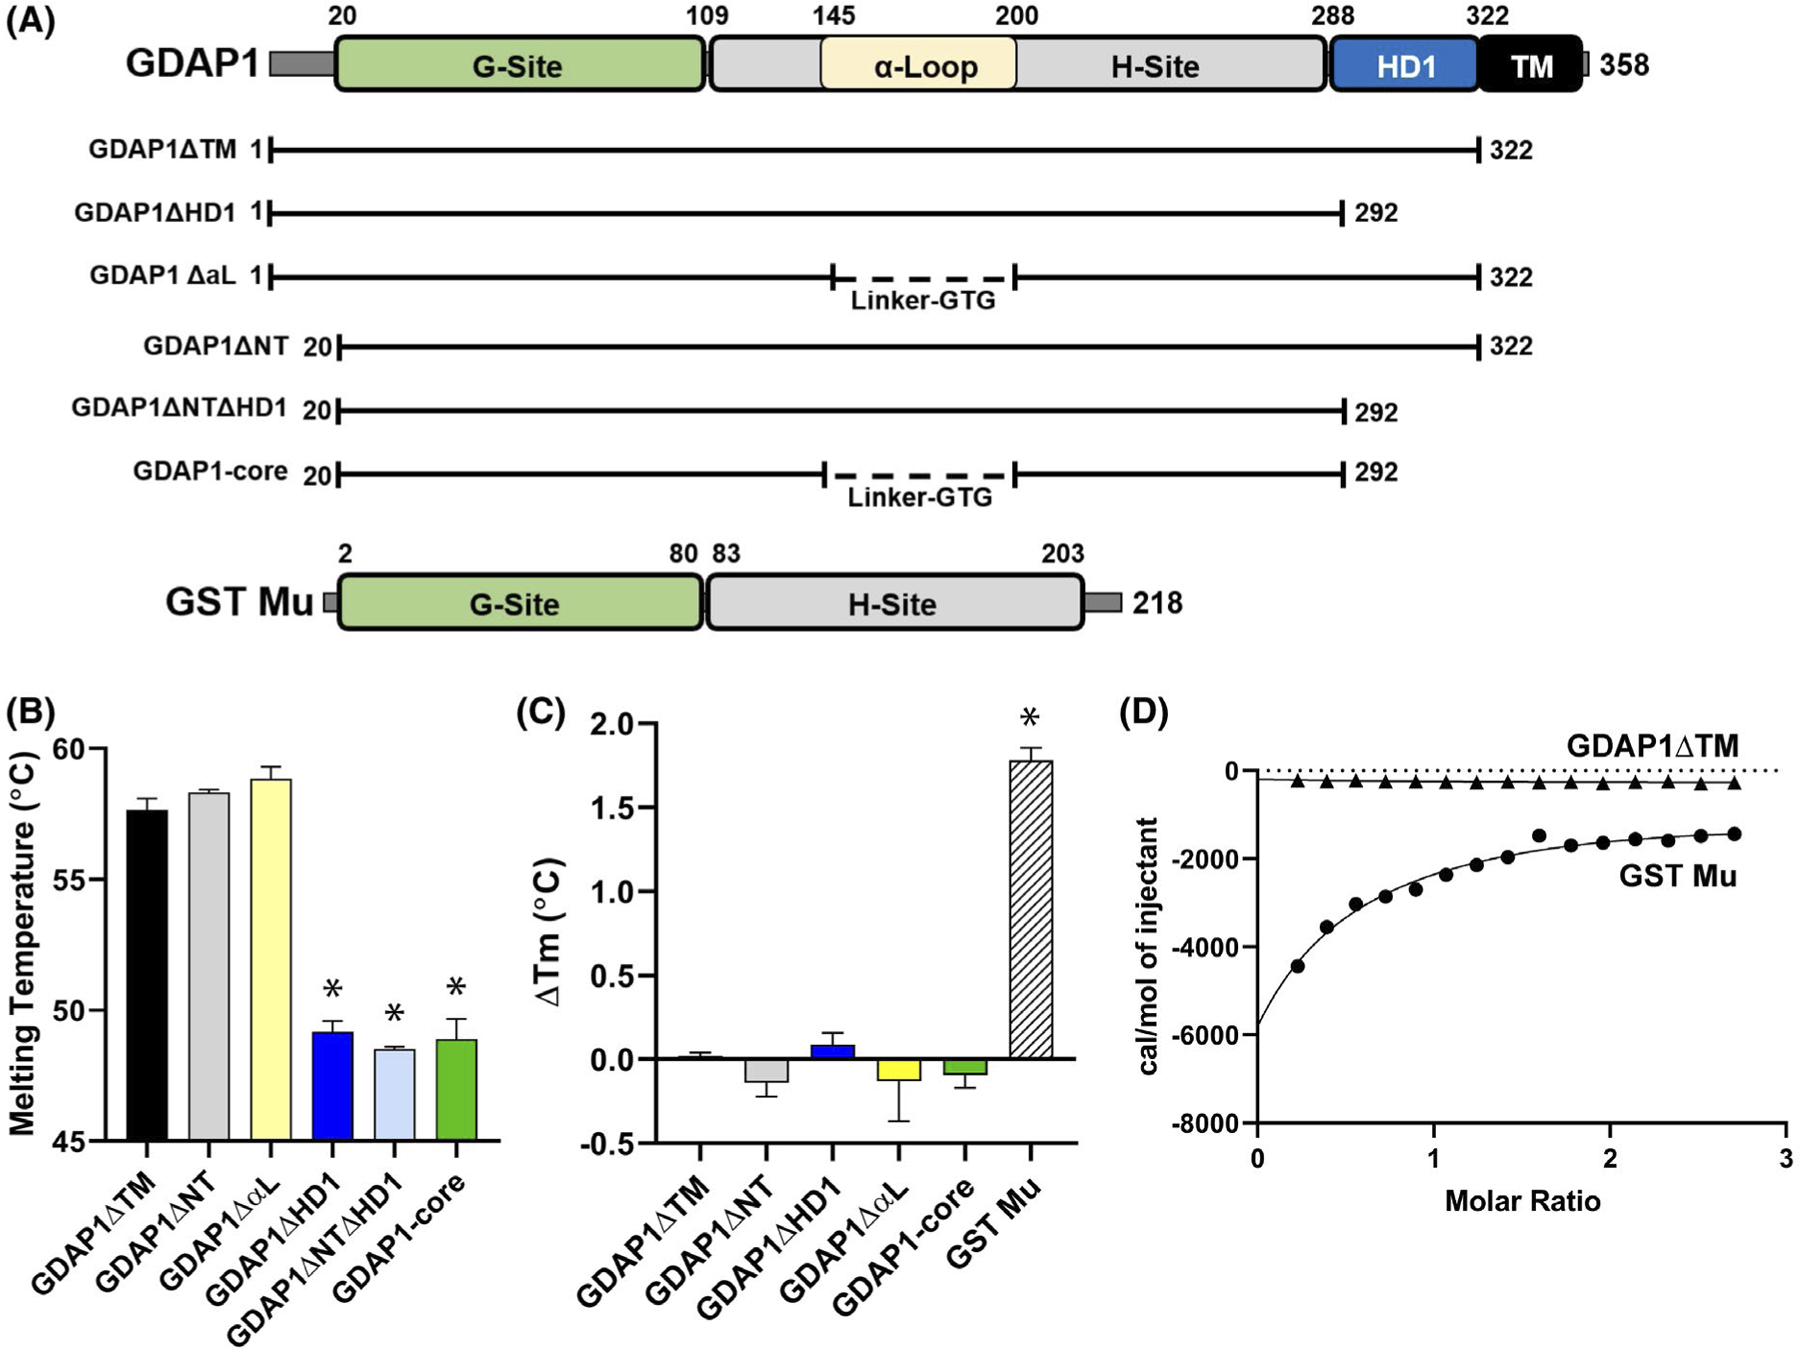
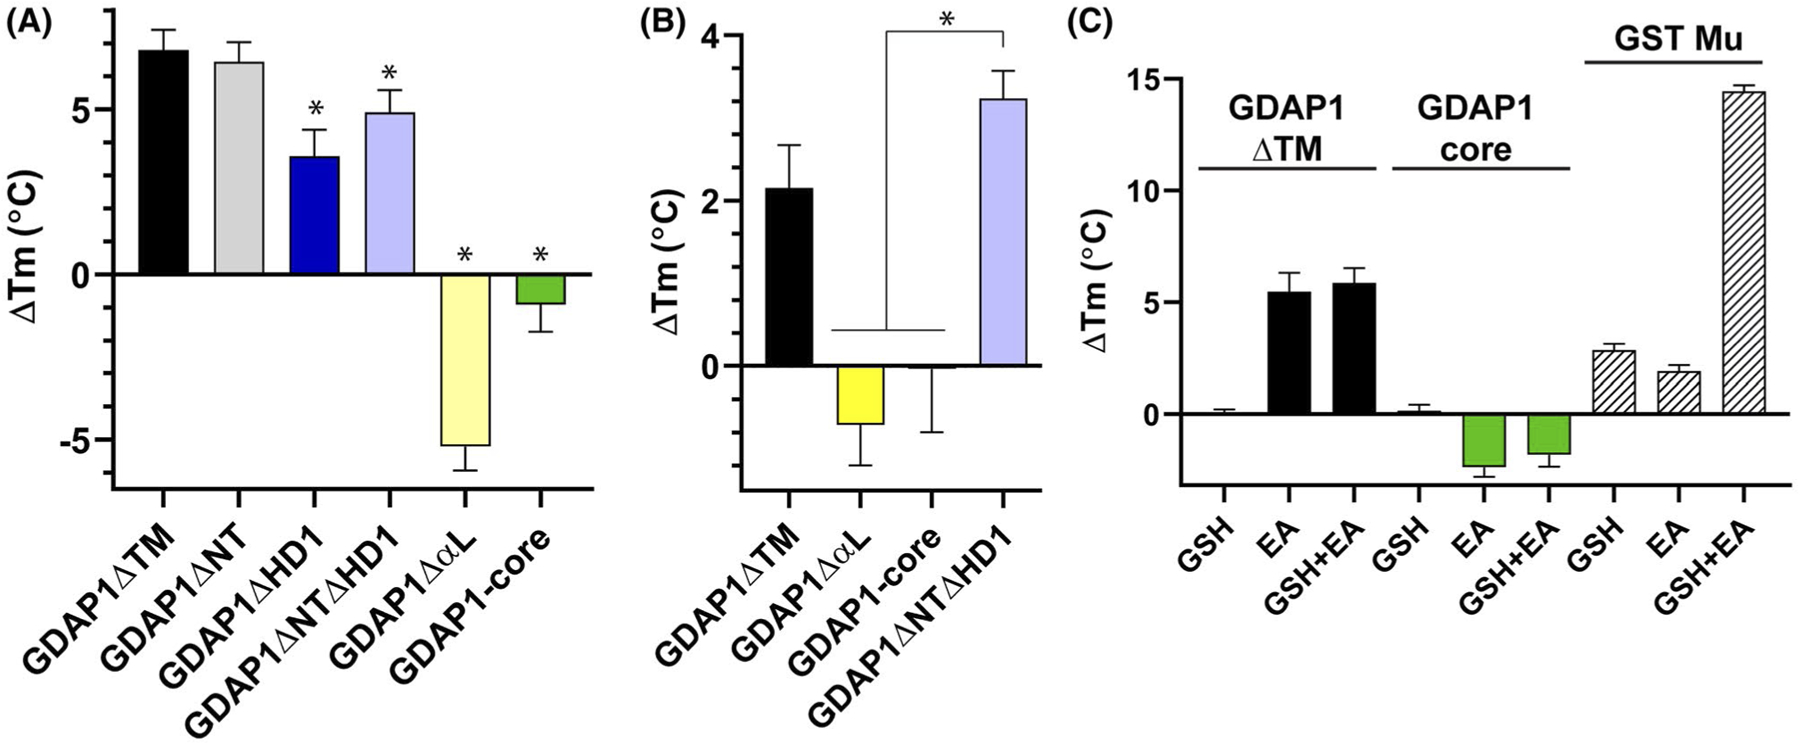
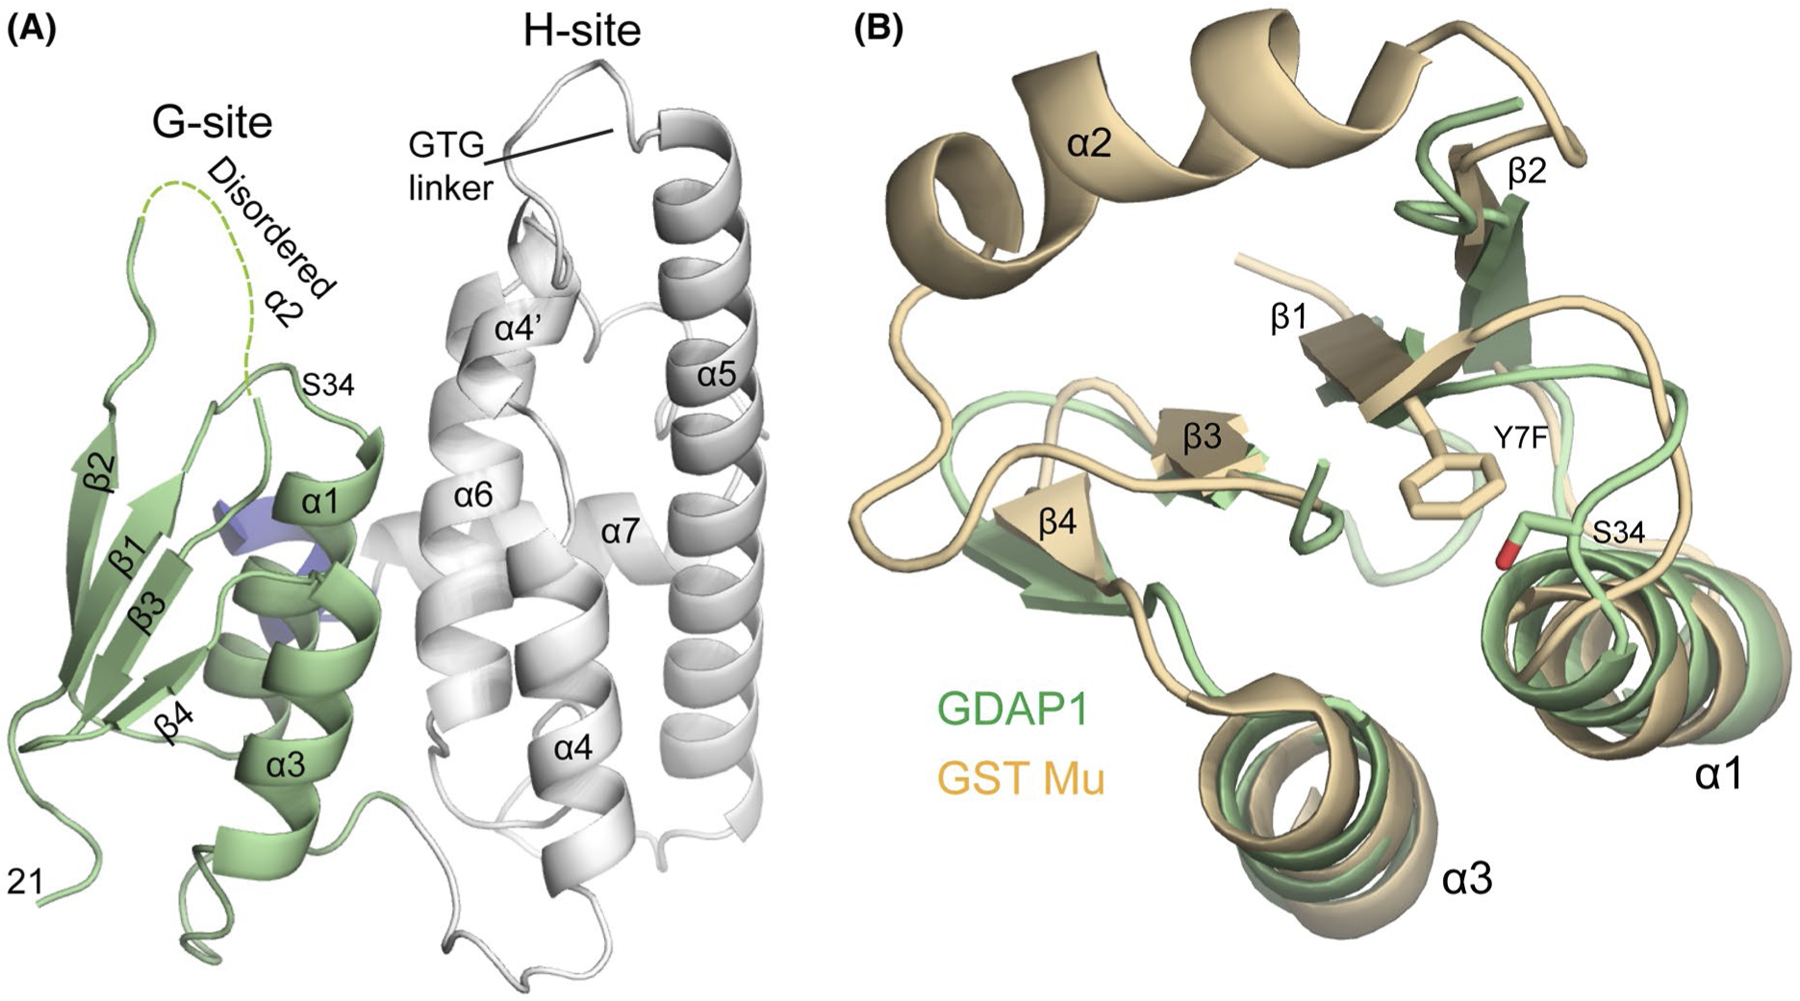
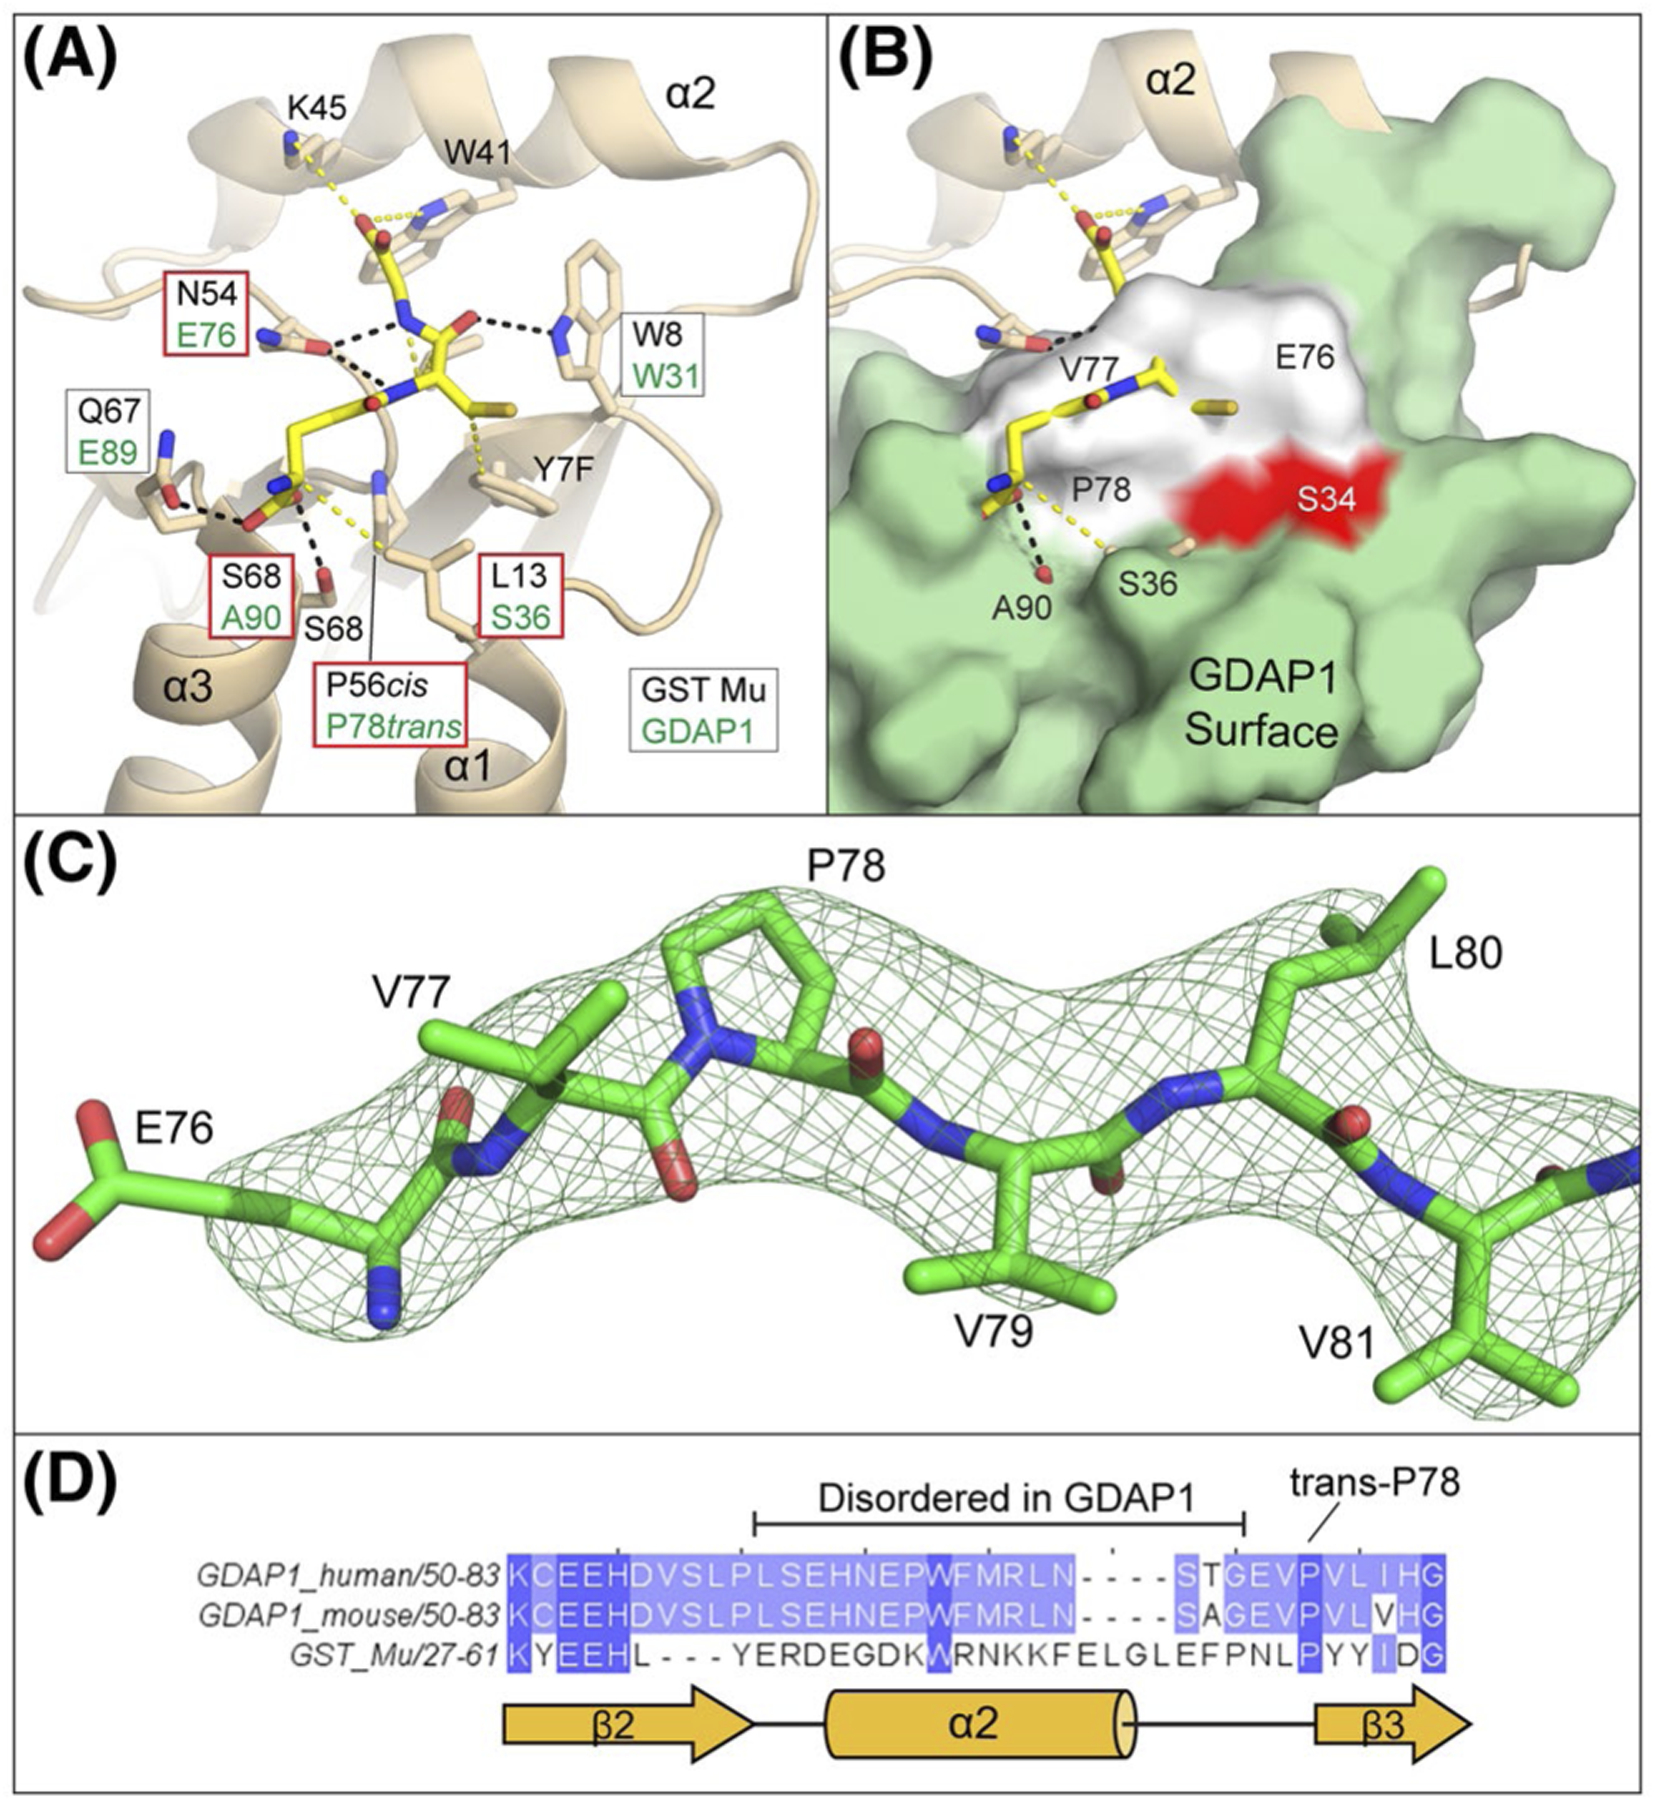
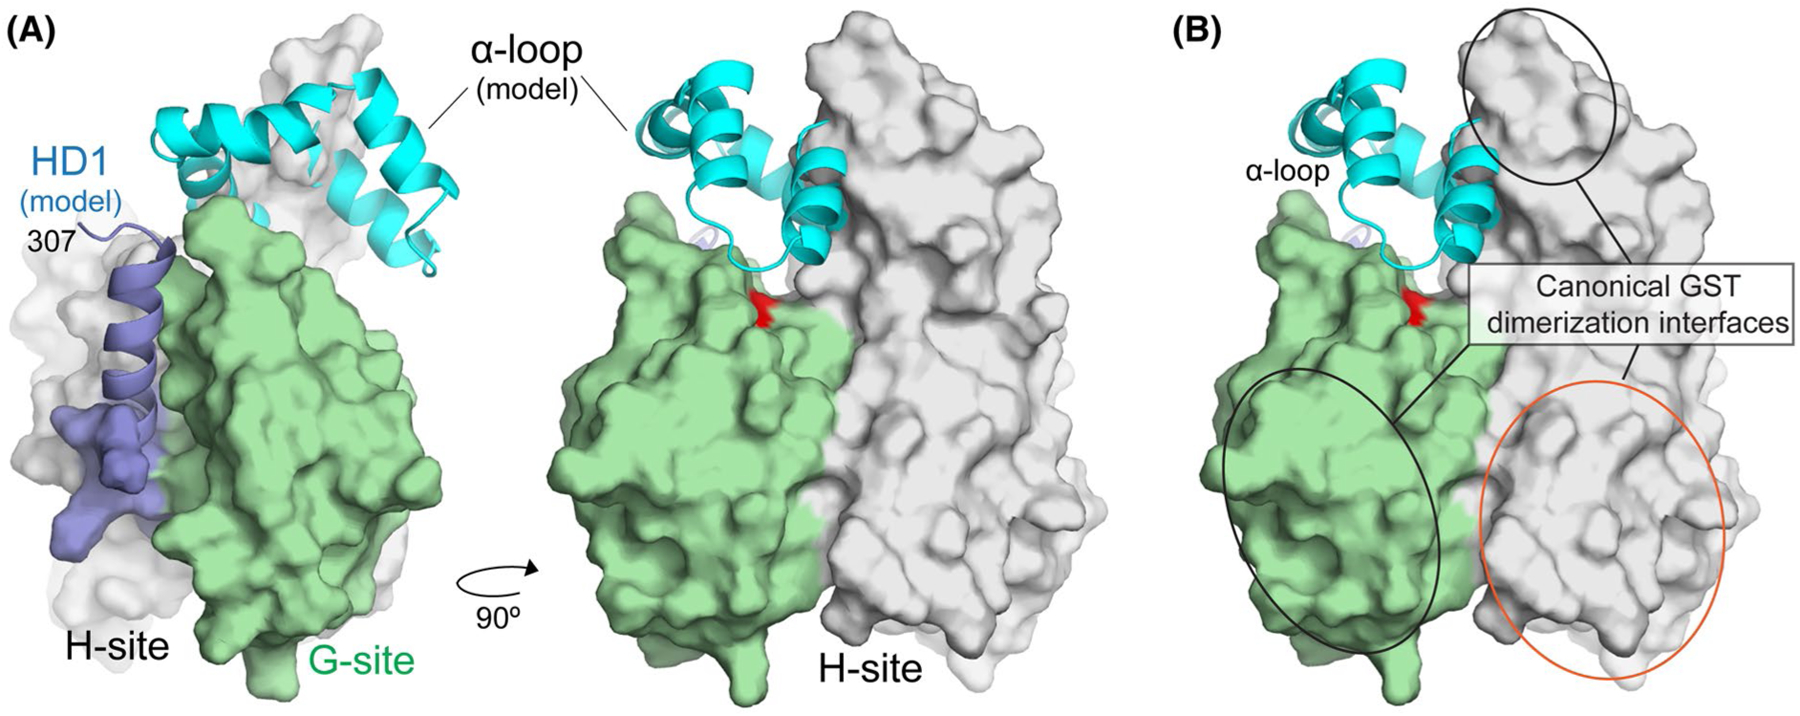
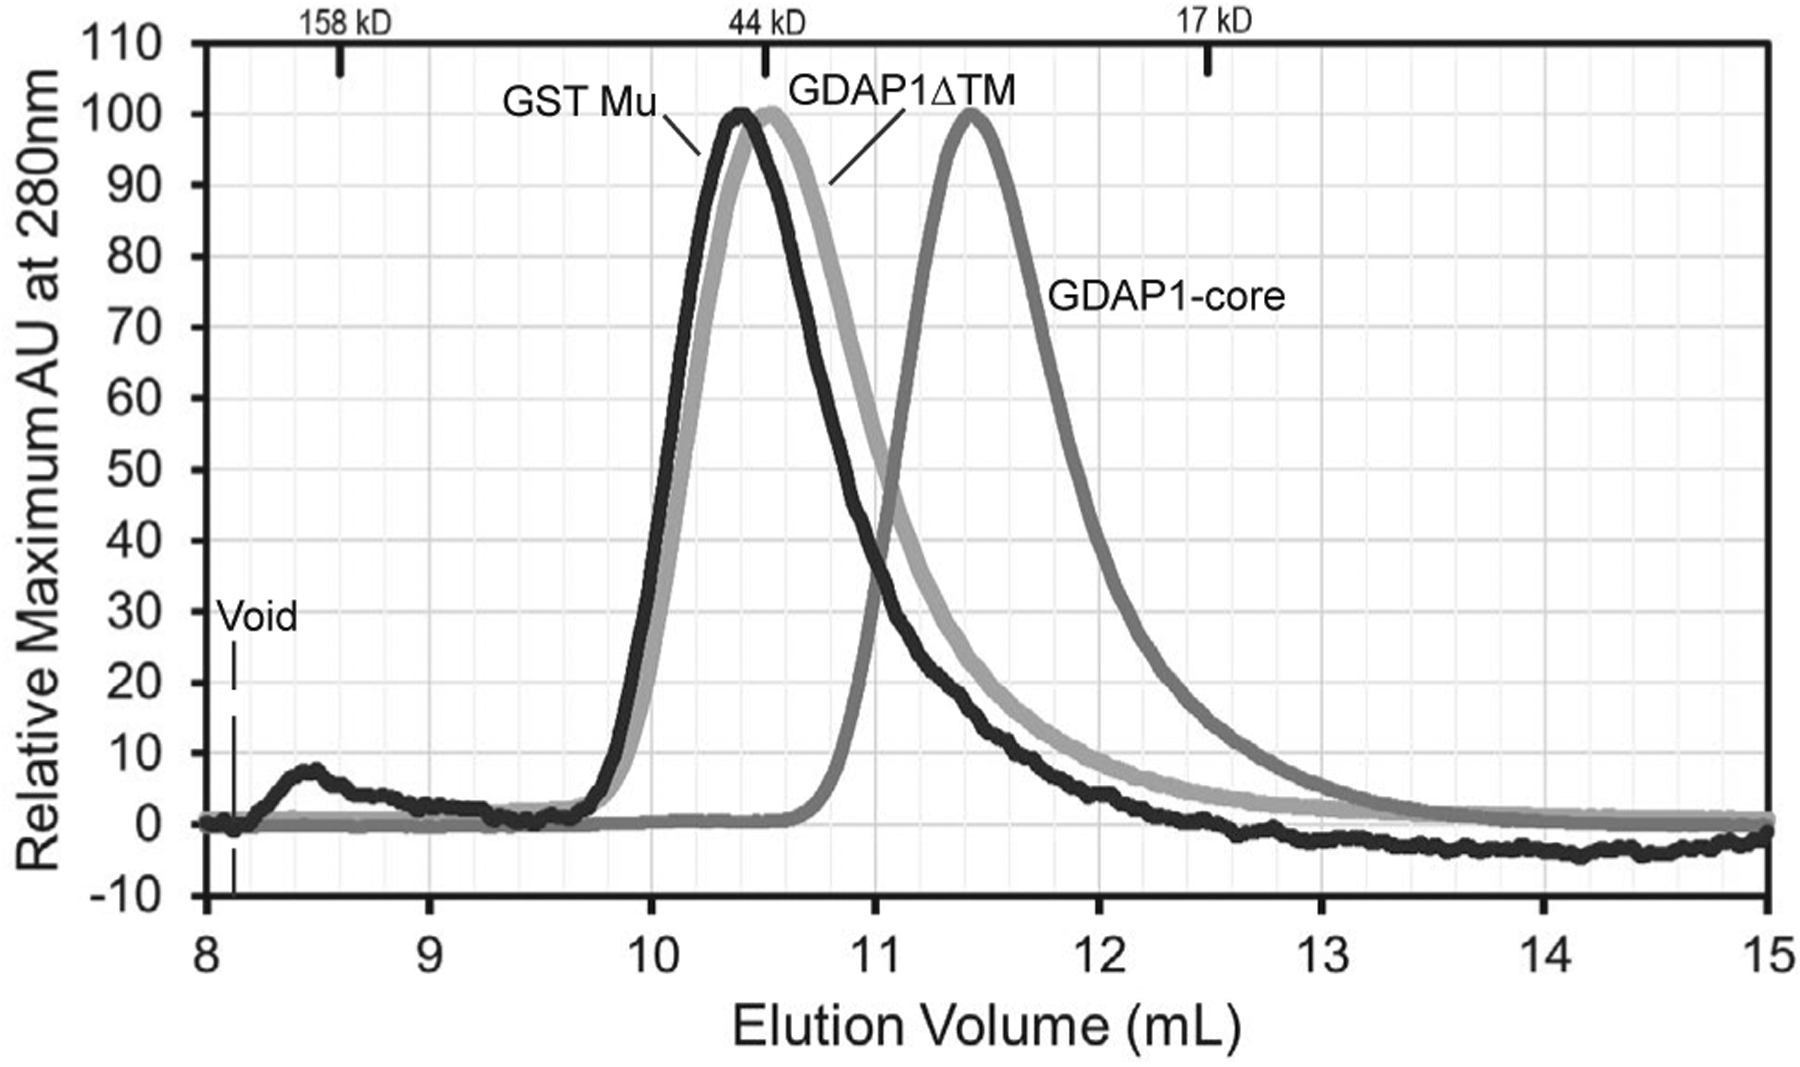
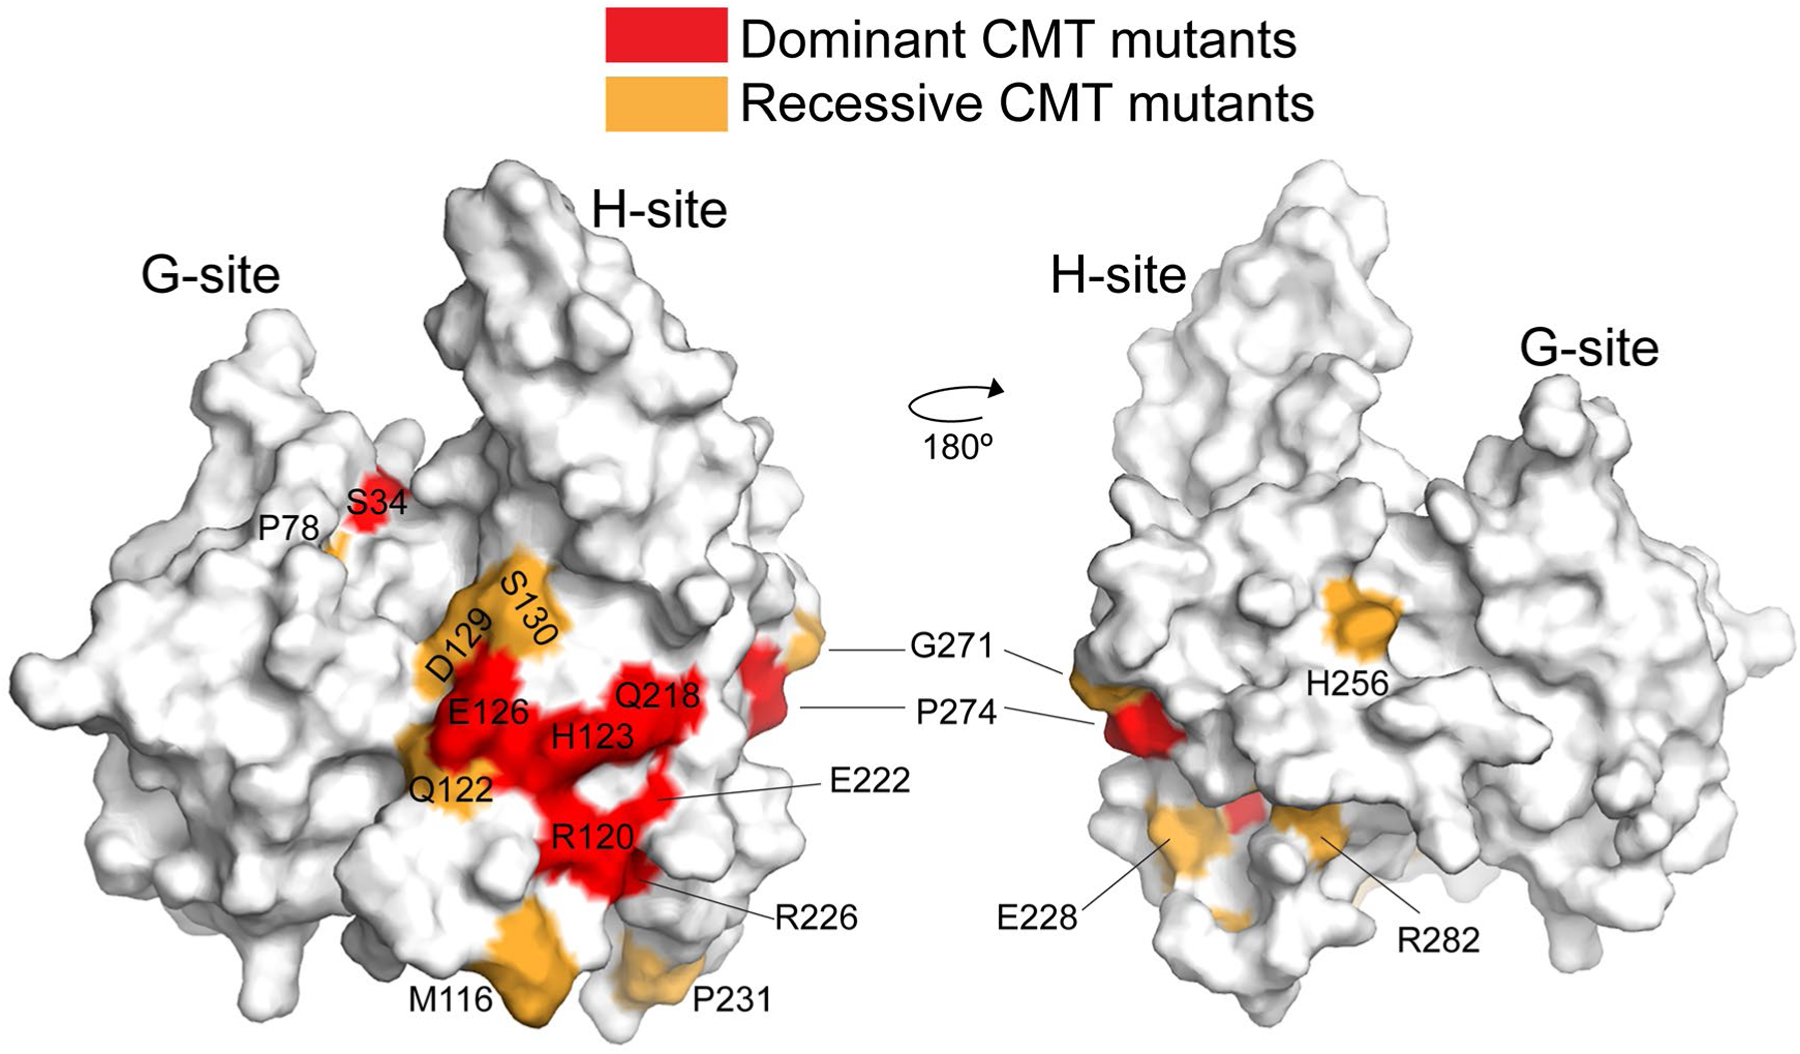
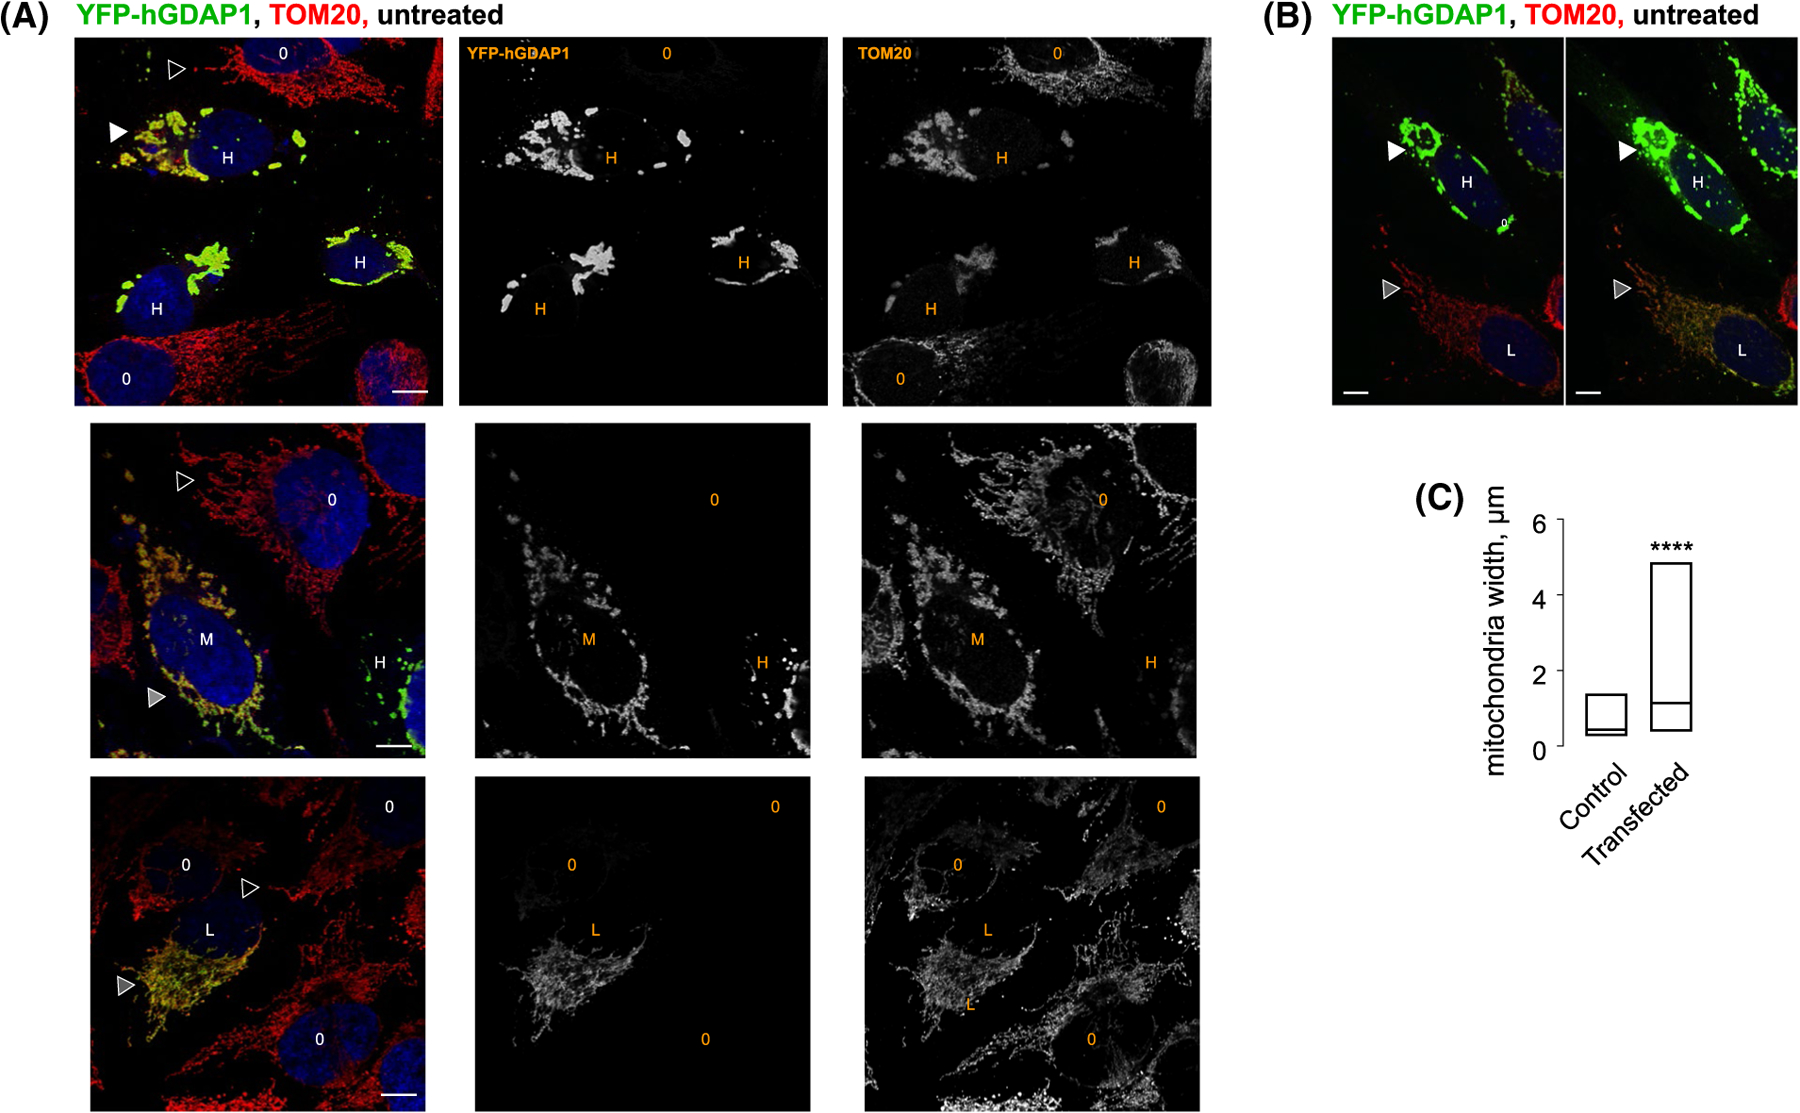
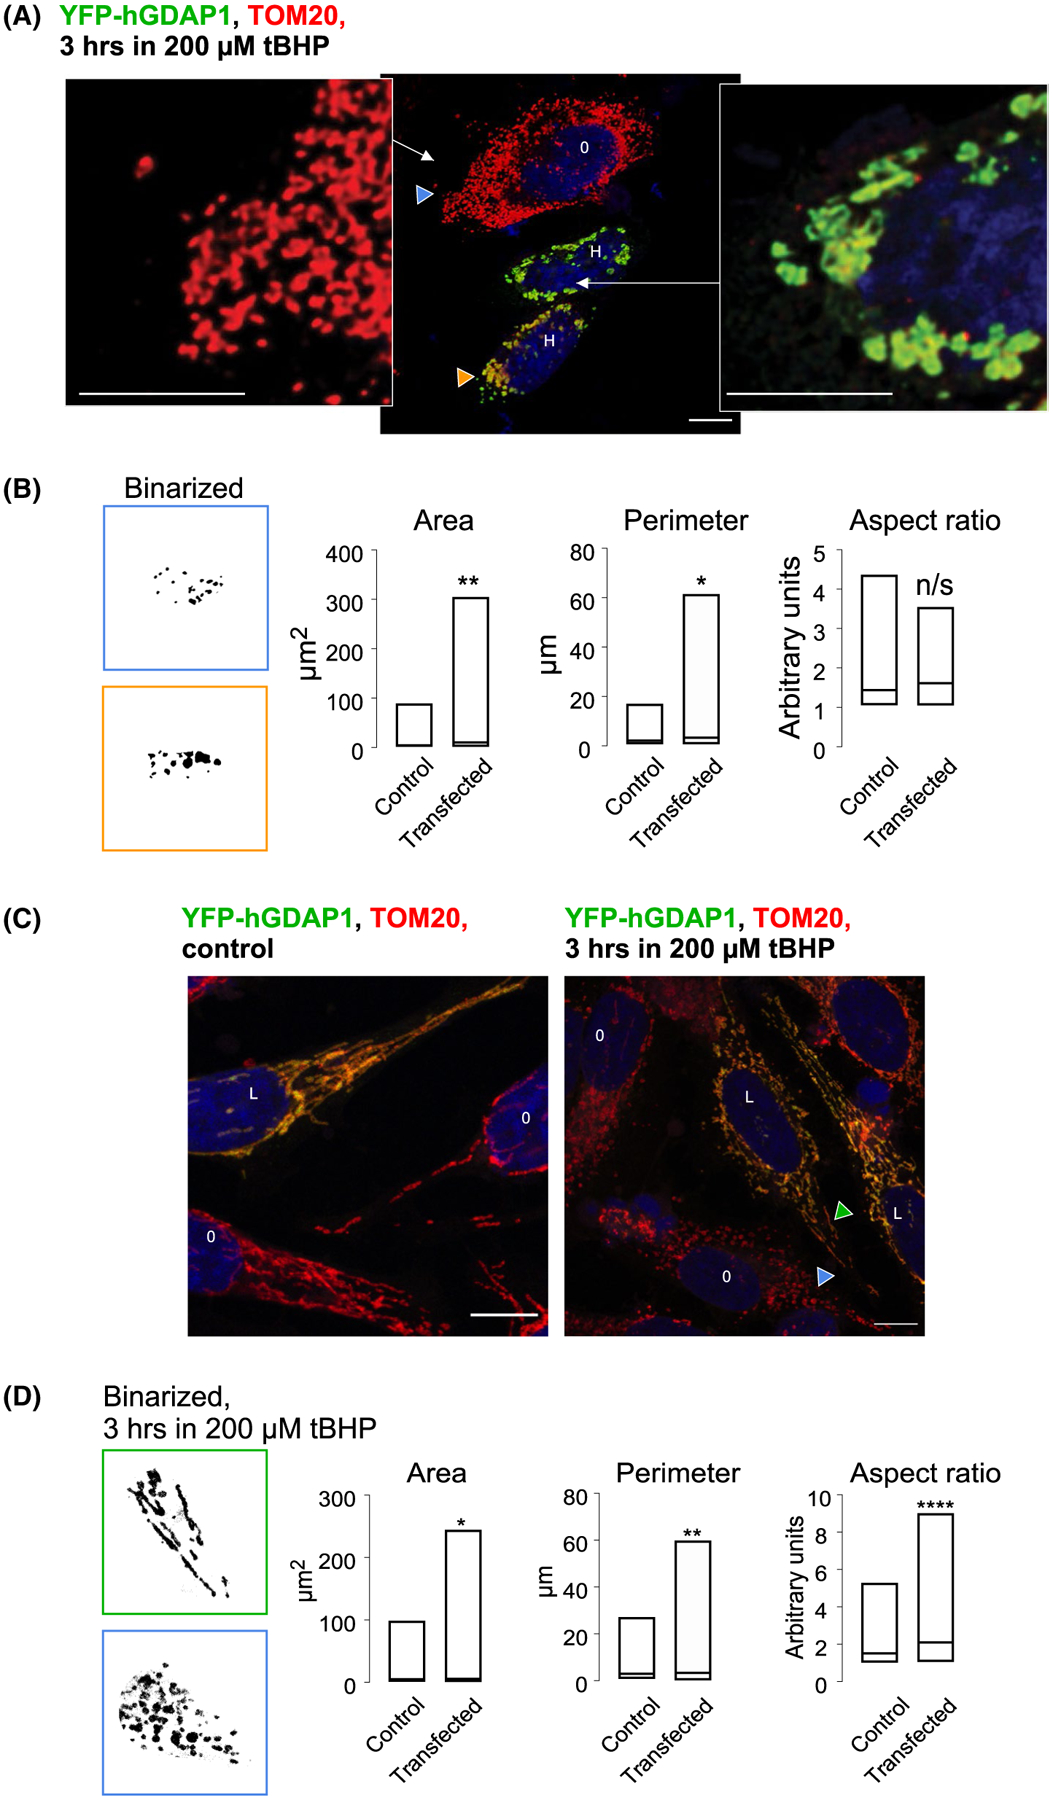
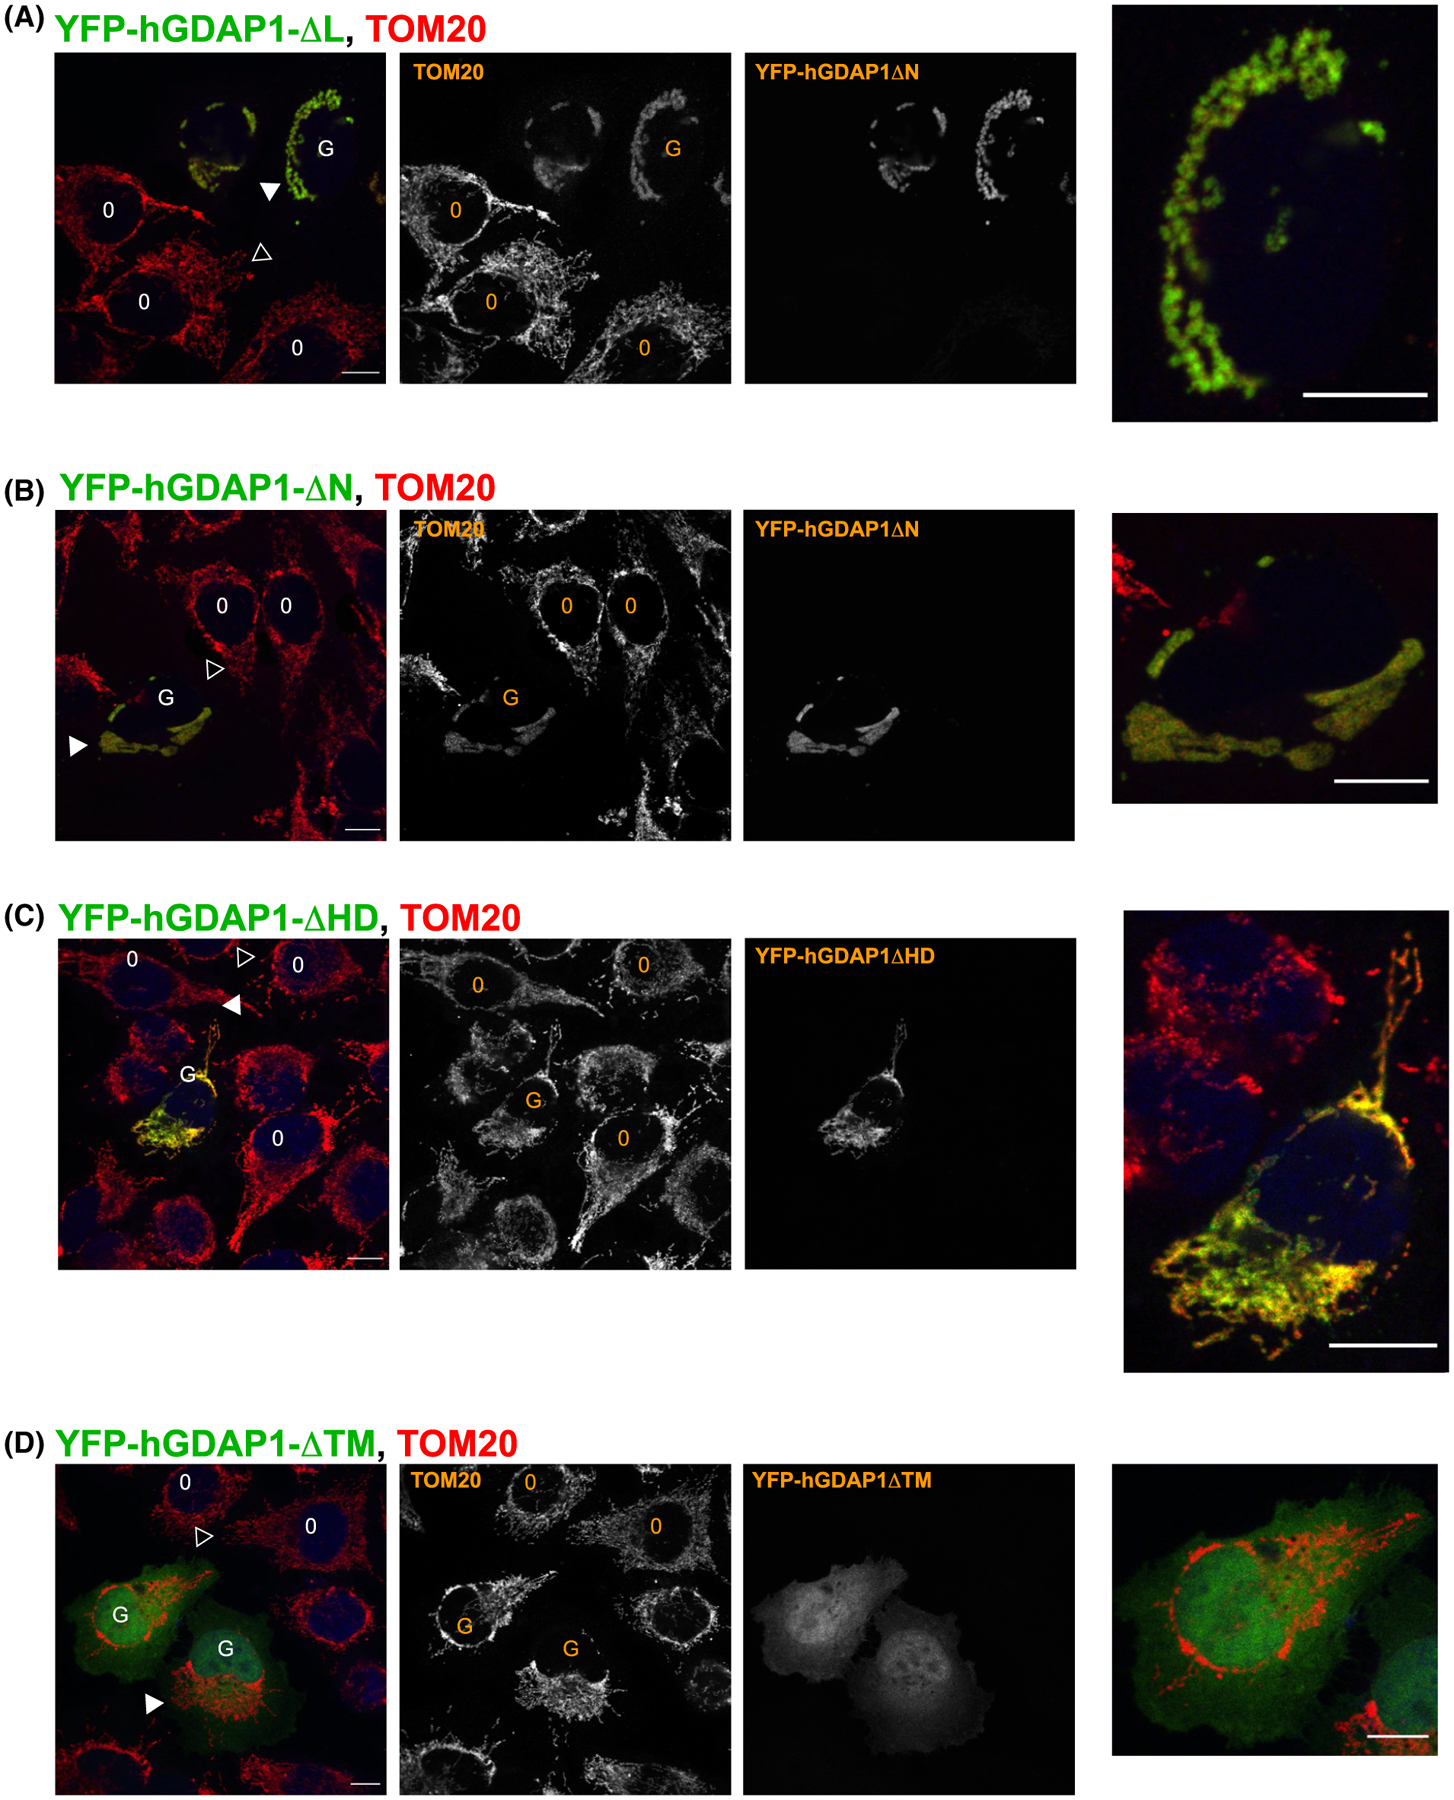
Mutations in ganglioside-induced differentiation-associated protein 1 (GDAP1) alter mitochondrial morphology and result in several subtypes of the inherited peripheral neuropathy Charcot-Marie-Tooth disease; however, the mechanism by which GDAP1 functions has remained elusive. GDAP1 contains primary sequence homology to the GST superfamily; however, the question of whether GDAP1 is an active GST has not been clearly resolved. Here, we present biochemical evidence, suggesting that GDAP1 has lost the ability to bind glutathione without a loss of substrate binding activity. We have revealed that the α-loop, located within the H-site motif is the primary determinant for substrate binding. Using structural data of GDAP1, we have found that critical residues and configurations in the G-site which canonically interact with glutathione are altered in GDAP1, rendering it incapable of binding glutathione. Last, we have found that the overexpression of GDAP1 in HeLa cells results in a mitochondrial phenotype which is distinct from oxidative stress-induced mitochondrial fragmentation. This phenotype is dependent on the presence of the transmembrane domain, as well as a unique hydrophobic domain that is not found in canonical GSTs. Together, we data point toward a non-enzymatic role for GDAP1, such as a sensor or receptor.

Keywords: X-ray crystallography; ganglioside-induced differentiation-associated protein 1; mitochondria; oxidative stress; structural biology.


Conflict of interest statement

CONFLICT OF INTEREST

The authors declare no conflicts of interest.

Figures

FIGURE 1
FIGURE 1
GDAP1 does not bind glutathione in vitro. A, Diagram of GDAP1 protein, its truncated constructs, and GST Mu taken from Schistosoma japonicum with showing its functional domains: G-Site, Glutathione binding domain; α-Loop, insertion of unknown function; H-site, substrate-binding domain; HD1, Hydrophobic Domain; TM, Transmembrane Domain. B, Melting temperatures of indicated GDAP1 constructs using differential scanning fluorimetry. The data are the average of three independent experiments with error bars indicating standard deviation. The statistical significance using a one-way ANOVA is shown (*) for P < .01. C, Differential scanning fluorimetry data comparing the melting temperatures in the presence and absence of 2 mM GSH with all GDAP1 constructs vs GST Mu and were statistically analyzed using a two-way ANOVA comparing GDAP1 constructs, with and without 2 mM GSH, with each other and then each construct against GST Mu. Annotations of statistical significance on the graph represent each construct vs GST Mu as the constructs showed no statistical significance from each other. D, Isothermal calorimetry comparing 150μM of GDAP1ΔTM and GST Mu when subjected to injections of 2 mM GSH, as described in Materials and Methods
FIGURE 2
FIGURE 2
The α-Loop and HD1 are involved in substrate binding in vitro. A, Differential scanning fluorimetry of GDAP1 constructs comparing their melting temperatures with and without the addition of 2 mM Ethacrynic Acid, as described in Materials and Methods. Data are the average of 4 independent experiments with error bars representing standard deviation. Statistically significant (*) indicate a P < .01 using a two-way ANOVA. B, Differential scanning fluorimetry with 0.5 mM ethacrynic acid indicates that the presence of the α-loop plays an important role in substrate binding even at lower substrate concentrations. C, Differential scanning fluorimetry looking at the melting temperature shifts of GDAP1 constructs upon the addition of 1 mM GSH, 1 mM ethacrynic acid, or both 1 mM GSH and 1 mM Ethacrynic Acid. Data are representing four independent experiments with error bars showing standard deviation
FIGURE 3
FIGURE 3
Structure of the GST-like core of GDAP1. A, Cartoon of GDAP1-core structure with G-site shown in green, H-site in white and residues 286–292 which are contained within the HD1 domain indicated in blue. B, Structural overlap of G-sites from GDAP1 (green) and GST Mu (orange). The active site residue position from GST Mu (Y7 but was mutated to Phe in this structure (PDBid:1U87) and the putative active site residue from GDAP1 (S34) are shown as sticks
FIGURE 4
FIGURE 4
Binding surfaces of the GDAP1 G-Site are incompatible with GSH binding. A, Arrangement of glutathione interacting residues within GST Mu (PDBid 1U87). Hydrogen bonding interactions are indicated as black dashes and van der Walls interactions are yellow dashes. For each interacting residue, the corresponding residue from a structural alignment of GDAP1 with GST Mu is indicated within a box and the box colored by whether the change is conservative (white) or not conservative (red). Corresponding residues within α2 are not known as it is disordered in GDAP1. B, Superposition of GDAP1 with GST Mu glutathione binding pockets. For orientation, the position of the canonical GST active site residue (S34) is shown in red. GDAP1 residues 76–78 which occlude the glutathione binding pocket are shown in white. C, Omit map for residues 76–81 (Fo-Fc map contoured at 3.0σ) shown in mesh while GDAP1 residues 76–81 are shown in sticks, D, Primary sequence alignment of GDAP1 (mouse and human) and GST Mu in the region around helix α2. The observed secondary structure of GST Mu is indicated in yellow cartoon below for reference
FIGURE 5
FIGURE 5
Structural model for the cytoplasmic domain of GDAP1. A, Model for the location of the α-loop and the HD1 domain relative to the core. The experimentally derived GDAP1-core is shown as a molecular surface and colored as in Figure 3. The α-loop (cyan) and a portion of the HD1 (blue) were added from structural predictions generated by I-TASSER. B, Modeled α-loop and HD1 regions do not overlap with surfaces used by canonical GSTs to promote dimerization (red and black ovals)
FIGURE 6
FIGURE 6
GDAP1 constructs are monomeric. Analytical Size Exclusion Chromatography was performed on GDAP1ΔTM, GDAP1-core, and GST Mu proteins. Retention volumes for standards are indicated on the top. The elution volumes of GDAP1 constructs indicate that GDAP1 constructs lacking the transmembrane domain are monomeric
FIGURE 7
FIGURE 7
CMT mutants are cluster on a canonical dimerization interface from GSTs. Surface representation of the GDAP1-core in the same orientation as in Figure 3A (left) or rotated 180° (right). Dominant mutations are indicated in red, recessive mutations are shown in orange
FIGURE 8
FIGURE 8
Overexpression of GDAP1 results in a distended mitochondrial morphology. A, Representative confocal images of HeLa cells transfected with YFP-GDAP1 fusion (full-length human GDAP1 containing the transmembrane domain, green) and stained with anti-TOM20 antibodies (red). Blue is DAPI. O identifies cells that were not transfected as evidenced by the lack of green signal from YFP-GDAP1. H, M and L represent highly, medium and low expressing cells. Hollow triangles point to normal tubular mitochondria. White triangles point to the distended mitochondria. Gray triangles point to intermediate and normal mitochondrial phenotypes in GDAP1-positive cells. B, Images representing the same field of view were taken at two different laser intensity and amplification gain to show the differences in GDAP1 expressing levels in GDAP1-positive cells with the distended and normal phenotypes. C, Box plot representing a triplicate set of images used for analysis. Data represent 153 particles for the control and 62 particles for the transfected set. **** is P < .0001 using unpaired two-tailed t-test. The size bar represents 10 μm
FIGURE 9
FIGURE 9
Confocal analysis of mitochondrial morphology in control and GDAP1-overexpressing cells under oxidative stress. A, Mitochondrial fragmentation in control and overexpressing cells exposed to 200 μM tBHP for 3 hours. Zoom-out (middle) and zoom-in images represent control mitochondria (blue arrowheads) and mitochondria overexpressing full -length wild-type human GDAP1 containing the transmembrane domain (orange arrowheads). O represents control cells and H represents highly GDAP1-expressing cells. B, Binarized fragments of images containing the individual mitochondrial particles. Blue frame represents mitochondria from control and orange frame represents mitochondria from GDAP1-overexpressing cells. Box plot representing a triplicate set of images used for analysis. Data represent 126 particles for the control and 57 particles for the transfected set. * is P < .05 and ** is P < .005 using the unpaired two-tailed t-test. C, Protective effect of low GDAP1 expressing against mitochondrial fragmentation induced by oxidative stress. Confocal images. Blue arrowheads point to control mitochondria and green arrowheads point to mitochondria in the cell expressing low levels of recombinant GDAP1. O represents control cells and L represents low GDAP1-expressing cells. D, Binarized fragments of images containing individual mitochondrial particles from cells treated with 200 μM tBHP for 3 hours. Blue frame represents mitochondria from control and green frame represents mitochondria from GDAP1-overexpressing cells. Box plot representing a 5-image set used for analysis. Data represent 280 particles for the control and 325 particles for the transfected set. * is P < .05, ** is ** is P < .005 **** is P < .0001 using unpaired two-tailed t-test. The size bar represents 10 μm
FIGURE 10
FIGURE 10
Confocal analysis of GDAP1 variants indicates that TM and HD1 regions are important for regulating mitochondrial morphology when overexpressed. GFP-fusion of human GDAP1 containing the transmembrane domain was transiently expressed in HeLa cells and analyzed using confocal microscopy. The cells were fixed and stained against the mitochondrial marker TOM20 as described in the methods section. O represents control cells and G represents cells expressing recombinant GDAP1. Solid arrowhead shows mitochondria in cells expressing GDAP1 mutants, and hollow arrowheads show mitochondria in control, un-transfected cells. A, Cells transfected with GDAP1ΔαL show the distended mitochondrial phenotype. B, The distended phenotype is present in cells transfected with GDAP1ΔNT. C, Cells transfected with GDAP1ΔHD1 do not show obvious distended mitochondrial phenotype. D, GDAP1ΔTM is present throughout the cytoplasm and the mitochondrial morphology does not appear to be affected. The size bars represent 10 μm

References

    1. Kazamel M, Boes CJ. Charcot Marie Tooth disease (CMT): historical perspectives and evolution. J Neurol. 2015;262:801–805. - PubMed
    1. Juarez P, Palau F. Neural and molecular features on Charcot-Marie-Tooth disease plasticity and therapy. Neural Plast. 2012;2012:171636. - PMC - PubMed
    1. Laura M, Pipis M, Rossor AM, Reilly MM. Charcot-Marie-Tooth disease and related disorders: an evolving landscape. Curr Opin Neurol. 2019;32(5):641–650. - PubMed
    1. Murphy SM, Laura M, Fawcett K, et al. Charcot-Marie-Tooth disease: frequency of genetic subtypes and guidelines for genetic testing. J Neurol Neurosurg Psychiatry. 2012;83:706–710. - PMC - PubMed
    1. Rossor AM, Lu CH, Petzold A, et al. Plasma neurofilament heavy chain is not a useful biomarker in Charcot-Marie-Tooth disease. Muscle Nerve. 2016;53:972–975. - PubMed

Publication types

MeSH terms