. 2020 May;32(3):394-400.
doi: 10.1177/1040638720912406. Epub 2020 Apr 10.

Prediction of seasonal patterns of porcine reproductive and respiratory syndrome virus RNA detection in the U.S. swine industry

Affiliations

Prediction of seasonal patterns of porcine reproductive and respiratory syndrome virus RNA detection in the U.S. swine industry

Giovani Trevisan et al. J Vet Diagn Invest. 2020 May.

Abstract

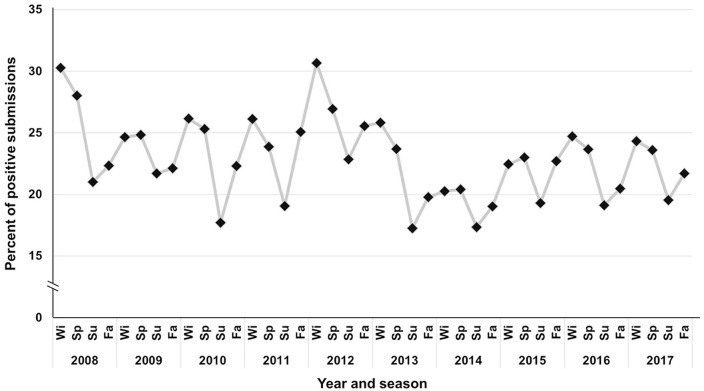
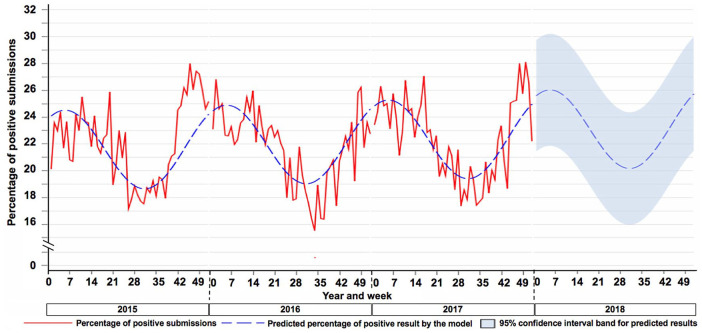
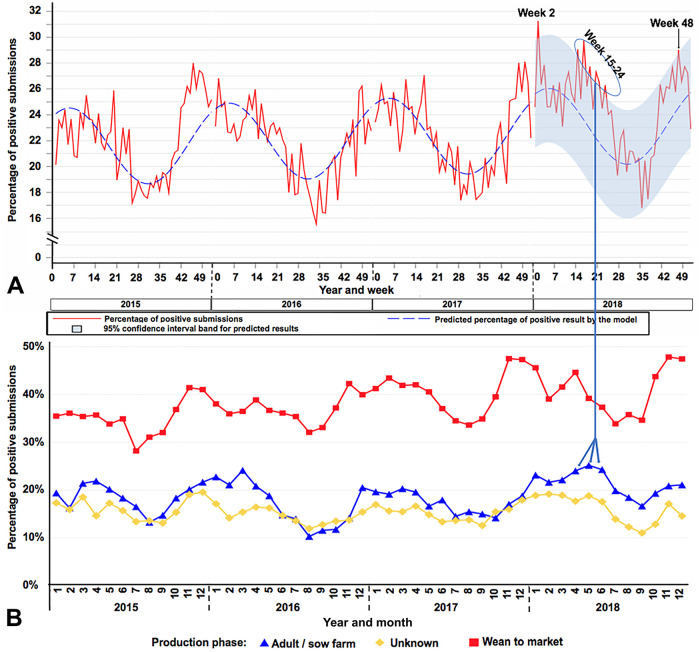
We developed a model to predict the cyclic pattern of porcine reproductive and respiratory syndrome virus (PRRSV) RNA detection by reverse-transcription real-time PCR (RT-rtPCR) from 4 major swine-centric veterinary diagnostic laboratories (VDLs) in the United States and to use historical data to forecast the upcoming year's weekly percentage of positive submissions and issue outbreak signals when the pattern of detection was not as expected. Standardized submission data and test results were used. Historical data (2015-2017) composed of the weekly percentage of PCR-positive submissions were used to fit a cyclic robust regression model. The findings were used to forecast the expected weekly percentage of PCR-positive submissions, with a 95% confidence interval (CI), for 2018. During 2018, the proportion of PRRSV-positive submissions crossed 95% CI boundaries at week 2, 14-25, and 48. The relatively higher detection on week 2 and 48 were mostly from submissions containing samples from wean-to-market pigs, and for week 14-25 originated mostly from samples from adult/sow farms. There was a recurring yearly pattern of detection, wherein an increased proportion of PRRSV RNA detection in submissions originating from wean-to-finish farms was followed by increased detection in samples from adult/sow farms. Results from the model described herein confirm the seasonal cyclic pattern of PRRSV detection using test results consolidated from 4 VDLs. Wave crests occurred consistently during winter, and wave troughs occurred consistently during the summer months. Our model was able to correctly identify statistically significant outbreak signals in PRRSV RNA detection at 3 instances during 2018.

Keywords: PRRSV; cyclic; outbreak signal; prediction; swine pathogens; veterinary diagnostic laboratories.


Conflict of interest statement

Declaration of conflicting interests: The authors declared no potential conflicts of interest with respect to the research, authorship, and/or publication of this article.

Figures

Figure 1.
Figure 1.
Percent of porcine reproductive and respiratory syndrome virus (PRRSV)-positive submissions reported at the Swine Disease Reporting System (SDRS) project over time and apparent seasonal pattern of detection of PRRSV over time. The seasons are organized by months: winter (Wi) = December, January, and February; spring (Sp) = March, April, and May; summer (Su) = June, July, and August; fall (Fa) = September, October, and November. For the SDRS database, a full 4-season cycle starts December 1 and ends November 30 of the subsequent year.
Figure 2.
Figure 2.
Predicted value and 95% confidence interval (CI) for the 2018 forecasted percentage of submissions tested positive for porcine reproductive and respiratory syndrome virus. Dashed blue line = predicted weekly percentage of positive results. Continuous red line = observed percentage of weekly positive submissions for 2015–2017. 2018 blue band = 95% CI for the weekly predicted percentage of positive results.
Figure 3.
Figure 3.
A. Percentage of positive submissions detected during 2018. Inertia ellipses represent outbreaks signals. Arrows point to the production phase results (in panel B) that were associated with the outbreak signal. B. Percentage of positive submissions by production phase over year and month. Each color and marker format represent a different production phase as indicated at the bottom of the chart.

References

    1. Alkhamis MA, et al. Novel approaches for spatial and molecular surveillance of porcine reproductive and respiratory syndrome virus (PRRSv) in the United States. Sci Rep 2017;7:4343. - PMC - PubMed
    1. Dee S, et al. Mechanical transmission of porcine reproductive and respiratory syndrome virus throughout a coordinated sequence of events during warm weather. Can J Vet Res 2003;67:12–19. - PMC - PubMed
    1. Dee S, et al. Mechanical transmission of porcine reproductive and respiratory syndrome virus throughout a coordinated sequence of events during cold weather. Can J Vet Res 2002;66:232–239. - PMC - PubMed
    1. Dórea FC, Vial F. Animal health syndromic surveillance: a systematic literature review of the progress in the last 5 years (2011–2016). Vet Med (Auckl) 2016;7:157–170. - PMC - PubMed
    1. Lopez WA, et al. Porcine reproductive and respiratory syndrome monitoring in breeding herds using processing fluids. J Swine Health Prod 2018;26:146–150.

MeSH terms

LinkOut - more resources