. 2020 Nov;67(11):3125-3133.
doi: 10.1109/TBME.2020.2976924. Epub 2020 Apr 3.

3D Electrophysiological Modeling of Interstitial Fibrosis Networks and Their Role in Ventricular Arrhythmias in Non-Ischemic Cardiomyopathy

3D Electrophysiological Modeling of Interstitial Fibrosis Networks and Their Role in Ventricular Arrhythmias in Non-Ischemic Cardiomyopathy

Gabriel Balaban et al. IEEE Trans Biomed Eng. 2020 Nov.

Abstract

Objective: Interstitial fibrosis is a pathological expansion of the heart's inter-cellular collagen matrix. It is a potential complication of nonischemic cardiomyopathy (NICM), a class of diseases involving electrical and or mechanical dysfunction of cardiac tissue not caused by atherosclerosis. Patients with NICM and interstitial fibrosis often suffer from life threatening arrhythmias, which we aim to simulate in this study.

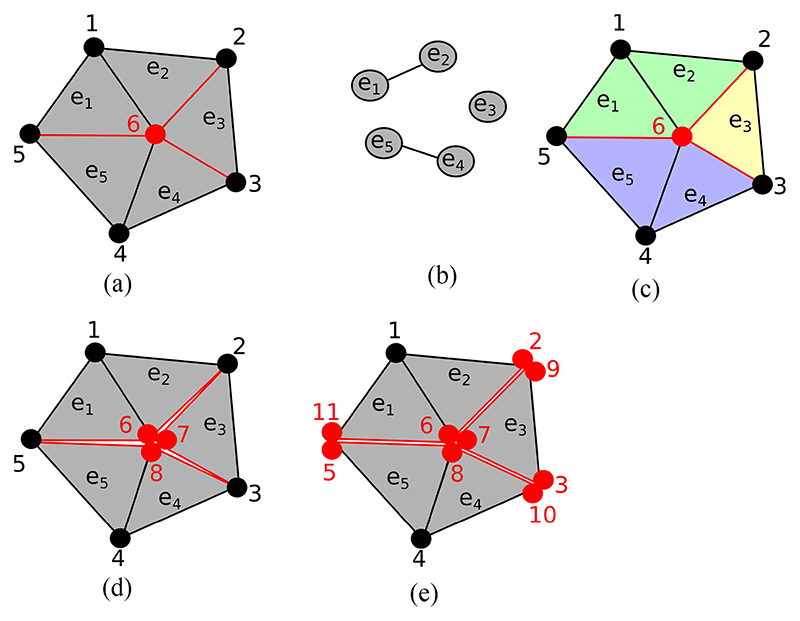
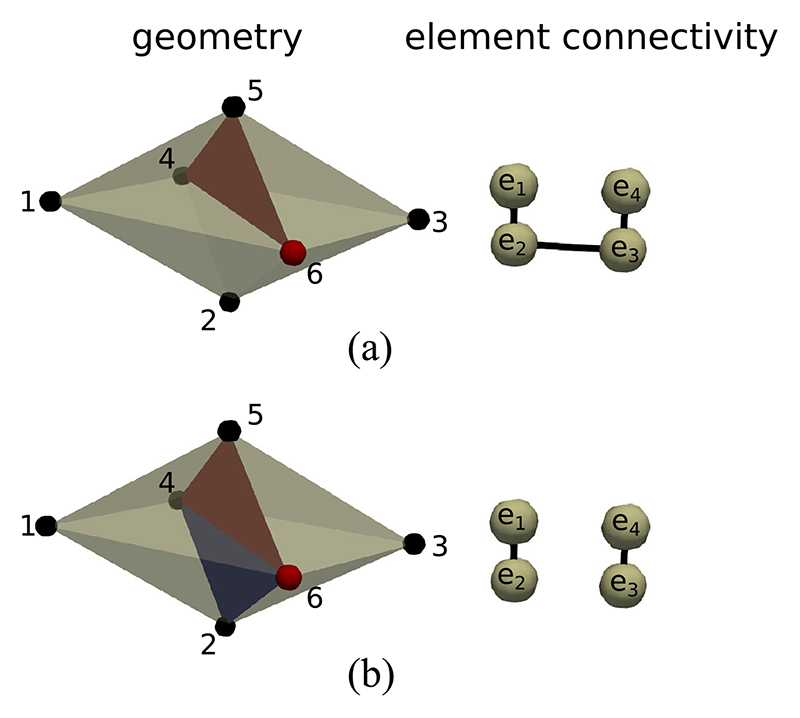
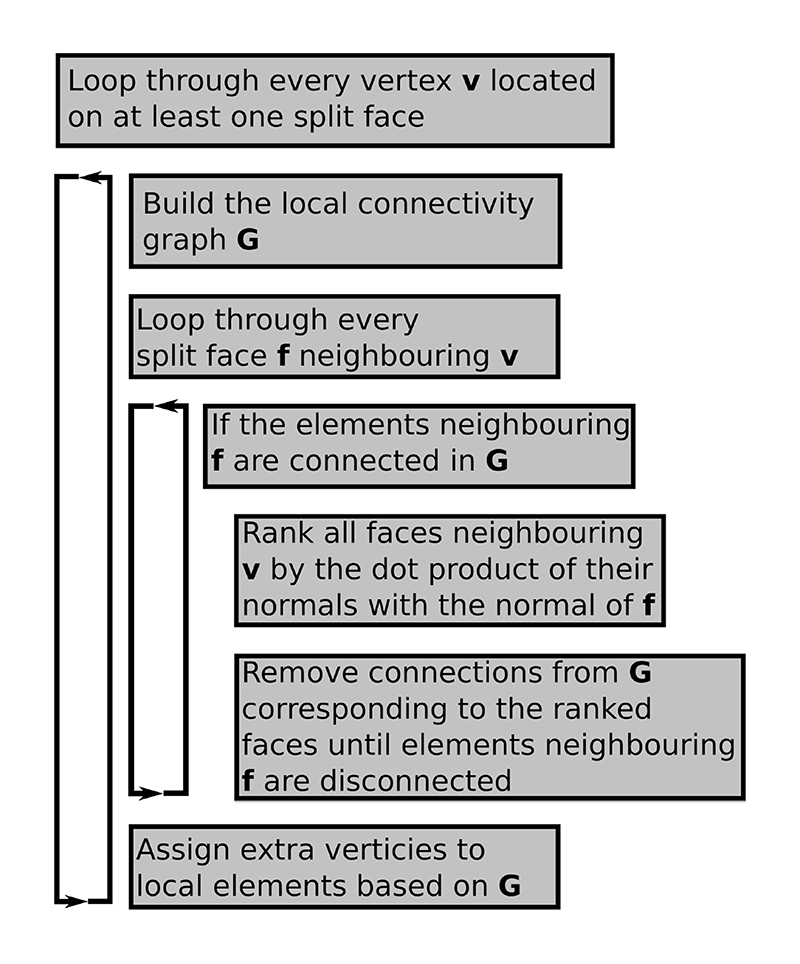
Methods: Our methodology builds on an efficient discrete finite element (DFE) method which allows for the representation of fibrosis as infinitesimal splits in a mesh. We update the DFE method with a local connectivity analysis which creates a consistent topology in the fibrosis network. This is particularly important in nonischemic disease due to the potential presence of large and contiguous fibrotic regions and therefore potentially complex fibrosis networks.

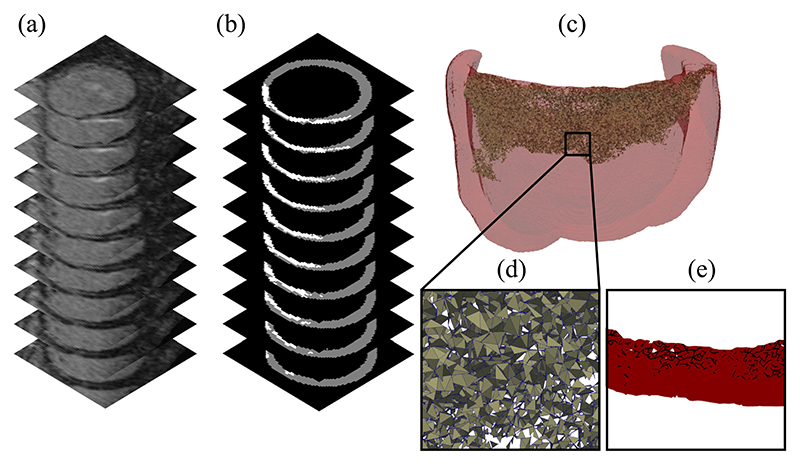
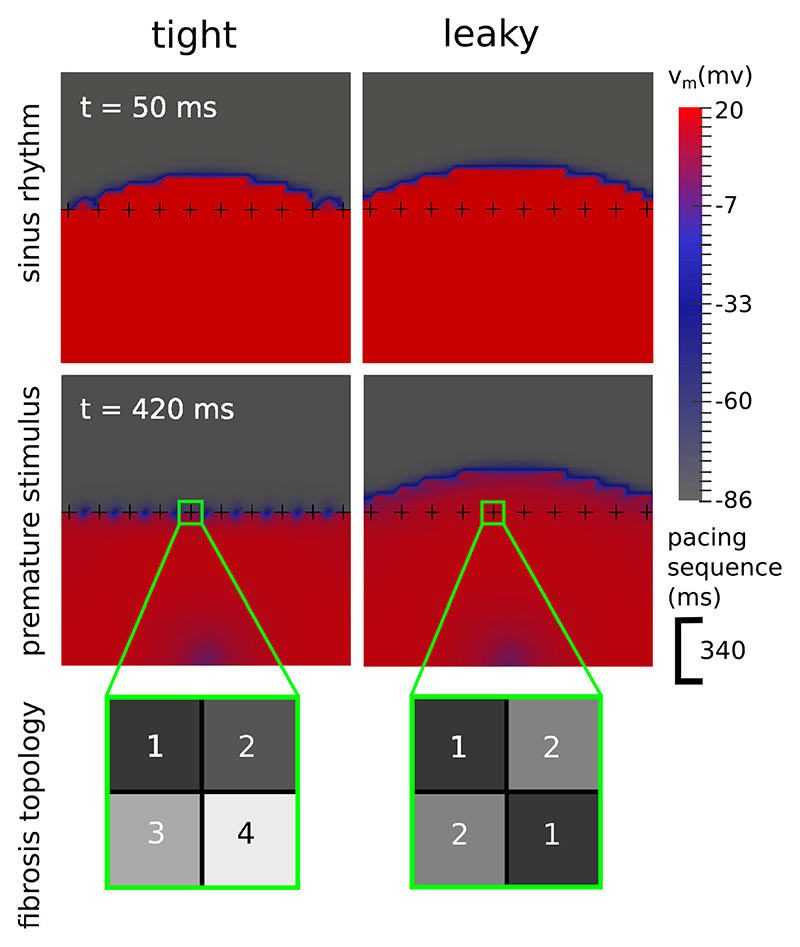
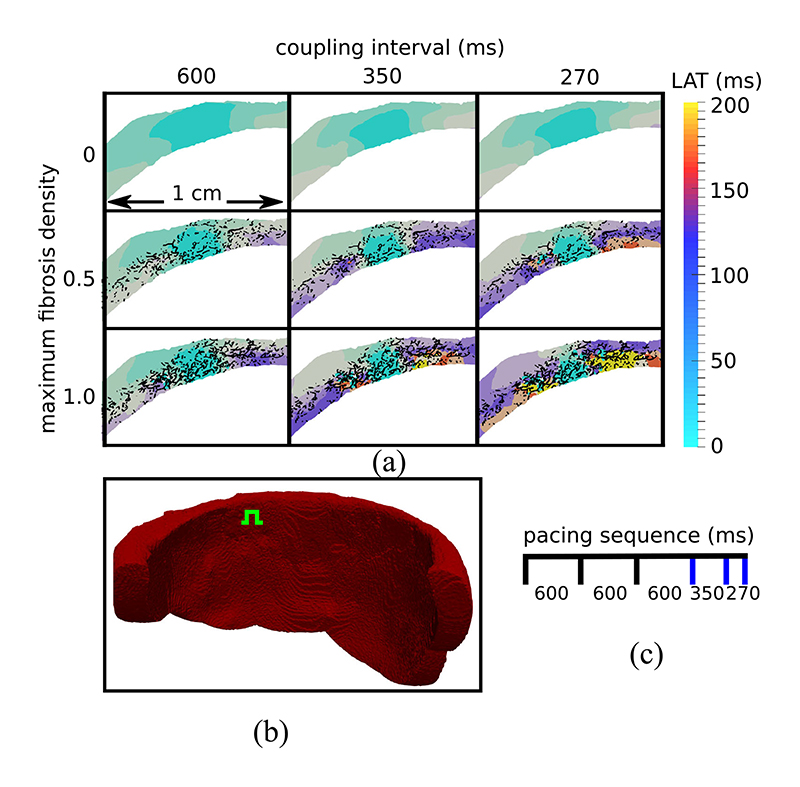
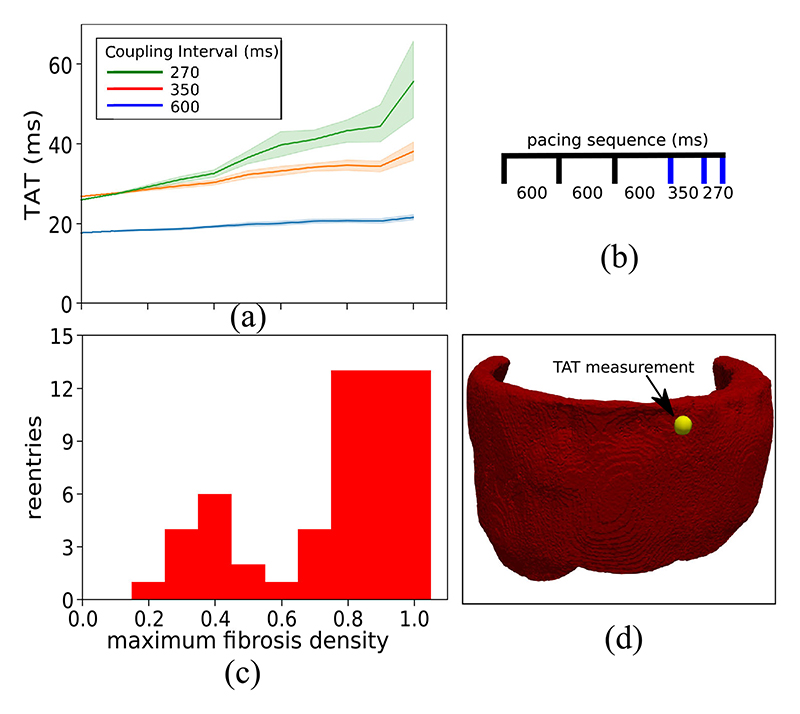
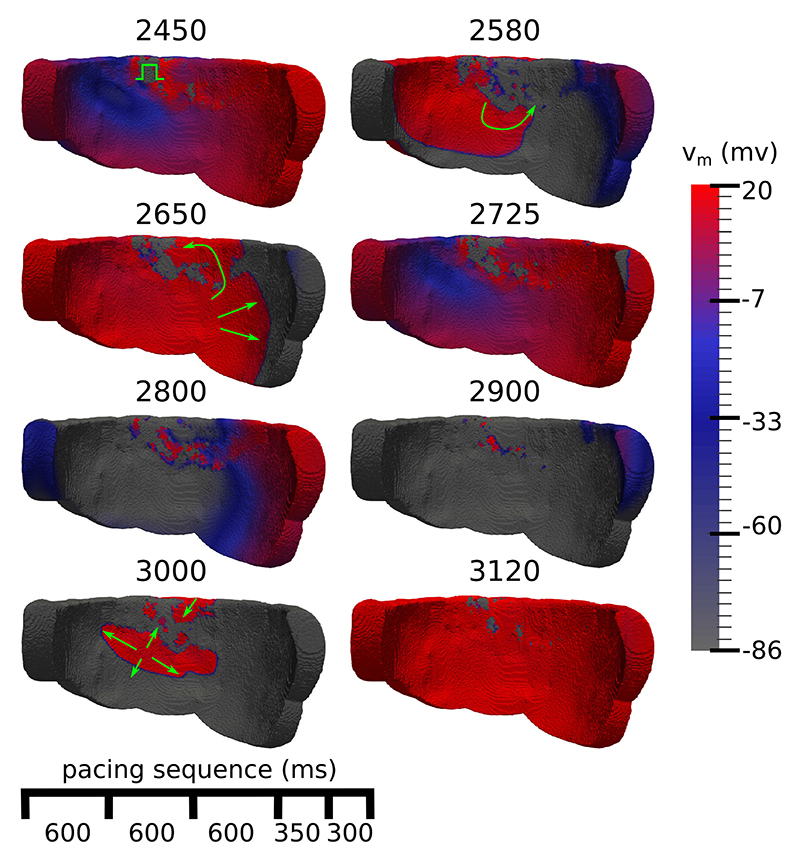
Results: In experiments with an image-based model, we demonstrate that our methodology is able to simulate reentrant electrical events associated with cardiac arrhythmias. These reentries depended crucially upon sufficient fibrosis density, which was marked by conduction slowing at high pacing rates. We also created a 2D test-case which demonstrated that fibrosis topologies can modulate transient conduction block, and thereby reentrant activations.

Conclusion: Ventricular arrhythmias due to interstitial fibrosis in NICM can be efficiently simulated using our methods in medical image based geometries. Furthermore, fibrosis topology modulates transient conduction block, and should be accounted for in electrophysiological simulations with interstitial fibrosis.

Significance: Our study provides methodology which has the potential to predict arrhythmias and to optimize treatments non-invasively for nonischemic cardiomyopathies.


Figures

Fig. 1
Fig. 1
(a) Subsection of an LGE-CMR image stack of a patient left ventricle with a fibrotic zone near the valve plane. (b) Segmentation of the ventricular myocardium (gray) and fibrotic zone (white) (c) Computational mesh of all tissue within 2 cm of the fibrotic zone with split faces highlighted. (d) Close up of the split face network. (e) Projection of a section of the face network onto a plane perpendicular to the tissue walls.
Fig. 2
Fig. 2
An example of local connectivity analysis to create a topologically consistent set of extra vertices. (a) The vertex 6 in the middle of the mesh is visited by the algorithm, with neighboring elements e 1e 5. The edges between e 2e 3, e 3e 4 and e 1e 5 are to be split and are marked in red. (b) The local element connectivity graph. (c) Mesh with elements colored according to their connectivity. (d) Two extra vertices are added (7, 8) and assigned to elements according to the local connectivity. (e) Later iterations of the algorithm visit nodes 2,3,5 and complete the discontinuities along the red edges.
Fig. 3
Fig. 3
Example disconnection of a 3D connectivity graph in a tetrahedralized geometry. (a) The vertex 6 is visited by the algorithm. The split face (4, 5, 6) removes the link between e 1 and e 4. However, e 1 and e 4 are still connected via e 2 and e 3. (b) Face (2, 4, 6) is selected because the dot product of its normal with the normal of face (4,5,6) is minimal among all faces containing vertex 6. Elements e 1 and e 4 can now be isolated into two components e 1e 2 and e 3e 4. In general, several additional faces may be needed to split a 3D connectivity graph.
Fig. 4
Fig. 4. Flowchart of the 3D vertex disconnection algorithm with a modification to the local connectivity in the case that a split face does not disconnect its neighboring elements into separate groups.
Fig. 5
Fig. 5
Transmembrane voltage (vm) maps demonstrating how the topology of a fibrosis network influences the formation of transient block. In the tight topology each fibrotic cross divides the space around it into 4 regions, whereas in the leaky topology the regions are connected diagonally, resulting in only 2 separate regions and the potential for current to leak across the fibrosis. During sinus rhythm (top row) both topologies allow an electrical wave to cross. With a premature stimulus (bottom row), 340 ms after the 1st wave, only the tight topology experiences a transient block.
Fig. 6
Fig. 6
(a) Local activation time (LAT) maps in a transmural tissue slice around the stimulus location. Activation delays are larger with increased fibrosis and decreased coupling interval (Cl). The black lines represent the projection of the 3D split face network onto the LAT map plane. White areas are electrically isolated elements which were removed during preprocessing. (b) Endocardial view of the tissue geometry with the green symbol showing the location of the stimulus site. (c) Timing of stimuli with blue lines indicating stimuli whose activation maps are displayed.
Fig. 7
Fig. 7
The relationship between transmural activation times (TAT) and reentries inducible by simulated programmed electrical stimulation. (a) The mean and 95% confidence region of the TAT values from 15 random fibrosis networks for each level of maximum fibrosis density. (b) Timing of stimuli used to calculate TAT scores. The blue lines indicate stimuli for which TAT was measured. (c) The number of random fibrosis networks for which reentry could be simulated at each density level. (d) Epicardial view of the ventricular geometry with TAT measurement location (yellow sphere).
Fig. 8
Fig. 8
Endocardial view of transmembrane voltage (vm) maps after an extrastimulus that triggers an electrical reentry. The numbers at the top of each voltage map are the simulation time in ms, green arrows highlight directions of activation. 2450) The extrastimulus (green symbol) arrives into a heterogeneous repolarization landscape created by the previous stimuli. 2580, 2650) The extrastimulus spreads unevenly, first activating the tissue to the left and then later to the right. 2725, 2800) Most of the tissue repolarises. 2900) Islands of activated tissue remain in the fibrotic areas. 3000) Reentrant wavefronts emerge out of the fibrosis. 3120) Most of the tissue has been reactivated due to the reentry.
Fig. 9
Fig. 9
Number of mesh nodes, run-time, and Krylov iterations used to calculate the solution of the transmural activation simulations in Section III-B. The lines represent the mean over 15 simulations, whereas the shaded areas represent the 95% confidence region. Measurements in the left panel are relative to the control case, whereas the right panel shows the number of ms run-time per Krylov iteration.

References

    1. Halliday BP, et al. Outcome in dilated cardiomyopathy related to the extent, location, and pattern of late gadolinium enhancement. J Amer College Cardiol-Cardiovascular Imag. 2019;12(8 Part 2):1645–1655. - PMC - PubMed
    1. Wu KC, et al. Late gadolinium enhancement by cardiovascular magnetic resonance heralds an adverse prognosis in nonischemic cardiomyopathy. J Amer College Cardiol. 2008;51(25):2414–2421. - PMC - PubMed
    1. Køber L, et al. Defibrillator implantation in patients with nonischemic systolic heart failure. New England J Medicine. 2016;375(13):1221–1230. - PubMed
    1. Arevalo HJ, et al. Arrhythmia risk stratification of patients after myocardial infarction using personalized heart models. Nat Commun. 2016;7 Art. no. 11437. - PMC - PubMed
    1. Zahid S, et al. Feasibility of using patient-specific models and the minimum cut algorithm to predict optimal ablation targets for left atrial flutter. Heart Rhythm. 2016;13(8):1687–1698. - PMC - PubMed

Publication types