. 2020 Jul 1;176(1):236-252.
doi: 10.1093/toxsci/kfaa048.

A Next-Generation Risk Assessment Case Study for Coumarin in Cosmetic Products

Affiliations

A Next-Generation Risk Assessment Case Study for Coumarin in Cosmetic Products

Maria T Baltazar et al. Toxicol Sci. .

Abstract

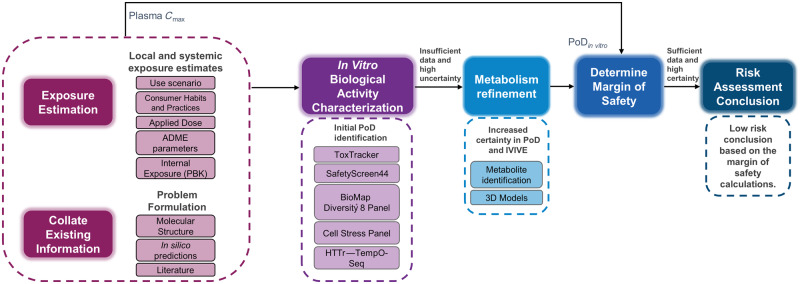
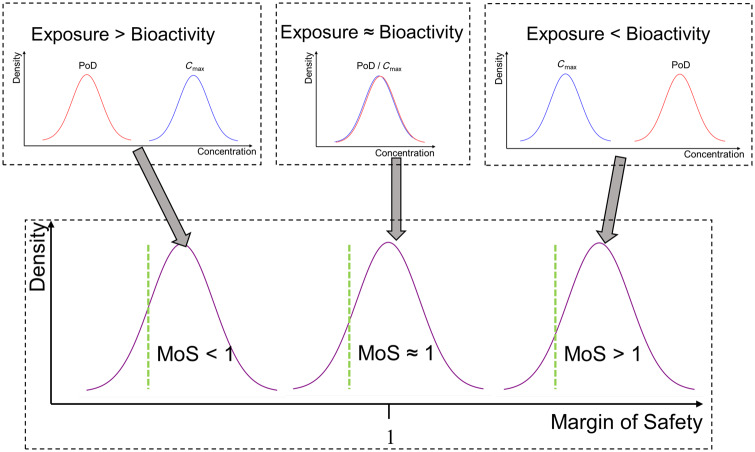
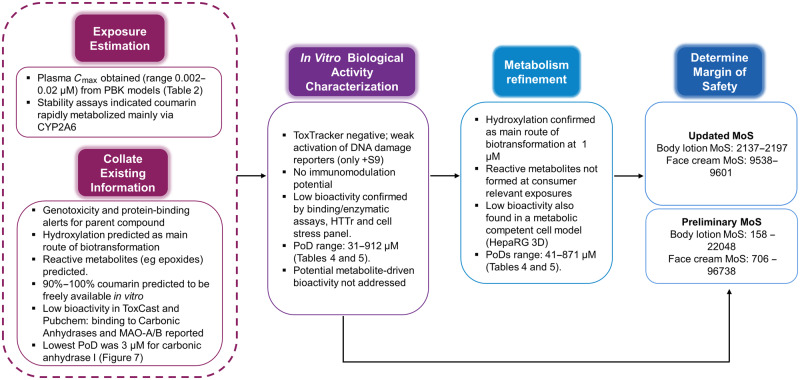
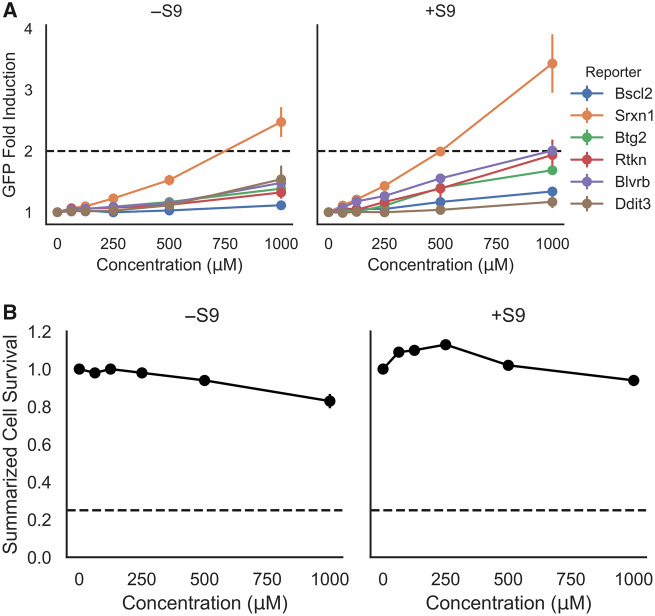
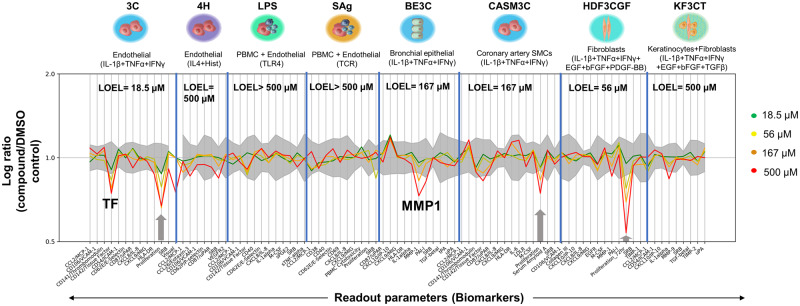
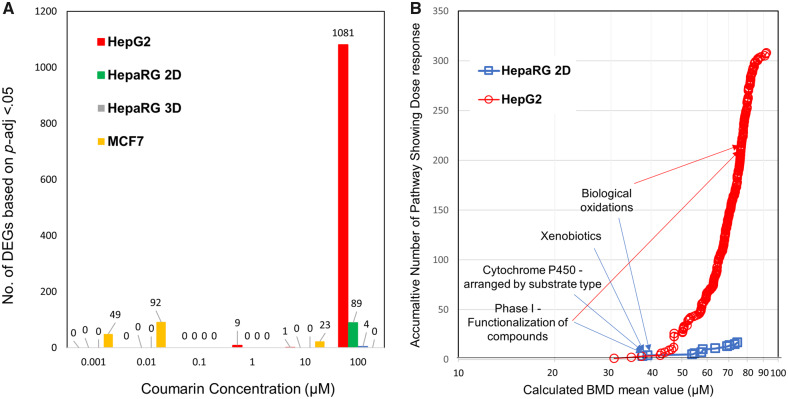
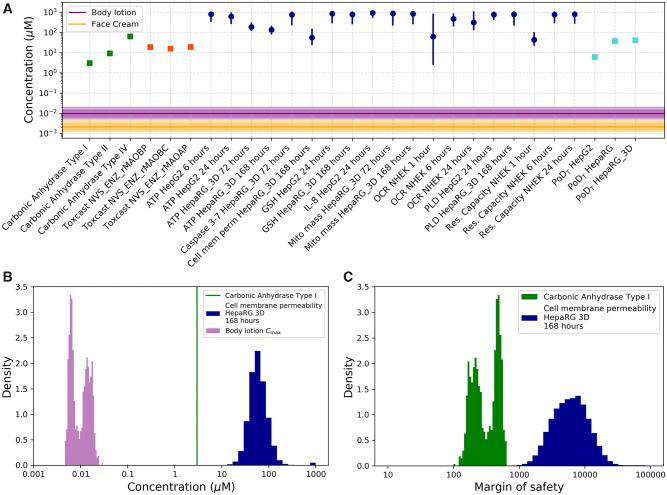
Next-Generation Risk Assessment is defined as an exposure-led, hypothesis-driven risk assessment approach that integrates new approach methodologies (NAMs) to assure safety without the use of animal testing. These principles were applied to a hypothetical safety assessment of 0.1% coumarin in face cream and body lotion. For the purpose of evaluating the use of NAMs, existing animal and human data on coumarin were excluded. Internal concentrations (plasma Cmax) were estimated using a physiologically based kinetic model for dermally applied coumarin. Systemic toxicity was assessed using a battery of in vitro NAMs to identify points of departure (PoDs) for a variety of biological effects such as receptor-mediated and immunomodulatory effects (Eurofins SafetyScreen44 and BioMap Diversity 8 Panel, respectively), and general bioactivity (ToxCast data, an in vitro cell stress panel and high-throughput transcriptomics). In addition, in silico alerts for genotoxicity were followed up with the ToxTracker tool. The PoDs from the in vitro assays were plotted against the calculated in vivo exposure to calculate a margin of safety with associated uncertainty. The predicted Cmax values for face cream and body lotion were lower than all PoDs with margin of safety higher than 100. Furthermore, coumarin was not genotoxic, did not bind to any of the 44 receptors tested and did not show any immunomodulatory effects at consumer-relevant exposures. In conclusion, this case study demonstrated the value of integrating exposure science, computational modeling and in vitro bioactivity data, to reach a safety decision without animal data.

Keywords: Next-Generation Risk Assessment; exposure science; new approach methodologies.


Figures

Figure 1.
Figure 1.
Next-Generation Risk Assessment case study workflow for 0.1% coumarin in consumer products. Initial steps involved collating existing data, generating in silico predictions, and problem formulation. In parallel, applied and systemic consumer exposure estimates were calculated based on the use scenario, habits and practices information, and chemical parameters. A battery of in vitro assays was then conducted to characterize the cellular response to coumarin. From these data, point of departure (PoD) values with associated uncertainties were determined, however, the lack of metabolic capacity of the cell line models used, and the potential toxicity of reactive metabolites led to the generation of additional data (metabolism refinement). All PoDs were compared with exposure estimates (plasma Cmax) to calculate a margin of safety, which was used for the risk assessment decision. Abbreviations: HTTr, high-throughput transcriptomics; IVIVE, in vitro to in vivo extrapolation.
Figure 2.
Figure 2.
C max and points of departure (PoDs) were inferred as probability distributions encompassing the uncertainty in their estimates. The margin of safety (MoS) was defined as the PoD/Cmax ratio. The uncertainty in the Cmax and PoD estimates is propagated through this calculation such that MoS estimate is also a distribution. When the distribution for the PoD is predominantly lower than the distribution for the Cmax (exposure > bioactivity), this produces a distribution for the MoS in which almost all mass is less than 1. Conversely, if the distribution for the PoD was predominantly greater than the Cmax distribution (exposure < bioactivity), almost all the mass of corresponding MoS distribution is greater than 1. When the distributions for the Cmax and PoD strongly overlap (exposure ≈ bioactivity), these results in an MoS distribution centered around 1. The location of the 5th percentile for the MoS is as illustrated on the graph (green line). For this value to be greater than 1 the PoD must, on average, be greater than the Cmax.
Figure 3.
Figure 3.
Summary of the key results from each step on the Next-Generation Risk Assessment case study workflow (see Figure 1) for 0.1% coumarin in face cream and body lotion. Abbreviations: HTTr, high-throughput transcriptomics; MoS, margin of safety; PBK, physiologically based kinetic; PoD, point of departure.
Figure 4.
Figure 4.
A, The ToxTracker toxicity pathway markers Bscl2-GFP and Rtkn-GFP (DNA damage), Btg2-GFP (p53-associated cellular stress), Srxn1-GFP and Blvrb-GFP (oxidative stress), and Ddit-GFP (unfolded protein response) observed by flow cytometry after 24 h exposure to coumarin (0, 62.5, 125, 250, 500, and 1000 μM) in mES cells. A 2-fold green fluorescent protein (GFP) induction level was defined as the threshold for a positive test result, whilst the cell survival rate determined by cell count was always > 25%. Each data point on the graph represents the mean fold induction of 3 independent experiments ± SD. B, Summarized cell survival is expressed as the average across all cell lines and the 3 independent experiments ± SD per concentration. .
Figure 5.
Figure 5.
An overview of coumarin activity in the BioMap panel. There was no cytotoxicity observed at any concentrations tested. Antiproliferation is indicated by a gray arrow. Biomarkers are annotated if: (1) 2 or more consecutive concentrations are changed in the same direction relative to vehicle controls, (2) at least 1 readout is outside of the significance envelope, and (3) at least 1 concentration has an effect size > 20%versus vehicle controls. A lowest observed effect level (LOEL) was defined for each cell system as the lowest concentration at which a biomarker was significantly changed outside of the vehicle envelope and a dose-response was observed.
Figure 6.
Figure 6.
Summary of transcriptomic data analysis. A, Total Differentially Expressed Genes (DEGs) identified for each concentration for each cell line following DESeq2 analysis highlighting limited responses until the highest dose. B, Pathway based Benchmark Dose (BMD) mean accumulation plot. Each data point represents the total number of Reactome pathways that met the significance criteria for both HepG2 (o) and HepaRG (□) cell lines plotted against the corresponding calculated BMD mean value across the range of signaling pathways identified. The curves slope indicates the rate that pathways are showing differential regulation as concentration increases. Labeled are the lowest reported Reactome pathways for each HepaRG and where they correspondingly are identified in the HepG2 accumulation curve.
Figure 7.
Figure 7.
Coumarin’s proposed metabolic pathway based on the in vitro experiments.
Figure 8.
Figure 8.
A, Margin of safety (MoS) plot for face cream (orange band) and body lotion (purple band). Plasma Cmax (total, μM) expressed as distribution, purple or orange line (median, 50th percentile), inner dark band (25–75th percentile), outer light band (2.5th–97.5th percentile [95th credible interval]). Points of departure (PoDs) expressed as nominal concentration (μM) as single values for carbonic anhydrase enzymatic assays (green squares), monoamine oxidases (MAO) enzymatic assays (red squares), and transcriptional point of departure (PoDT) from high-throughput transcriptomics assays (light blue squares). PoDs from cell stress panel (dark blue circles) are reported in terms of the mode (circle) and the 95% credibility interval (solid lines). B, Histogram representations of the distribution for the predicted Cmax (purple), example PoD distribution from the stress panel (blue) and PoD summarized as point-estimate from PubChem (green). C, Distributions for the MoS calculated using both examples. Abbreviations: NHEK, normal human epidermal keratinocytes; OCR, oxygen consumption rate.

References

    1. Abraham K., Wohrlin F., Lindtner O., Heinemeyer G., Lampen A. (2010). Toxicology and risk assessment of coumarin: Focus on human data. Mol. Nutr. Food Res. 54, 228–239. - PubMed
    1. Adeleye Y., Andersen M., Clewell R., Davies M., Dent M., Edwards S., Fowler P., Malcomber S., Nicol B., Scott A., et al. (2015). Implementing toxicity testing in the 21st century (TT21C): Making safety decisions using toxicity pathways, and progress in a prototype risk assessment. Toxicology 332, 102–111. - PubMed
    1. Albrecht W., Kappenberg F., Brecklinghaus T., Stoeber R., Marchan R., Zhang M., Ebbert K., Kirschner H., Grinberg M., Leist M., et al. (2019). Prediction of human drug-induced liver injury (DILI) in relation to oral doses and blood concentrations. Arch. Toxicol. 93, 1609–1637. - PubMed
    1. Allen T. E. H., Goodman J. M., Gutsell S., Russell P. J. (2018). Using 2D structural alerts to define chemical categories for molecular initiating events. Toxicol. Sci. 165, 213–223. - PubMed
    1. Andersen M., McMullen P., Phillips M., Yoon M., Pendse S., Clewell H., Hartman J., Moreau M., Becker R., Clewell R. (2019). Developing context appropriate toxicity testing approaches using new alternative methods (NAMs). ALTEX 36, 523–534. - PubMed

Publication types