. 2020 Jun 1:339:108701.
doi: 10.1016/j.jneumeth.2020.108701. Epub 2020 Apr 8.

Deep residual learning for neuroimaging: An application to predict progression to Alzheimer's disease

Affiliations

Deep residual learning for neuroimaging: An application to predict progression to Alzheimer's disease

Anees Abrol et al. J Neurosci Methods. .

Abstract

Background: The unparalleled performance of deep learning approaches in generic image processing has motivated its extension to neuroimaging data. These approaches learn abstract neuroanatomical and functional brain alterations that could enable exceptional performance in classification of brain disorders, predicting disease progression, and localizing brain abnormalities.

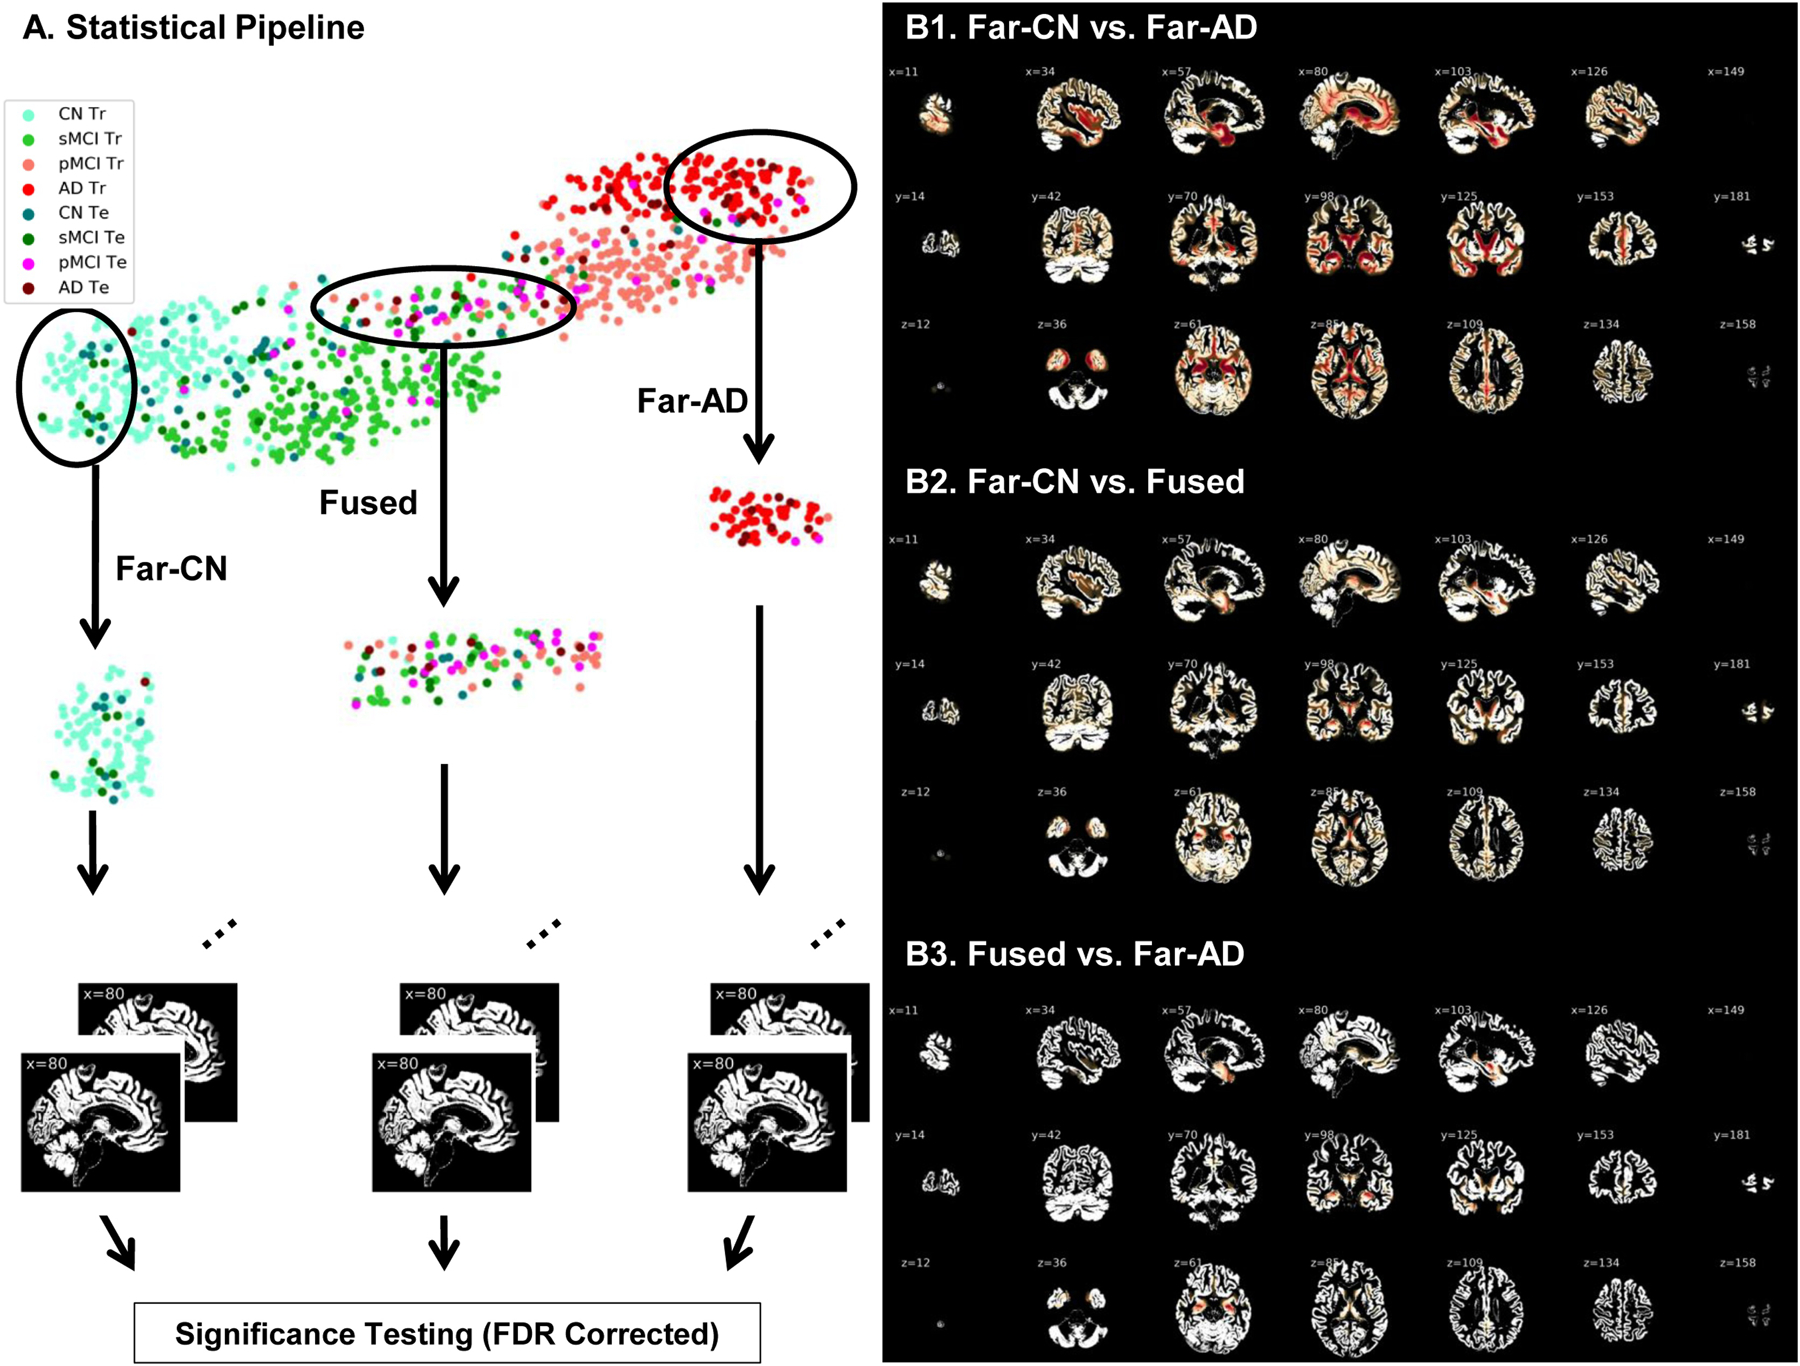
New method: This work investigates the suitability of a modified form of deep residual neural networks (ResNet) for studying neuroimaging data in the specific application of predicting progression from mild cognitive impairment (MCI) to Alzheimer's disease (AD). Prediction was conducted first by training the deep models using MCI individuals only, followed by a domain transfer learning version that additionally trained on AD and controls. We also demonstrate a network occlusion based method to localize abnormalities.

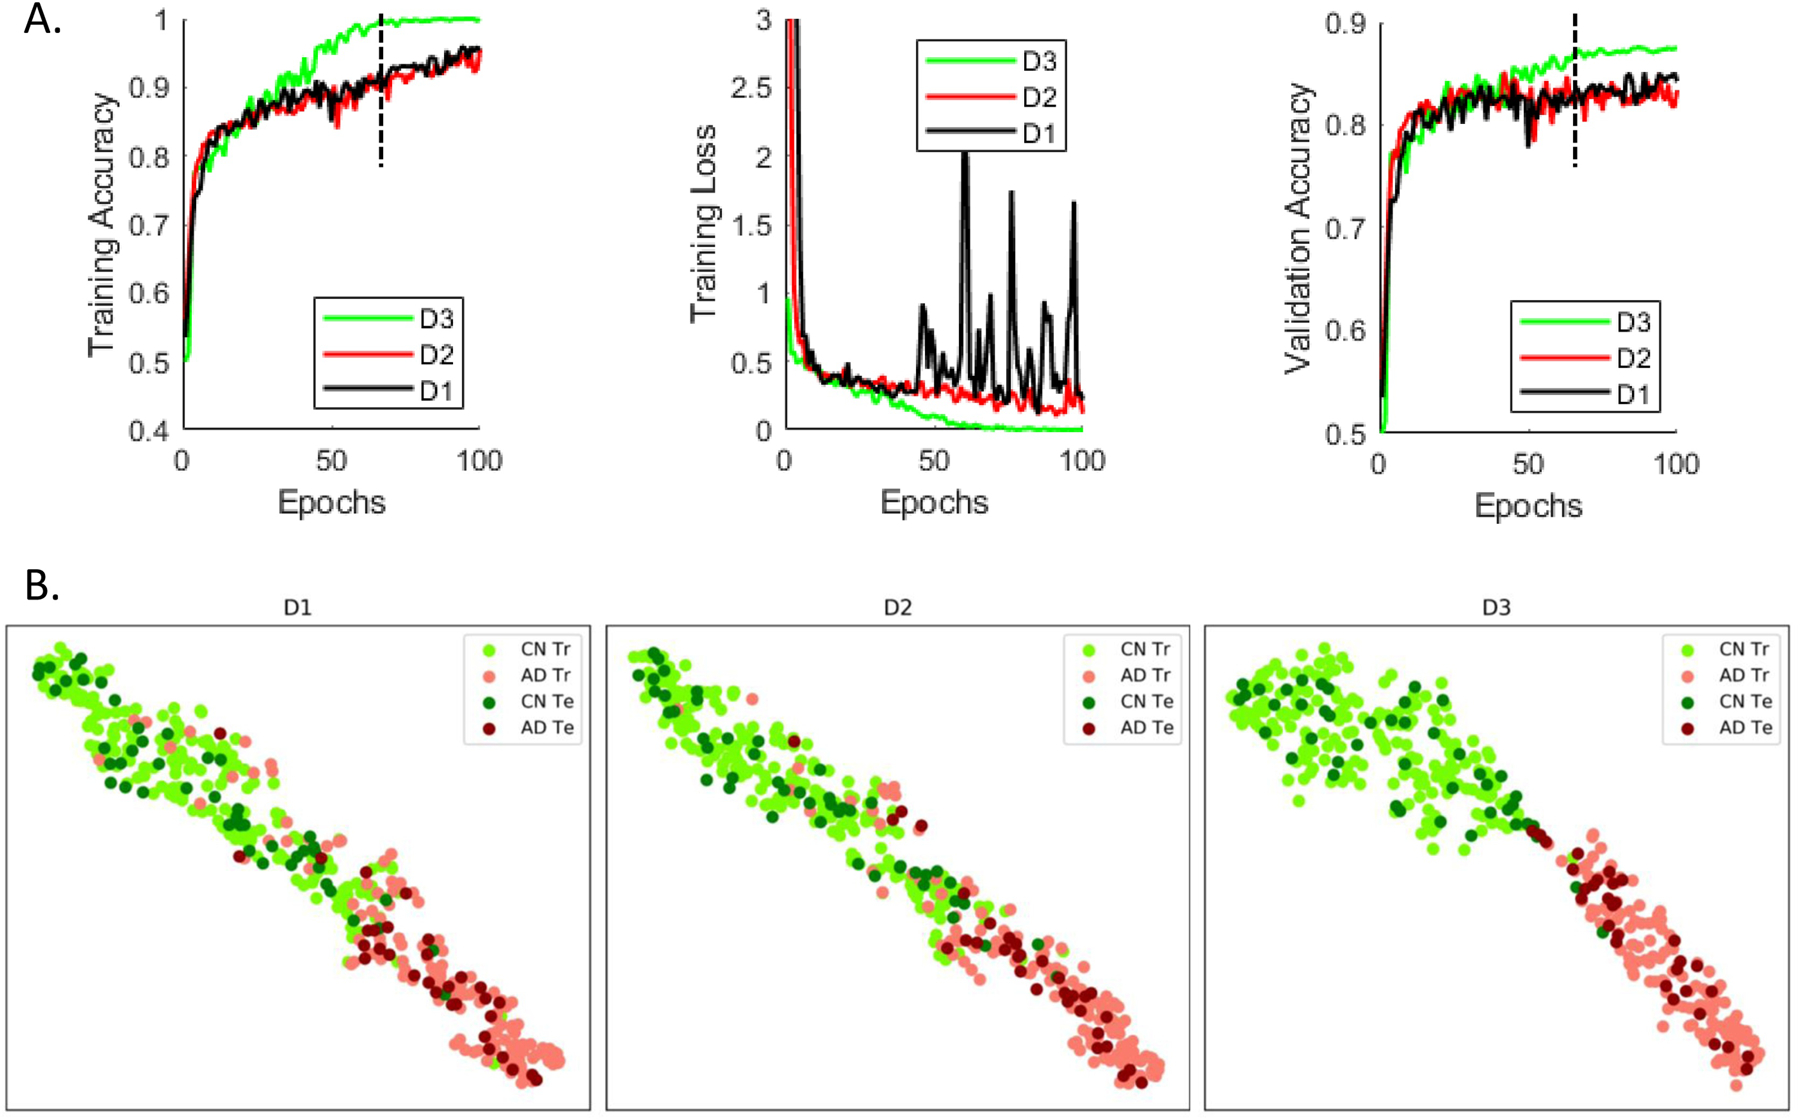
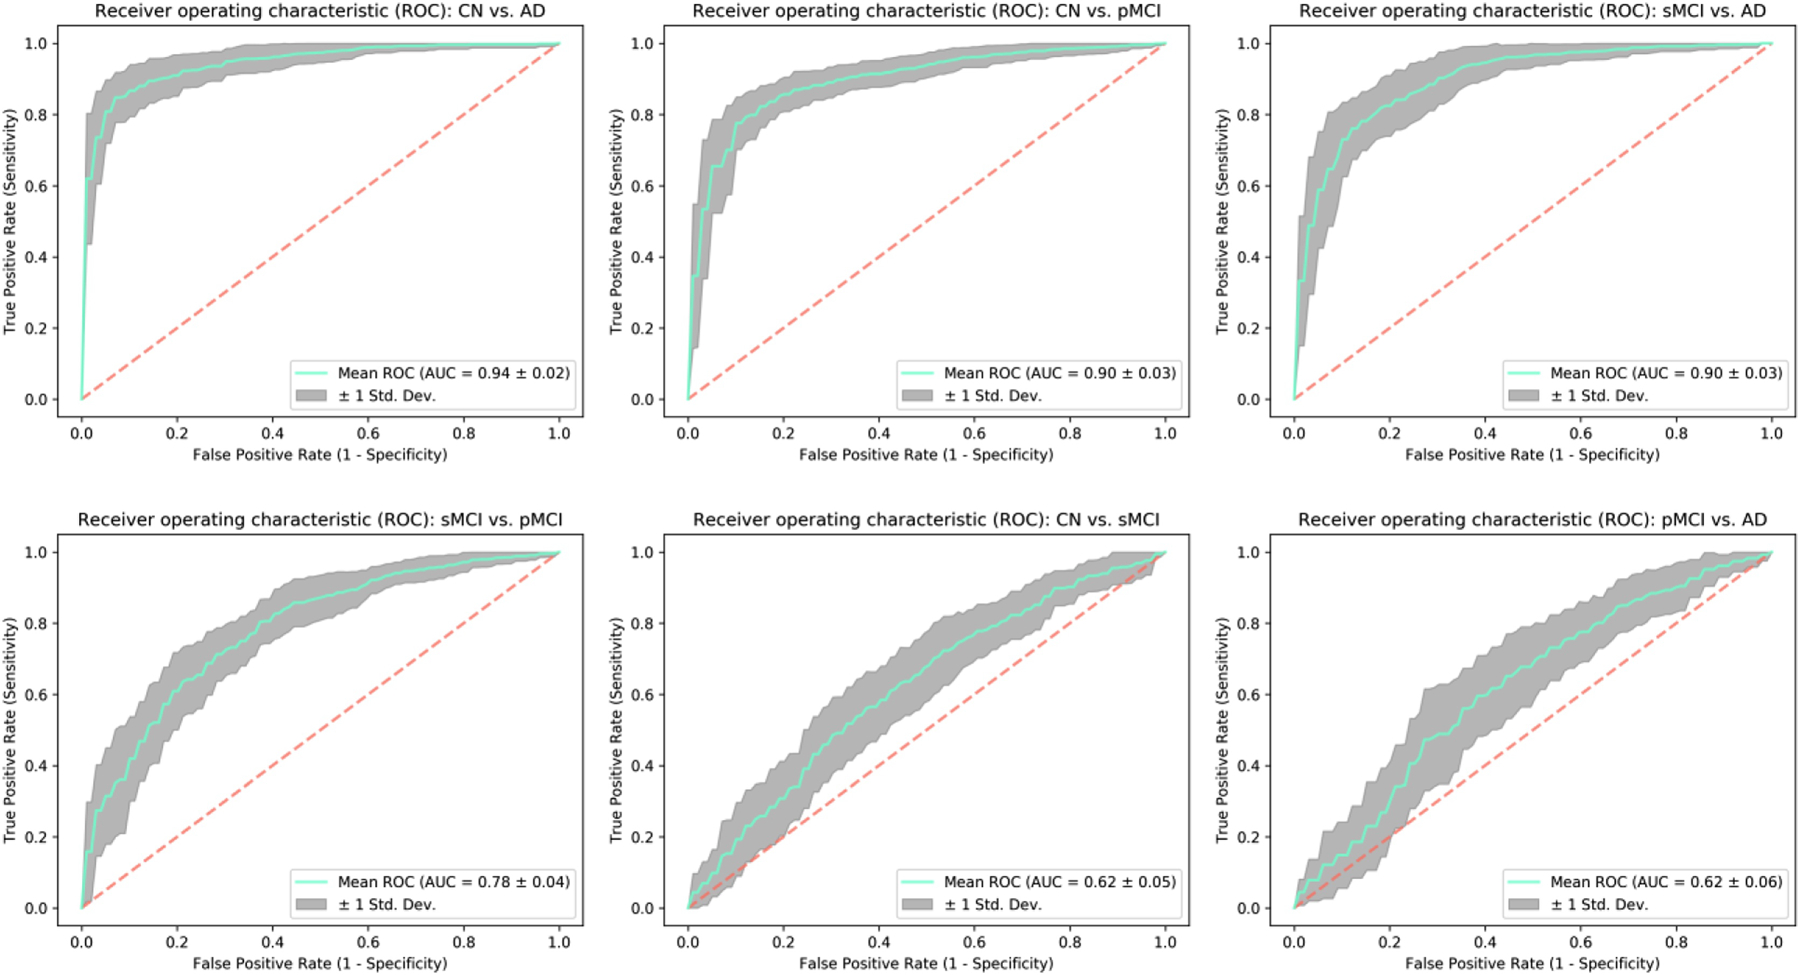
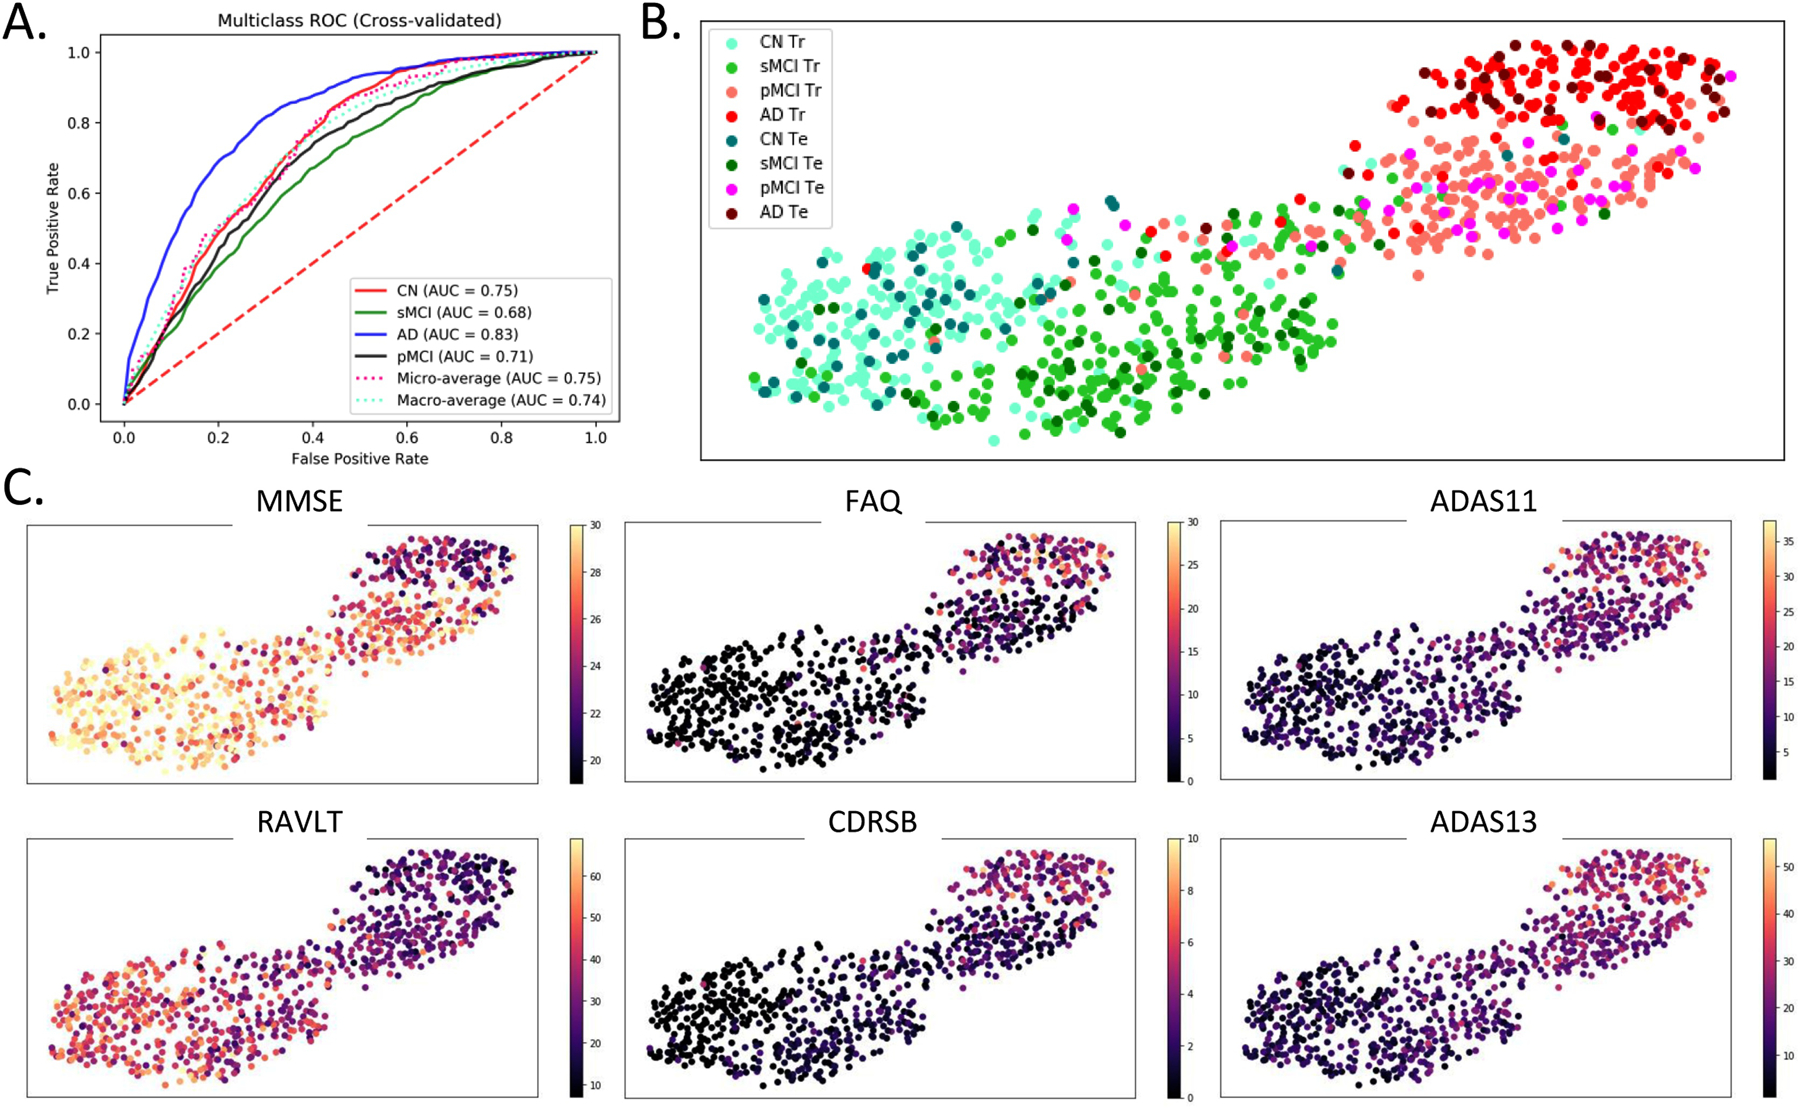
Results: The implemented framework captured non-linear features that successfully predicted AD progression and also conformed to the spectrum of various clinical scores. In a repeated cross-validated setup, the learnt predictive models showed highly similar peak activations that corresponded to previous AD reports.

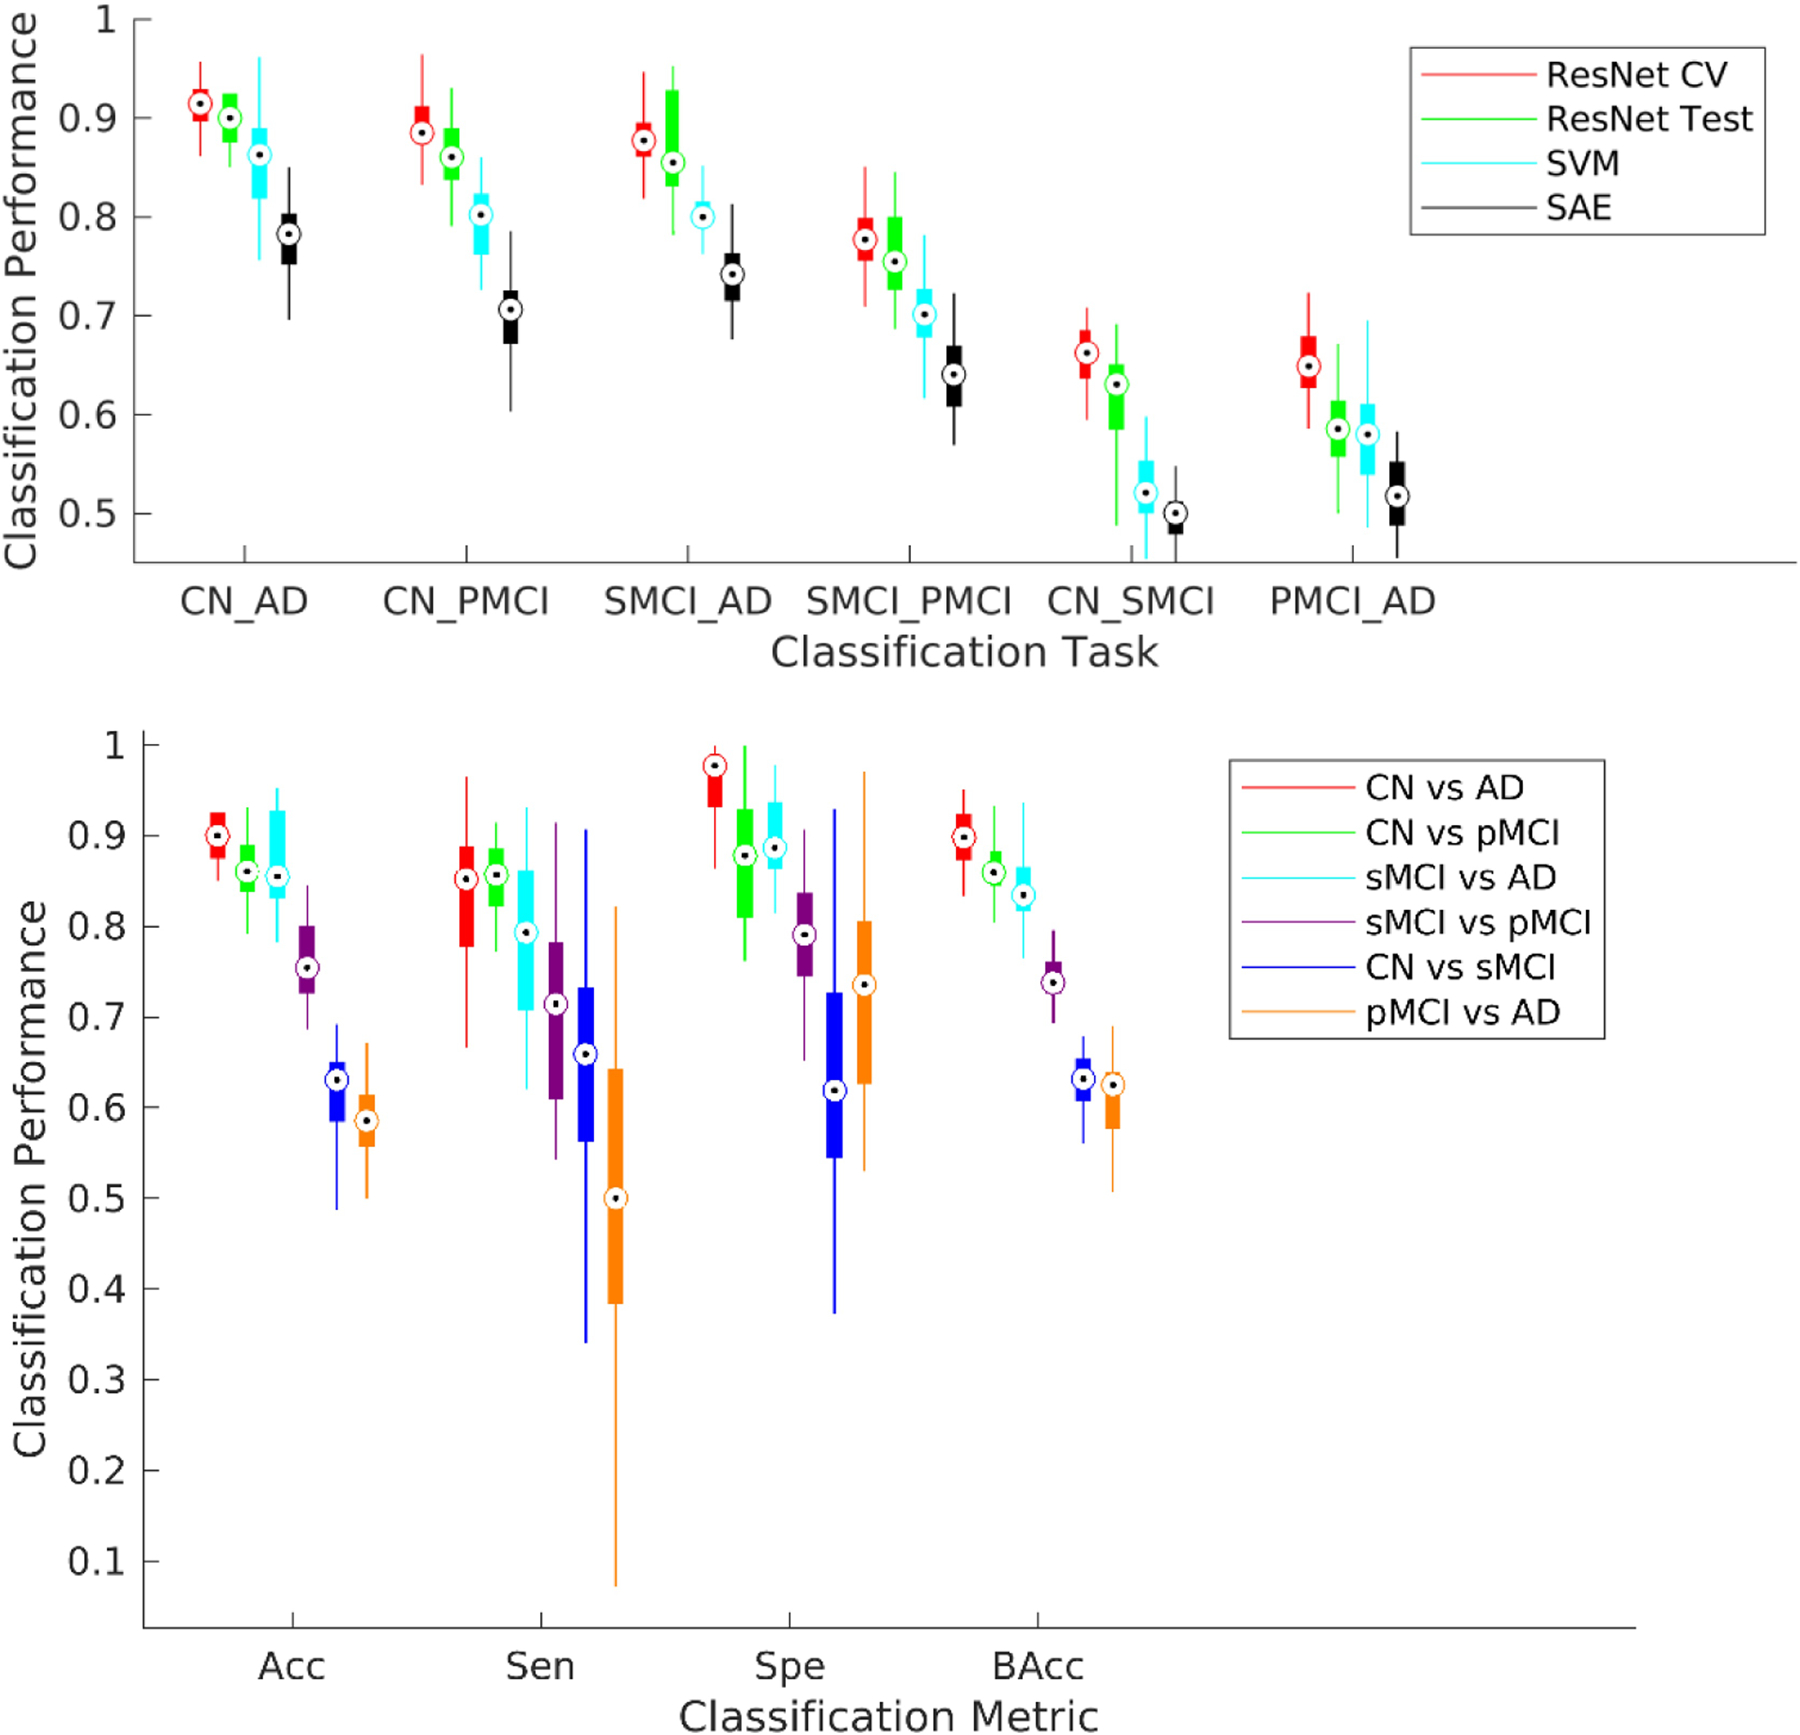
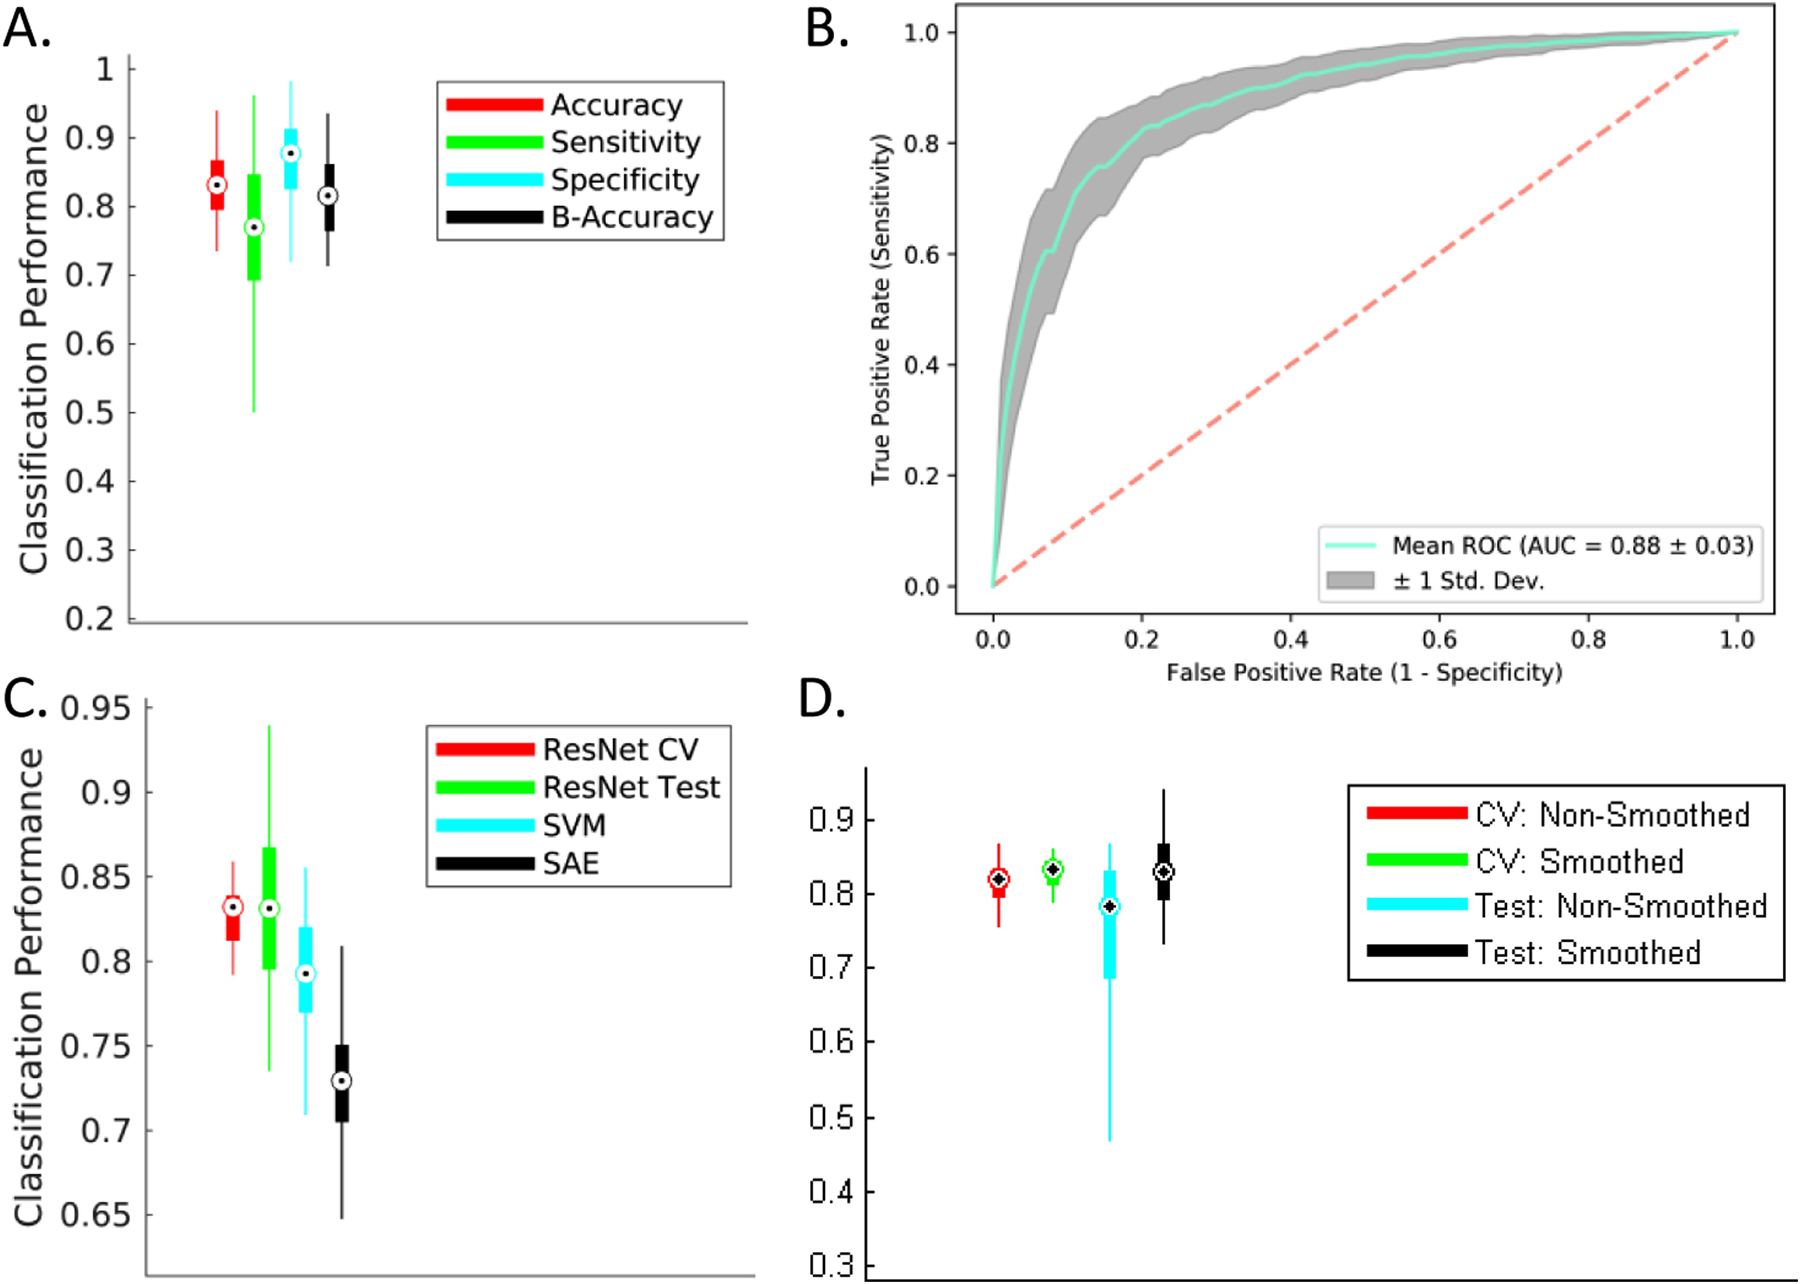
Comparison with existing methods: The implemented architecture achieved a significant performance improvement over the classical support vector machine and the stacked autoencoder frameworks (p < 0.005), numerically better than state-of-the-art performance using sMRI data alone (> 7% than the second-best performing method) and within 1% of the state-of-the-art performance considering learning using multiple neuroimaging modalities as well.

Conclusions: The explored frameworks reflected the high potential of deep learning architectures in learning subtle predictive features and utility in critical applications such as predicting and understanding disease progression.

Keywords: Alzheimer's disease; Deep learning; MCI to AD progression; Residual neural networks.


Conflict of interest statement

Declaration of Competing Interest None.

Figures

Figure 1:
Figure 1:
A comparison of data demographics and average clinical scores for the studied classes. This study included all subjects in the ADNI repository that passed the minimum selection criterion (minimum follow-up time, conversion or reversion rules) and pre-processing qualitative analysis. Only the baseline scan for each subject was used for all analyses in this study. Clinical scores for diagnosis: MMSE: Mini-Mental State Exam; FAQ: Functional Activities Questionnaire; CDRSB: Clinical Dementia Rating Sum of Boxes; ADAS: Alzheimer’s Disease Assessment Scale; RAVLT: Rey Auditory Verbal Learning Test.
Figure 2:
Figure 2:
A deep residual neural network learning framework is composed of multiple residual blocks that are small stacks of convolutional and batch normalization layers followed by non-linear activation functions such as rectified linear units. In this study, as suggested by the data (Figure 3), we use a model with three residual layers for evaluating diagnostic classification performance and progression to AD.
Figure 3:
Figure 3:
(A) Repeated (n=10) stratified k-fold (k = 5) cross-validation was performed on the pooled cognitively normal (CN) and Alzheimer’s Disease (AD) classes to study the effect of adding depth (i.e. adding further convolutional layers or residual blocks) in the implemented framework. Significant improvement in validation accuracy was reported by a model that used 3 residual blocks (D3: depth = 3) as compared to a model that used 2 residual blocks (D2: depth = 2; p = 1.6996e-07) and a model that used 1 residual block (D1: depth = 1; p = 4.5633e-13). Adding another residual block (i.e. depth = 4) did not result in a significant improvement in performance; hence, we’ve settled on the D3 model and validated it in the several classification/prediction tasks for a consistent comparison. For this specific analysis, all models were run for 100 epochs and used the same training and test datasets in each of the cross-validation folds for consistency in performance comparison. (B) The feature spaces at output of the first fully connected layer in the three surrogate models (for a sample cross-validation fold at the epoch demonstrated by the vertical black line in Figure 3A) were projected onto a two-dimensional space demonstrate additional separation enabled by addition of residual blocks in the ‘D3’ model as compared to the ‘D2’ and ‘D1’ models. The ‘Tr’ abbreviation corresponds to the training samples whereas ‘Te’ corresponds to the samples used to test the learnt model.
Figure 4:
Figure 4:
Six possible binary diagnostic and prognostic classification tasks from the four studied classes were considered. A repeated (n = 10), stratified 5-fold cross-validation procedure was conducted for each of these classification tasks. The ResNet framework was trained independently for each classification task for a maximum of 100 epochs but with an early stopping with a patience level of 20 epochs (20% of the set maximum number of epochs) to prevent overtraining the validation models. (Top) The performance of the ResNet framework performed significantly better (p < 0.005) than the linear support vector machine (SVM) and stacked auto-encoder (SAE) methods for all binary tasks. (Bottom) Each boxplot shows a spread of the specific reported metric (accuracy, sensitivity, specificity or balanced accuracy) over the 50 cross-validation folds. The first four classification tasks in specific order as in the legend (CN vs. AD, CN vs. pMCI, sMCI vs. AD, and sMCI vs. pMCI) could be considered more clinically relevant and reported a cross-validated mean validation accuracy of 91.0%, 89.3%, 88.1% and 77.8% respectively, and mean test accuracy of 89.3%, 86.5%, 87.5% and 75.1% respectively.
Figure 5:
Figure 5:
Receiver operating characteristic (ROC) curves were estimated for each of the classification tasks to evaluate the diagnostic ability of the trained ResNet framework further. As expected, the reported area under the curve (AUC) metric follows a similar trend as in Figure 4 thus further adding evidence to the superior performance of the tested architecture for the undertaken analysis.
Figure 6:
Figure 6:
Mixed-Class Prognosis Classification. A modified form of repeated (n = 10), stratified 5-fold cross-validation procedure was conducted to evaluate the separability of the two MCI sub-classes. Hypothesizing an improvement with an increase in amount of training data provided by other classes (analogous to domain transfer learning), the learner was trained with all datasets from the CN and AD classes (or domains) in addition to the cross validation-fold-respective training sMCI/pMCI datasets followed by testing on the cross validation-fold-respective testing sMCI/pMCI datasets. (A) and (B) A significant improvement for all studied classification metrics (6% in accuracy, 7% in sensitivity, 5% in specificity and 7% in AUC) was observed for this mixed-class classification task as compared to the standard inter-MCI class classification task (i.e. sMCI vs. pMCI classification task as shown in Figure 4 and bottom left panel in Figure 5). (C) The mixed-class classification task reported a significant performance improvement (p < 0.005) over the classical SVM and SAE methods. (D) The cross-validated validation and test accuracies estimated from the smoothed gray matter maps showed significant improvement (p < 0.05) over the corresponding values estimated from the non-smoothed gray matter maps.
Figure 7:
Figure 7:
Multi-class ROC and Classification Projection Analysis. (A) For the multi-class classification, ROC analysis for each class was performed by comparing observations from that class to all other classes (i.e. one vs all comparison). Additionally, micro-averaged and macro-averaged ROC estimates were computed to find singular performance metrics for multi-class classification. Higher AUC was reported by the AD and CN classes followed by the micro-averaged and macro-average cases, while both MCI classes reported a lower AUC. (B) and (C) A feature projection analysis was conducted to confirm the appropriateness of the learning directionality in the multi-class classification task. In this analysis, the features at the output of the first fully-connected layer in a sample surrogate multi-class model were projected onto a two-dimensional space using the tSNE algorithm. Barring few outliers, the projections of the observations are appropriately ordered by disease severity in terms of the diagnostic label (panel B) and clinical scores (panel C). In panel B, the ‘Tr’ abbreviation in the figure legend corresponds to the training samples whereas ‘Te’ corresponds to the test samples. In panel C, the following clinical scores were used: - MMSE: Mini-Mental State Exam, FAQ: Functional Activities Questionnaire, CDRSB: Clinical Dementia Rating Sum of Boxes, ADAS: Alzheimer’s Disease Assessment Scale, and RAVLT: Rey Auditory Verbal Learning Test.
Figure 8:
Figure 8:
(A) Two-dimensional projections of the 512-dimensional features at the output of the fully connected layer in the ResNet model. Two homogenous groups (far-CN and far-AD) and a heterogeneous group (fused) were sampled and evaluated for significant differences in the input (preprocessed gray matter) space. Voxels showing significant differences post FDR correction (p < 0.05) are highlighted in panels B1, B2 and B3. While these differences can be seen clearly for the comparison of the two homogeneous groups in panel B1, the subjects close to the boundaries separating the modes showed lower significant differences as compared to both homogenous groups (panels B2 and B3).
Figure 9:
Figure 9:
(A) Sagittal, coronal and axial slices of whole brain relevance maps as highlighted by the network occlusion approach in correspondence to the AAL brain atlas networks. (B) Quantitative (cross-validated) assessment of the relevance of the brain regions in classification/prediction decisions to study AD progression. This latter assessment factored in the brain network areas for relevance estimation.

References

    1. Abrol A, Damaraju E, et al. 2017. “Replicability of Time-Varying Connectivity Patterns in Large Resting State FMRI Samples.” NeuroImage 163. - PMC - PubMed
    1. Abrol A, Rashid B, et al. 2017. “Schizophrenia Shows Disrupted Links between Brain Volume and Dynamic Functional Connectivity.” Frontiers in Neuroscience 11(NOV). - PMC - PubMed
    1. Abrol A, Chaze C, Damaraju E, and Calhoun VD. 2016. “The Chronnectome: Evaluating Replicability of Dynamic Connectivity Patterns in 7500 Resting FMRI Datasets.” In Proceedings of the Annual International Conference of the IEEE Engineering in Medicine and Biology Society, EMBS. - PubMed
    1. “ADNI MRI Protocols.” 2017. http://adni.loni.usc.edu/methods/documents/mri-protocols (July 20, 2005).
    1. Aggleton John P., Pralus Agathe, Andrew J.D. Nelson, and Michael Hornberger. 2016. “Thalamic Pathology and Memory Loss in Early Alzheimer’s Disease: Moving the Focus from the Medial Temporal Lobe to Papez Circuit.” Brain 139(7): 1877–90. - PMC - PubMed

Publication types