Gamma oscillations weaken with age in healthy elderly in human EEG
- PMID: 32276055
- PMCID: PMC7299665
- DOI: 10.1016/j.neuroimage.2020.116826
Gamma oscillations weaken with age in healthy elderly in human EEG
Abstract
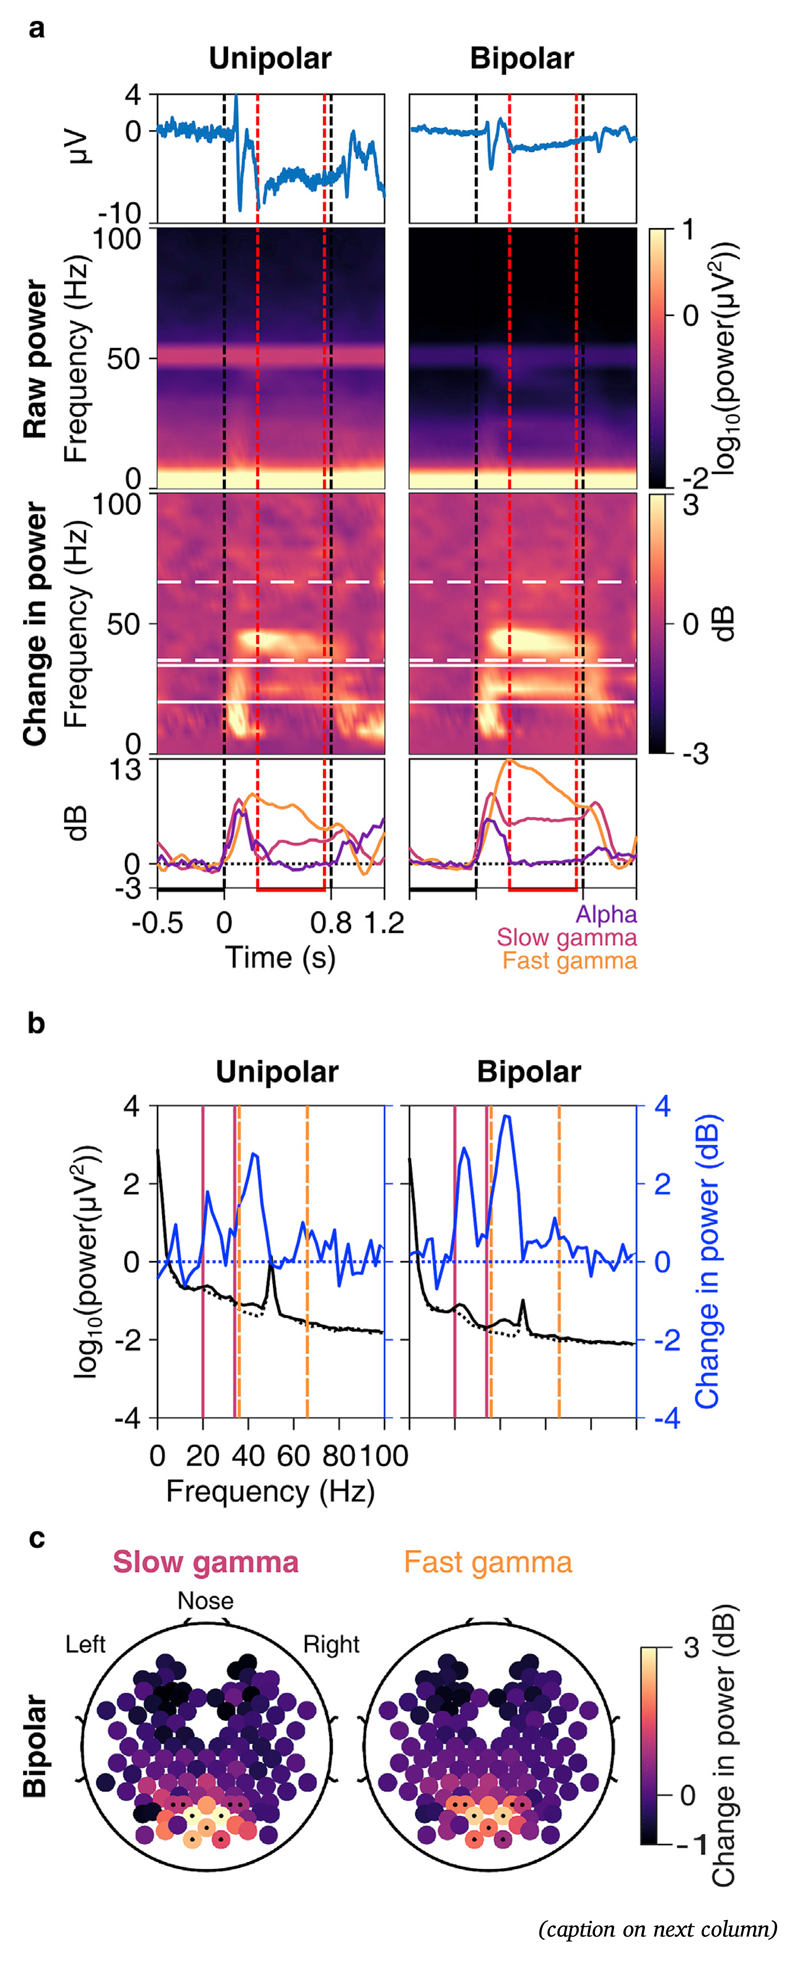
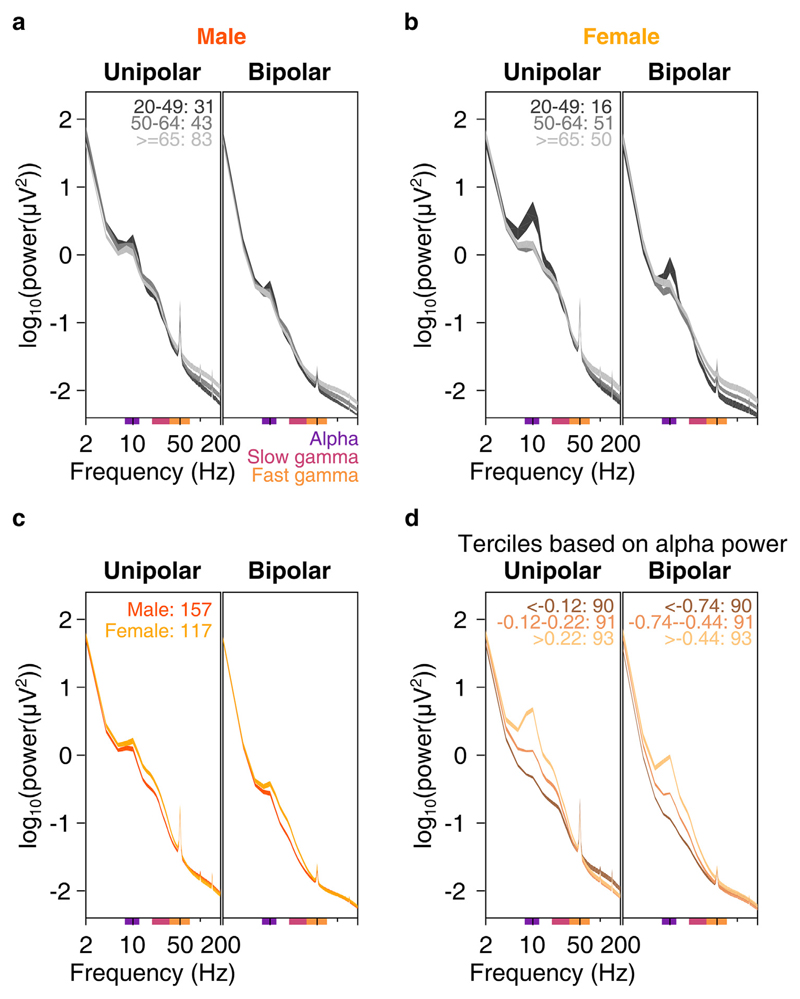
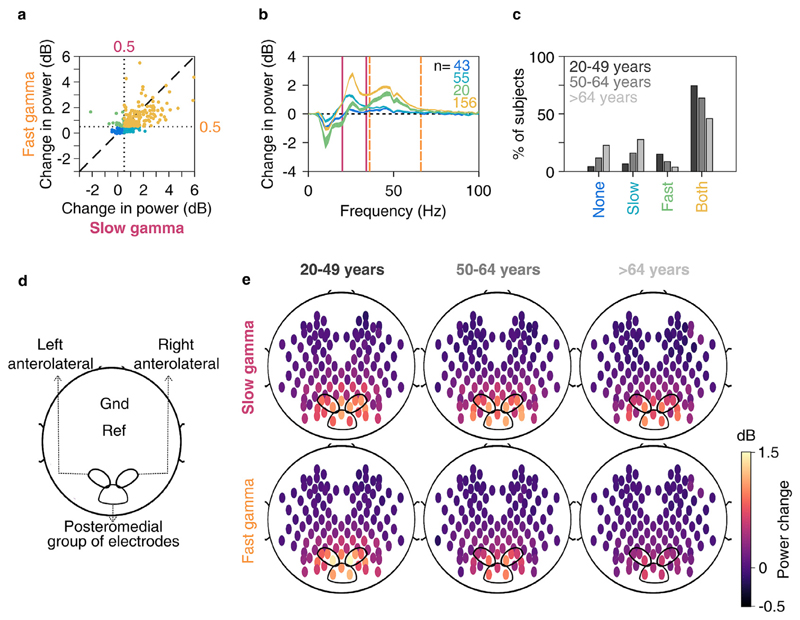
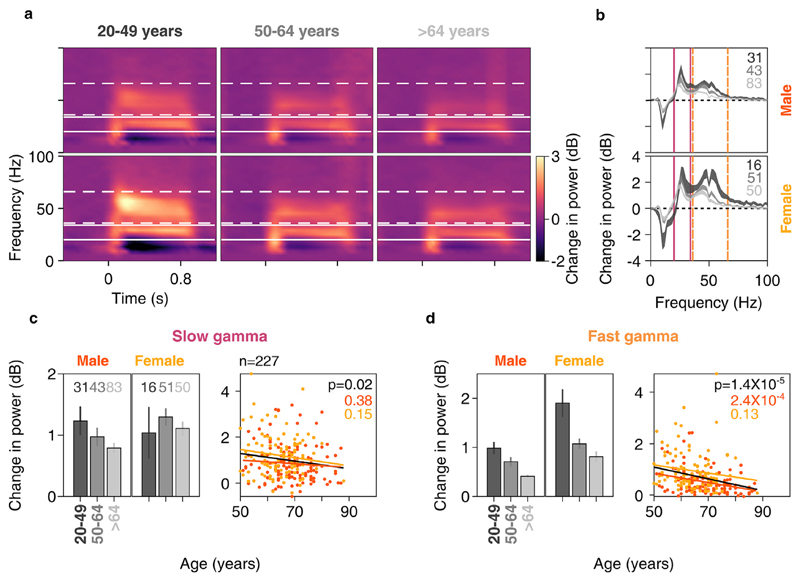
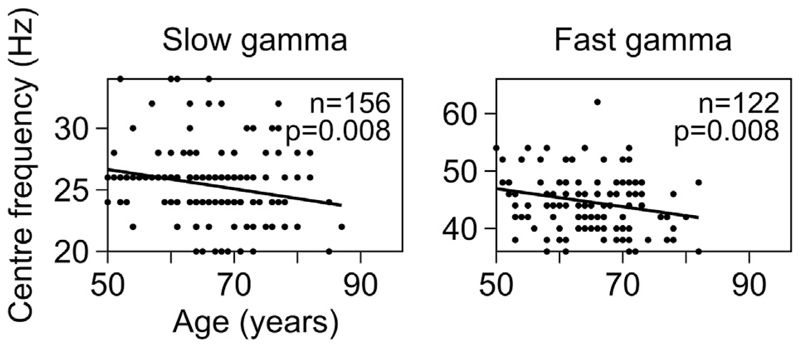
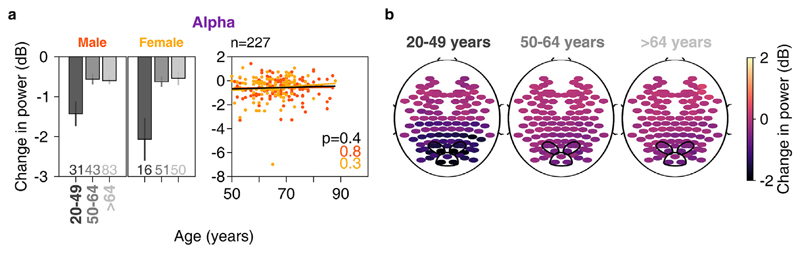
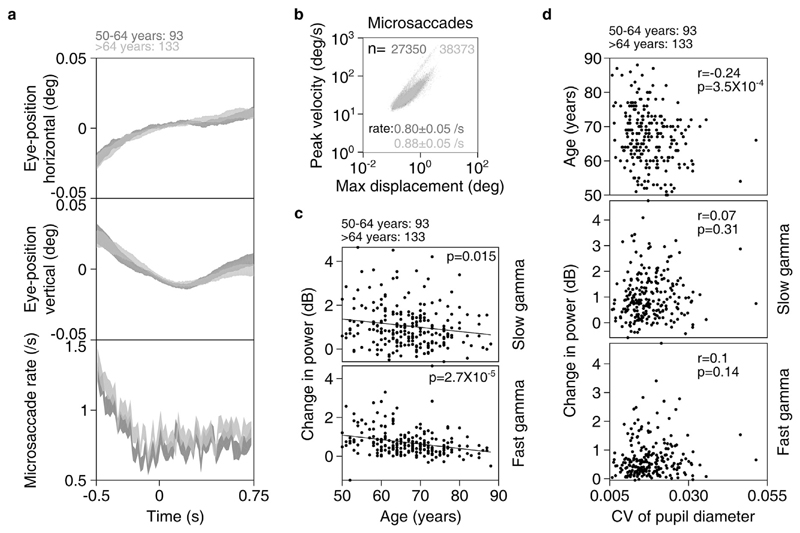
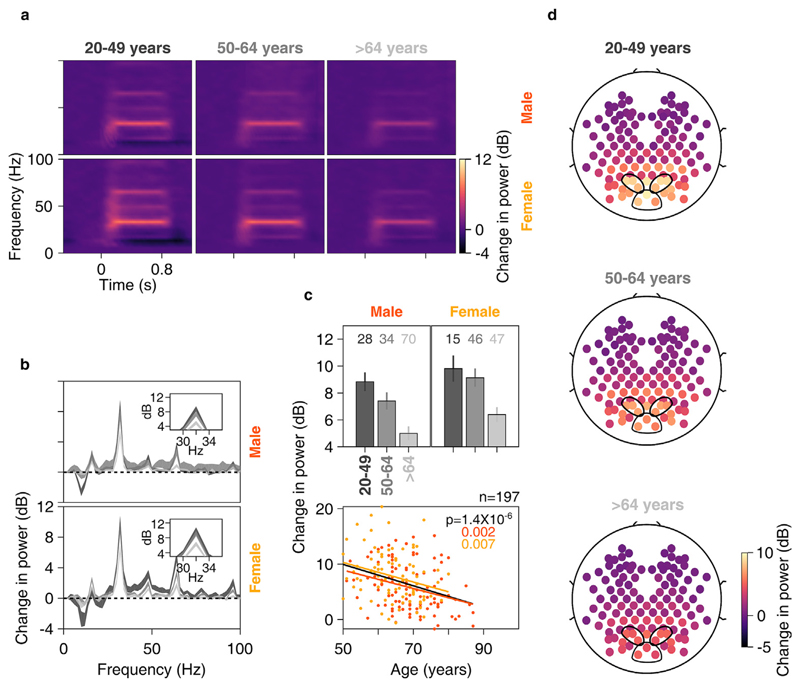
Gamma rhythms (~20-70 Hz) are abnormal in mental disorders such as autism and schizophrenia in humans, and Alzheimer's disease (AD) models in rodents. However, the effect of normal aging on these oscillations is unknown, especially for elderly subjects in whom AD is most prevalent. In a first large-scale (236 subjects; 104 females) electroencephalogram (EEG) study on gamma oscillations in elderly subjects (aged 50-88 years), we presented full-screen visual Cartesian gratings that induced two distinct gamma oscillations (slow: 20-34 Hz and fast: 36-66 Hz). Power decreased with age for gamma, but not alpha (8-12 Hz). Reduction was more salient for fast gamma than slow. Center frequency also decreased with age for both gamma rhythms. The results were independent of microsaccades, pupillary reactivity to stimulus, and variations in power spectral density with age. Steady-state visual evoked potentials (SSVEPs) at 32 Hz also reduced with age. These results are crucial for developing gamma/SSVEP-based biomarkers of cognitive decline in elderly.
Keywords: Aging; Alpha oscillations; Alzheimer’s disease; EEG; Gamma oscillations; SSVEP.
Copyright © 2020 The Author(s). Published by Elsevier Inc. All rights reserved.
Conflict of interest statement
Declaration of competing interest The authors declare no competing financial interests.
Figures