Review
. 2020 Jul 15:215:116828.
doi: 10.1016/j.neuroimage.2020.116828. Epub 2020 Apr 7.

Idiosynchrony: From shared responses to individual differences during naturalistic neuroimaging

Affiliations
Review

Idiosynchrony: From shared responses to individual differences during naturalistic neuroimaging

Emily S Finn et al. Neuroimage. .

Abstract

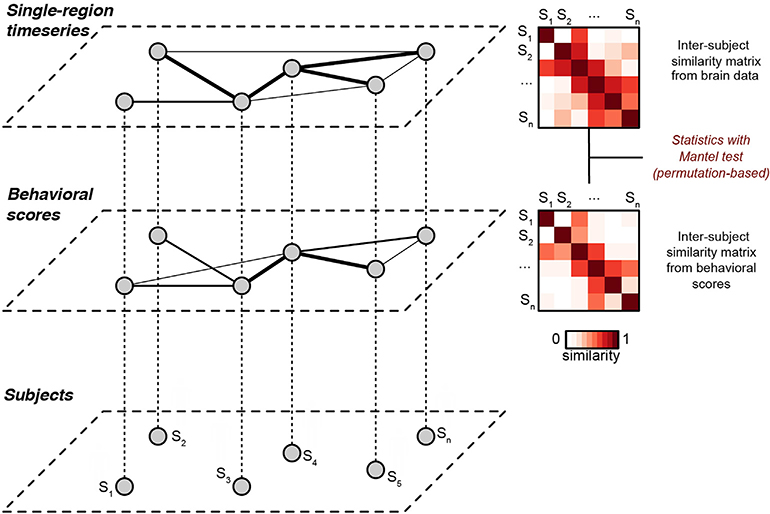
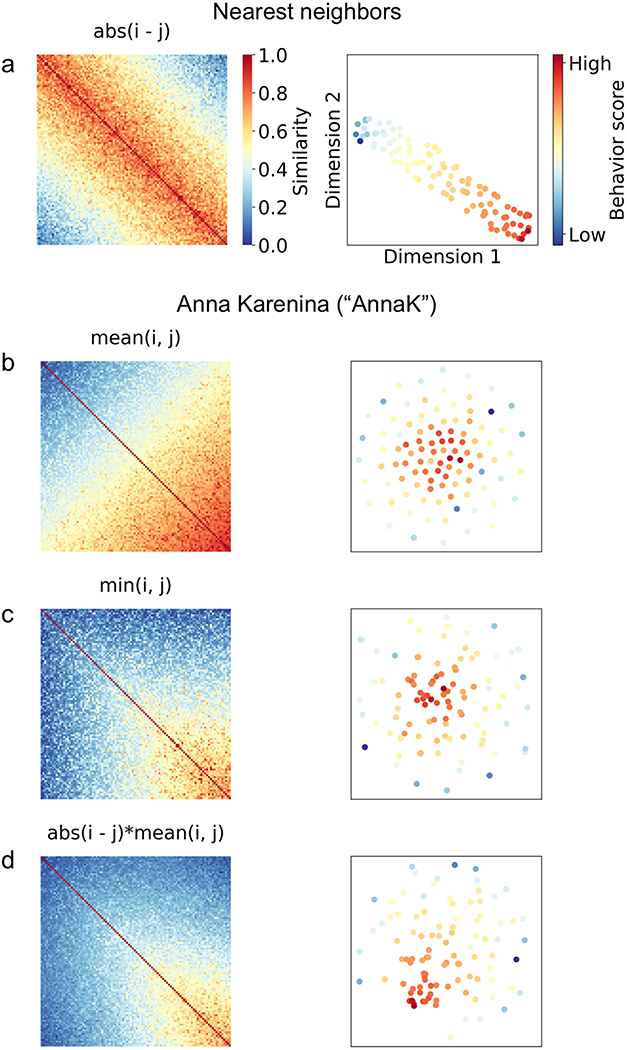
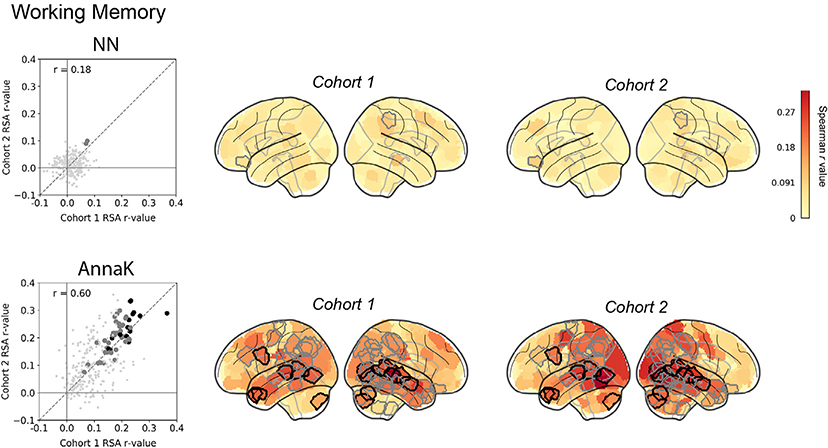
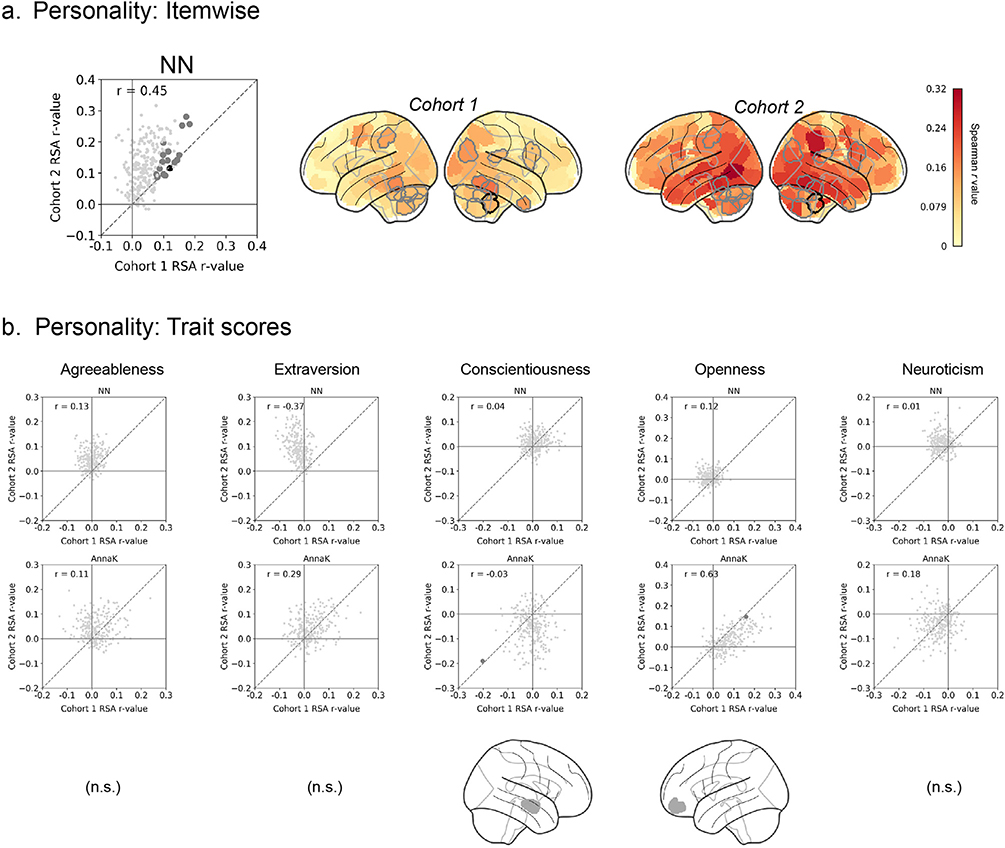
Two ongoing movements in human cognitive neuroscience have researchers shifting focus from group-level inferences to characterizing single subjects, and complementing tightly controlled tasks with rich, dynamic paradigms such as movies and stories. Yet relatively little work combines these two, perhaps because traditional analysis approaches for naturalistic imaging data are geared toward detecting shared responses rather than between-subject variability. Here, we review recent work using naturalistic stimuli to study individual differences, and advance a framework for detecting structure in idiosyncratic patterns of brain activity, or "idiosynchrony". Specifically, we outline the emerging technique of inter-subject representational similarity analysis (IS-RSA), including its theoretical motivation and an empirical demonstration of how it recovers brain-behavior relationships during movie watching using data from the Human Connectome Project. We also consider how stimulus choice may affect the individual signal and discuss areas for future research. We argue that naturalistic neuroimaging paradigms have the potential to reveal meaningful individual differences above and beyond those observed during traditional tasks or at rest.

Keywords: Behavior; Individual differences; Inter-subject correlation; Naturalistic; Representational similarity analysis; fMRI.


Figures

Fig. 1.
Fig. 1.. Schematic of inter-subject representational similarity analysis.
Each subject (bottom layer) is associated with a behavioral score (middle layer) and a pattern of brain activity (top layer, e.g., a time series from a given brain region during naturalistic stimulation). The middle and upper layers depict weighted graphs obtained using the similarity matrices as adjacency matrices, where thicker lines indicate increased similarity between nodes (subjects). In IS-RSA, we construct pairwise (i.e, subject-by-subject) similarity matrices for the behavioral data and the brain data, then compare these matrices using a Mantel test. Thus, we can leverage inter-subject analysis methods such as ISC to detect shared structure between brain data and behavioral data. This figure is a modified version of Fig. 1 in Glerean et al. (2016).
Fig. 2.
Fig. 2.. Simulated potential structures for brain-behavior representational similarity matrices.
For each row a-d, the left panel depicts a simulated pairwise brain similarity matrix in which subjects are ordered along both rows i and columns j by their behavioral score (from low to high), and each cell {i, j} reflects the correlation between subjects i and j of the timeseries of a given brain region (pairwise inter-subject correlation). The right panel depicts a two-dimensional embedding of the corresponding distance matrix (i.e., 1 – similarity matrix) using t-SNE (t-Distributed Stochastic Neighbor Embedding), in which each dot represents a subject, and subjects are colored according to their behavioral score. Under the t-SNE solution, similar observations (in this case, subjects) appear nearby, while dissimilar observations appear further away.
Fig. 3.
Fig. 3.. Inter-subject RSA: Working Memory.
Do pairs of subjects that score more similarly on a test of working memory (Human Connectome Project: ListSort_Unadj) also show stronger ISC in certain brain regions during naturalistic viewing? Two models for behavioral similarity are tested: a nearest-neighbor model (top row; cf.Fig. 2a) where the behavioral similarity matrix is constructed as |i - j|, and an “Anna Karenina “ model (bottom row, cf. Fig. 2b) where the behavioral similarity matrix is constructed as mean(i,j). In the scatter plots, each dot represents one node in the Shen atlas (268 total), plotted according to its representational similarity (Spearman correlation between brain similarity and behavioral similarity matrix, r) in cohort 1 (x- axis) versus its representational similarity in cohort 2 (y-axis). Large gray dots are nodes that show significant representational similarity (p < 0.05, uncorrected) after permutation testing in both cohorts (no. permutations = 10,000 for each cohort); large black dots are nodes that show significant representational similarity (p < 0.0136) after Bonferroni-style correction at α <0.05. The dashed diagonal line represents the identity line y = x (not the regression line), to facilitate visual inspection of replicability—if the results are replicable across cohorts, the RSA r-values should fall close to this line. Glass brains show nodes colored by IS-RSA value. Nodes outlined in gray and black show significant representational similarity after familywise and Bonferroni correction, respectively (corresponding to the large gray and black dots in the scatterplots).
Fig. 4.
Fig. 4.. Inter-subject RSA: Personality.
Do pairs of subjects with more similar personalities (as measured with the Five-Factor Inventory) also show stronger ISC in certain brain regions during naturalistic viewing? a) IS- RSA, where personality similarity is calculated as the Pearson correlation between item-wise responses of each pair of subjects (“NN-itemwise “). b) IS-RSA where personality similarity is calculated based on summary scores for each of the five traits. For each trait, two models for behavioral similarity are tested: a nearest-neighbor model (top graph in each column; cf.Fig. 2a) where the behavioral similarity matrix is constructed as |i - j|, and an “Anna Karenina” model (bottom graph in each column, cf.Fig. 2b) where the behavioral similarity matrix is constructed as mean(i,j). In all scatter plots, each dot represents one node in the Shen atlas (268 total), plotted according to its representational similarity (Spearman correlation between brain similarity and behavioral similarity matrix) in cohort 1 (x-axis) versus its representational similarity in cohort 2 (y-axis). Large gray dots are nodes that show significant representational similarity (p < 0.05, uncorrected) after permutation testing in both cohorts (no. permutations = 10,000 for each cohort); large black dots are nodes that show significant representational similarity (p < 0.0136) after Bonferroni-style correction at α < 0.05. The dashed diagonal line represents the identity line y = x (not the regression line), to facilitate visual inspection of replicability—if the results are replicable across cohorts, the RSA r-values should fall close to this line. Glass brains show nodes colored by IS-RSA value. Nodes outlined in gray and black show significant representational similarity after familywise and Bonferroni correction, respectively (corresponding to the large gray and black dots in the scatterplots).
Fig. 5.
Fig. 5.. Theoretical stimulus tuning curves for sensitivity to individual differences.
In the upper limit, as the degree of cross-subject synchrony evoked by a stimulus approaches 1, that stimulus will lose sensitivity to individual differences, since there will be no brain variability left to relate to behavioral variability. However, in the lower limit, if a stimulus evokes no correlation across subjects, there will be no meaningful structure in brain similarity to relate to behavioral similarity. Therefore, the optimal tuning curve likely follows an inverted-U shape. Determining where this curve peaks—in other words, the optimal degree of synchrony for extracting meaningful individual differences in a certain behavioral domain—should be a goal for future work.

References

    1. Alexander LM, Escalera J, Ai L, Andreotti C, Febre K, Mangone A, Vega-Potler N, Langer N, Alexander A, Kovacs M, et al. , 2017. An open resource for transdiagnostic research in pediatric mental health and learning disorders. Sci. Data 4, 170181. - PMC - PubMed
    1. Bacha-Trams M, Alexandrov YI, Broman E, Glerean E, Kauppila M, Kauttonen J, Ryyppo E, Sams M, Jáaskeláinen IP, 2018. A drama movie activates brains of holistic and analytical thinkers differentially. Soc. Cognit. Affect Neurosci. 13, 1293–1304. - PMC - PubMed
    1. Barch DM, Burgess GC, Harms MP, Petersen SE, Schlaggar BL, Corbetta M, Glasser MF, Curtiss S, Dixit S, Feldt C, et al. , 2013. Function in the human connectome: task-fMRI and individual differences in behavior. Neuroimage 80, 169–189. - PMC - PubMed
    1. Bartels A, Zeki S, 2004. Functional brain mapping during free viewing of natural scenes. Hum. Brain Mapp. 21, 75–85. - PMC - PubMed
    1. Bartolomeo P, Seidel Malkinson T, de Vito S, 2017. Botallo’s error, or the quandaries of the universality assumption. Cortex 86, 176–185. - PubMed

Publication types