. 2020 Jul:140:104868.
doi: 10.1016/j.nbd.2020.104868. Epub 2020 Apr 8.

Regulatory T cells promote remyelination in the murine experimental autoimmune encephalomyelitis model of multiple sclerosis following human neural stem cell transplant

Affiliations

Regulatory T cells promote remyelination in the murine experimental autoimmune encephalomyelitis model of multiple sclerosis following human neural stem cell transplant

Laura L McIntyre et al. Neurobiol Dis. 2020 Jul.

Abstract

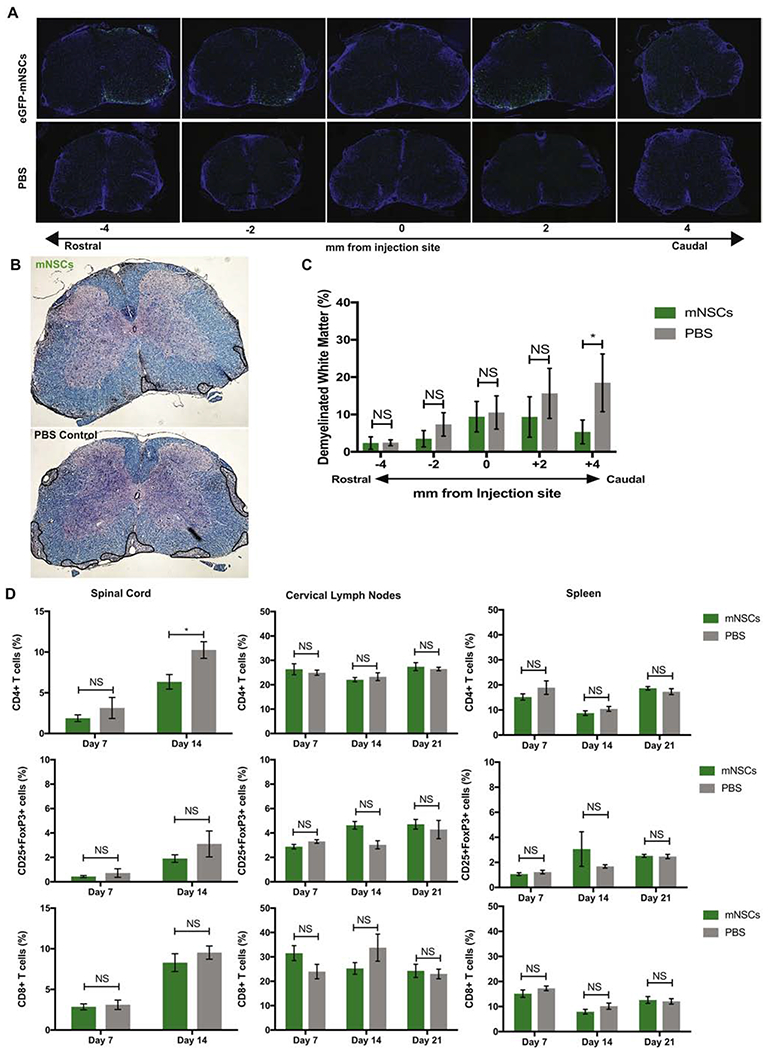
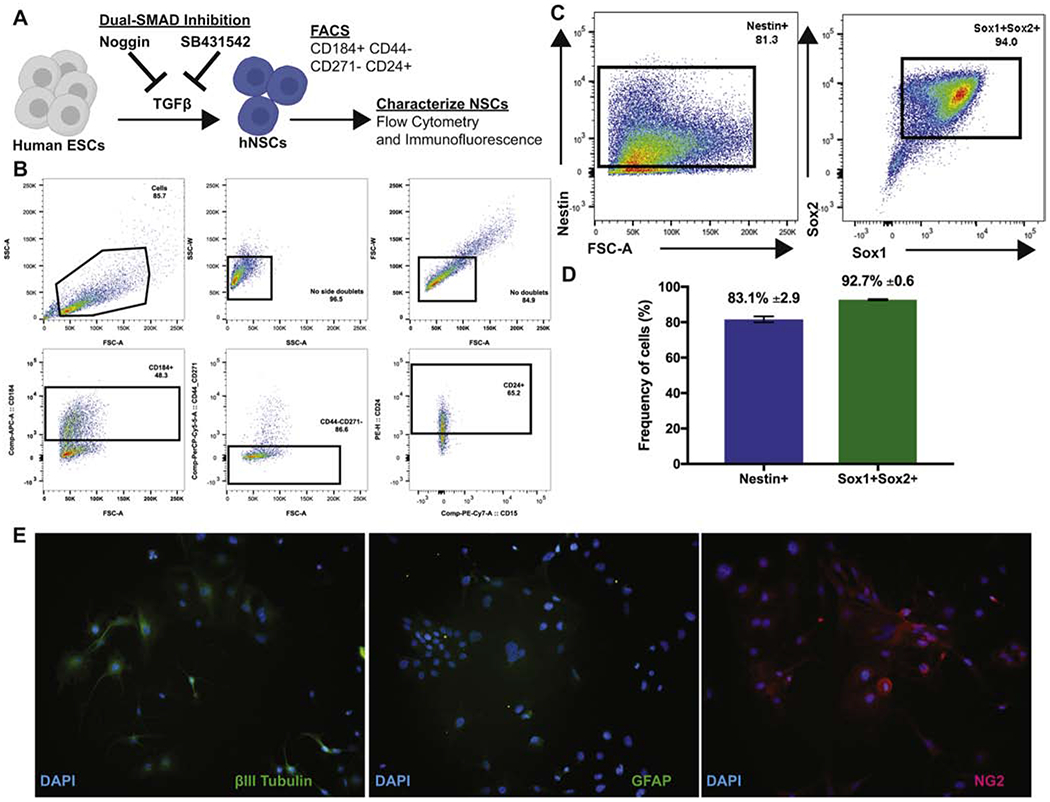
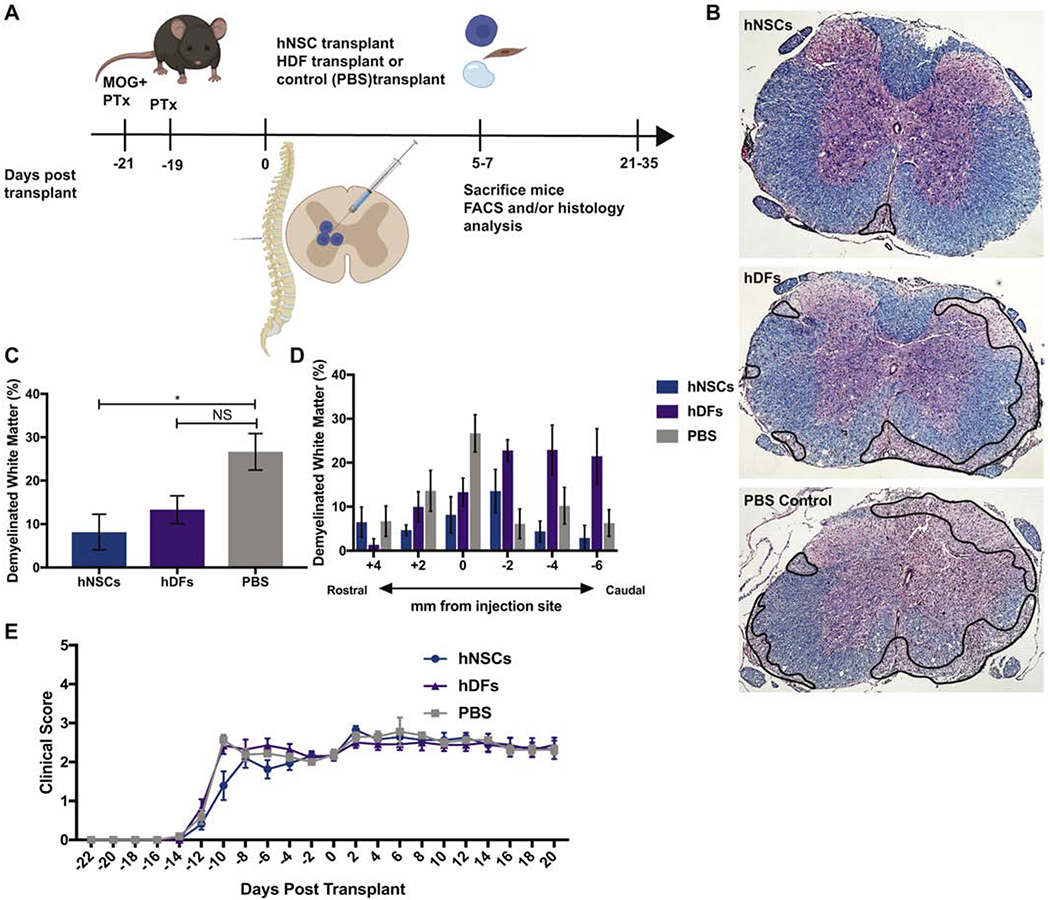
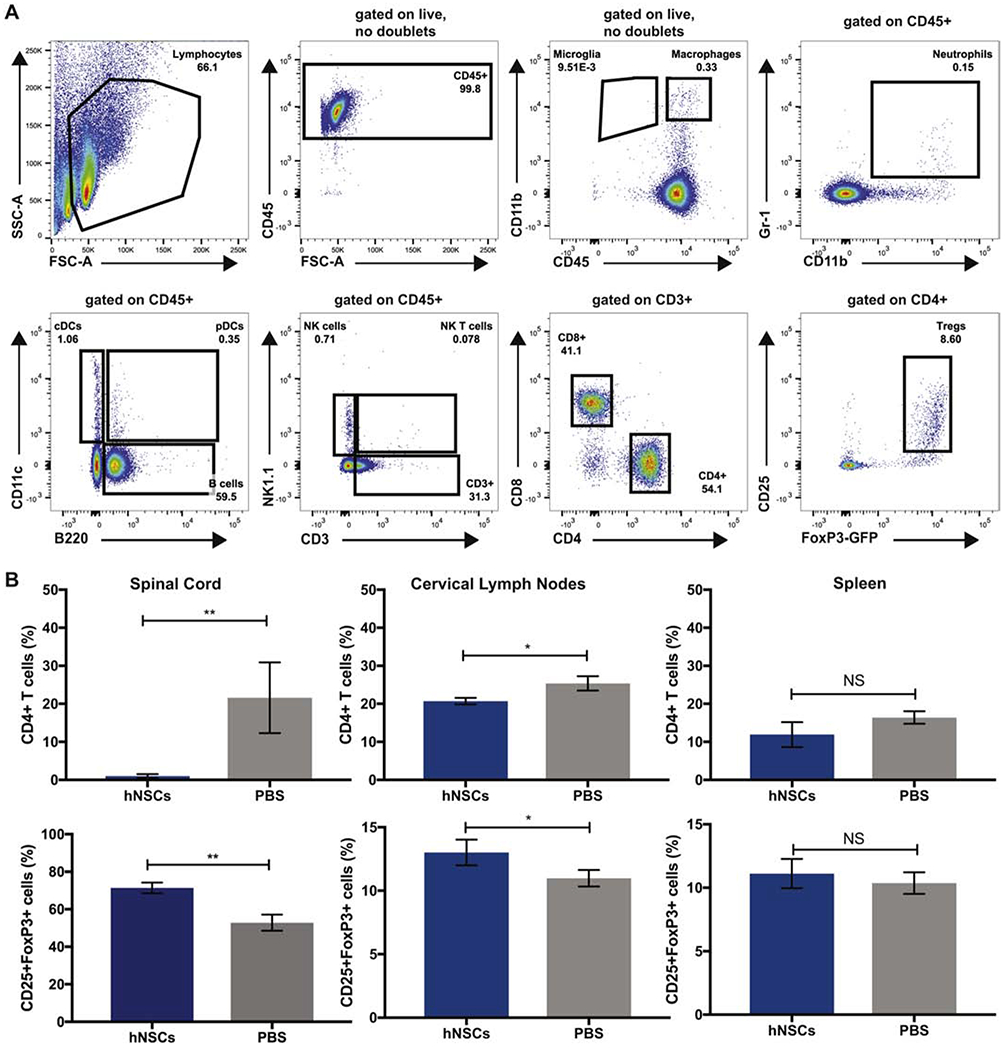
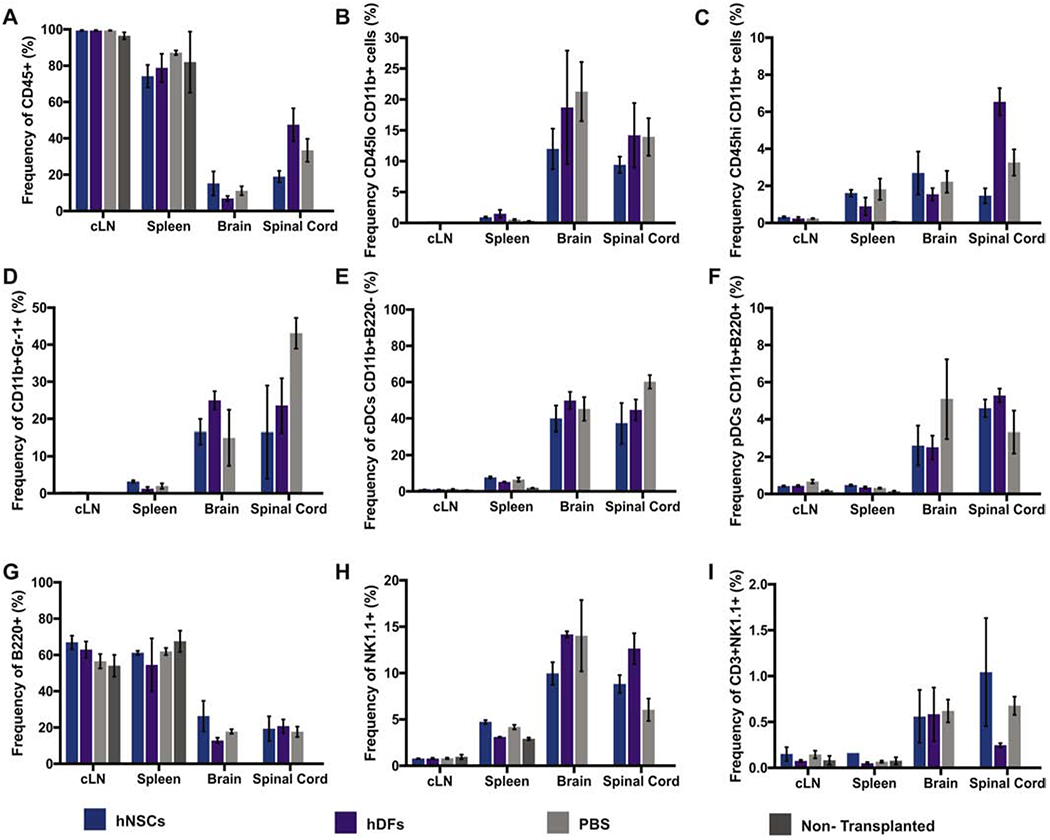
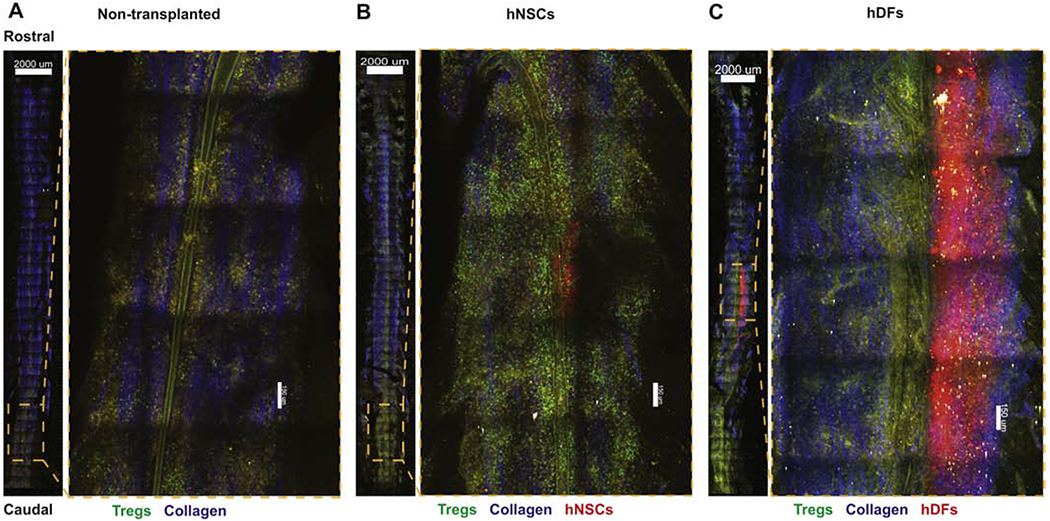
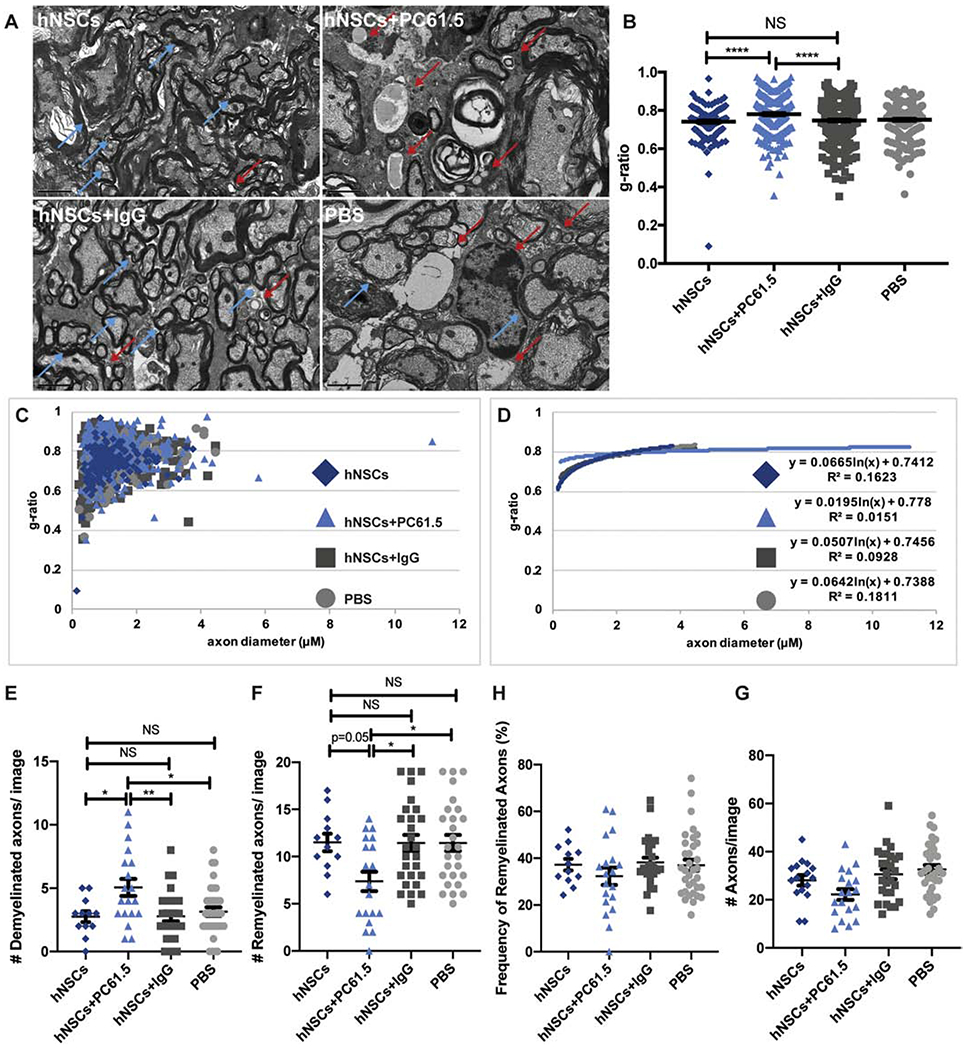
Multiple sclerosis (MS) is a chronic, inflammatory autoimmune disease that affects the central nervous system (CNS) for which there is no cure. In MS, encephalitogenic T cells infiltrate the CNS causing demyelination and neuroinflammation; however, little is known about the role of regulatory T cells (Tregs) in CNS tissue repair. Transplantation of neural stem and progenitor cells (NSCs and NPCs) is a promising therapeutic strategy to promote repair through cell replacement, although recent findings suggest transplanted NSCs also instruct endogenous repair mechanisms. We have recently described that dampened neuroinflammation and increased remyelination is correlated with emergence of Tregs following human NPC transplantation in a murine viral model of immune-mediated demyelination. In the current study we utilized the prototypic murine autoimmune model of demyelination experimental autoimmune encephalomyelitis (EAE) to test the efficacy of hNSC transplantation. Eight-week-old, male EAE mice receiving an intraspinal transplant of hNSCs during the chronic phase of disease displayed remyelination, dampened neuroinflammation, and an increase in CNS CD4+CD25+FoxP3+ regulatory T cells (Tregs). Importantly, ablation of Tregs abrogated histopathological improvement. Tregs are essential for maintenance of T cell homeostasis and prevention of autoimmunity, and an emerging role for Tregs in maintenance of tissue homeostasis through interactions with stem and progenitor cells has recently been suggested. The data presented here provide direct evidence for collaboration between CNS Tregs and hNSCs promoting remyelination.

Keywords: Multiple sclerosis; Neural stem cells; Neuroinflammation; Regulatory T cells; Remyelination.


Conflict of interest statement

Declaration of Competing Interest The authors have no competing interests to disclose.

Figures

Figure 1.
Figure 1.. Mouse Neural Stem Cells engraft, migrate and remyelinate in an EAE mouse model of MS with no effect upon CNS immune environment.
(A) Representative serial sections of spinal cord rostral and caudal to the site of implantation (T9) show that eGFP-mNSCs (green) survive 28 days post-transplantation and migrate towards areas of demyelination compared to PBS treated controls. Nuclei are stained with DAPI (blue) (B) Representative brightfield images of coronal spinal cord sections from eGFP-mNSC (n= 12) or PBS control (n= 13) transplanted animals stained with luxol fast blue (LFB) and counterstained with hematoxylin and eosin (H&E), areas of demyelinated white matter outlined in black. (C) Quantification of demyelination in the ventral white matter of eGFP-mNSC (n= 12) or PBS control (n= 13) transplanted mice revealed significantly (p<0.05) reduced demyelination at sections caudal to the injection site. (D) Quantification of the frequency of adaptive immune cell populations CD4+, CD4+CD25+FoxP3+ and CD8+ T cell subsets within the spinal cord, draining cervical lymph nodes, and spleen of eGFP-mNSC (n= 5) or PBS control (n= 5) injected mice revealed no significant difference in cell populations at day 7 p.t. FACS plots were analyzed and quantified by gating on lymphocytes, excluding forward and side scatter doublets, CD4+ or CD8+ and CD4+CD25+FoxP3+. Sample gating strategy is shown in Supplemental Figure 1. Data represents two independent experiments. 14 days p.t. there was a slight, but significant (*p= 0.0182) decrease in frequency of CD4+ T cells within the spinal cord of mice receiving eGFP-mNSCs 14 days p.t., however no significant difference in the frequency of CD4+ T cells, CD8+ T cells and CD4+CD25+FoxP3+ Tregs in the cLN and spleen 7, 14 or 21 days p.t. or in the SC at day 7 or 21 p.t. For (C), day 28 p.t. demyelinated white matter analysis eGFP-mNSCs (n=12) and control PBS (n=13). Data is presented as average ± SEM and analyzed using one-way ANOVA followed by Tukey’s multiple comparison test. For (D), day 7 p.t. analysis eGFP-mNSCs (n=5) and control PBS (n=5). Data is presented as average ± SEM and analyzed using a two-way ANOVA with a Sidak’s multiple comparisons test.
Figure 2.
Figure 2.. EB-derived Human Neural Stem Cells are multipotent and express neural lineage markers.
(A) Diagram depicting derivation and differentiation of hNSCs. (B) Representative FACS sort plots for CD184+CD44CD271 CD24+ hNSCs. Cells were gated sequentially excluding side and forward scatter doublets, CD184+, CD44CD271, and CD24+. (C) FACS plots of sorted hNSCs for expression of NSC markers Nestin, Sox1 and Sox2. (D) Frequency of hNSCs expressing NSC makers Nestin (83.1%± 2.9; blue) and Sox1 and Sox2 (92.7% ± 0.6; green). Data is presented as average ± SEM. (E) Microscopy images of differentiated hNSCs that expressed markers of neurons (βIll-tubulin; left), astrocytes (GFAP; middle) and oligodendrocytes (NG2; right). Magnification =20x.
Figure 3.
Figure 3.. Transplantation of hNSCs results in less demyelination in the EAE mouse spinal cord.
(A) Timeline of EAE induction (MOG35-55 immunization and Pertussis Toxin (PTx) administration), hNSC transplant and analysis. (B) Representative brightfield images of coronal spinal cord sections from hNSC (n=8), hDF (n=5) or PBS (n=9) control transplanted animals stained with luxol fast blue (LFB) and counterstained with hematoxylin and eosin (H&E), areas of demyelinated white matter outlined in black. (C) Quantification of demyelination in the ventral white matter of hNSC (n=8), hDF (n=5) and control PBS (n=9) transplanted mice revealed significantly (p=0.0232) reduced demyelination at the injection site in the spinal cords of hNSC transplanted mice, 28 days p.t. (D) Quantification of demyelination in areas rostral and caudal to the site of injected revealed that reduced demyelination was not sustained throughout the spinal cord. All data is presented as average ± SEM and analyzed using one-way ANOVA followed by Tukeys multiple comparison test (C and D). (E) Graph of clinical scores of mice injected intraspinally with hNSCs (n=8, blue), hDFs (n=7, purple), or control PBS (n=8, grey) at defined timepoints p.t.. Clinical evaluation was performed double-blind and based on the following scoring system; 0, asymptomatic; 0.5, ruffled fur; 1, flaccid tail; 2, hind limb paresis; 2.5, partial hind limb paralysis; 3, hind limb paralysis; 4, hind limb and forelimb paralysis; 5, moribund. Data represents two independent experiments and is presented as average ± SEM. No significant difference in locomotor function were observed. Data was analyzed using a two-way ANOVA.
Figure 4.
Figure 4.. Increase in CD4+CD25+FoxP3+ regulatory T cells in the spinal cord and cervical lymph nodes following hNSC Transplant.
(A) Representative FACS plots showing gating strategy for immune cells. (B) Quantification of the frequency of CD4+, CD4+CD25+FoxP3+ and CD8+ T cell subsets 7 days p.t. from hNSC (n=3) or PBS transplanted (n=3) mice demonstrated a significant (p=0.006) decrease in the percentage of CD4+ T cells within the spinal cord (top left) and draining cervical lymph nodes (top middle). An increase in frequency of CD4+CD25+FoxP3+ Tregs was observed in the spinal cord (lower left) and a significant (p=0.004) increase infrequency of CD4+CD25+FoxP3+ Tregs was observed in the draining cervical lymph nodes (lower middle) of hNSC transplanted mice. A difference in CD4+, CD4+CD25+FoxP3+ cells was not observed in the spleen. Data represents three independent experiments. Data is presented as average ±SEMand analyzed using an unpaired, two-tailed T-Test.
Figure 5.
Figure 5.. Immune cell populations are unaffected following hNSC Transplant.
Quantification of the frequency and number of immune cell populations in cervical lymph nodes, spleen, spinal cord and brain of hNSC (n=6), hDF (n=6), PBS (n=6), or non-transplanted (n=6) control mice 7 days p.t. No difference in immune cell populations; CD45+ (A top, left), CD45lo CD11b+ Microglia (B top, middle), CD45hi CD11b+ Macrophages (C top, right), CD11b+Gr-1+ Neutrophils (D middle, left), CD11b+B220 cDCs (E middle, middle), CD11b+B220+ pDCs (F middle, right), B220+ B cells (G bottom, left), NK1.1+ NK cells (H bottom, middle), or CD3+NK1.1+ NK T cells (I bottom, right) were observed. Data represents two independent experiments. Data is presented as average ± SEM and analyzed using one-way ANOVA followed by Tukeys multiple comparison test.
Figure 6.
Figure 6.. Tregs accumulate at the site of hNSC injection in the EAE Spinal cord.
Representative 2-photon-microscopy-derived spinal cord montage and magnified images showing distribution of FoxP3EGFP Tregs (green), transplanted cell trace yellow (CTY) labeled hNSCs or hDFs (red), second-harmonic signal from collagen (blue), and autofluorescent structures (yellow) in the ventral side of the spinal cord, 3 days p.t. of mice that were non-transplanted (n=3) (A), received hNSCs (n=3) (B), or hDFs (n=3) (C). Images are maximal intensity projections through the z-axis, ventral-dorsal (750 μm), scale bar (overview) = 2000 μm; scale bar (magnification) = 150 μm.
Figure 7.
Figure 7.. Regulatory T cells are necessary for remyelination following hNSC transplant.
(A) Representative electron micrographs of coronal spinal cord sections from hNSCs (n=10; top, left), hNSCs+PC61.5 (n= 7; top, right), hNSCs+IgG (n= 7; bottom, left), and control PBS (n=8; bottom, right) injected mice. Demyelinated axons indicated by red arrows. Remyelinated axons indicated by blue arrows. (B) Quantification of ratio of inner axon diameter versus total myelinated fiber (g-ratio) G-ratio of hNSCs (0.7414±0.0063), hNSCs+PC61.5 (0.7808±0.0057), hNSCs+IgG (0.748±0.0049), and PBS (0.7512±0.0054). More than 200 axons were measured per group. Data is presented as average ± SEM and analyzed using one-way ANOVA followed by Tukey’s multiple comparison test. (C) Scatter plot displaying g-ratio of individual axons as a function of axonal diameter from hNSC (dark blue, diamonds), hNSC+PC61.5 (light blue, triangles), hNSC+IgG (dark grey, squares), and control PBS (light grey, circles) injected mice. More than 200 axons were measured per group. (D) Logarithmic trend lines for scatter plot displayed in C. Quantification of the number of (E) demyelinated axons, (F) remyelinated axons, (G) percentage of remyelinated axons and (H) number of total axons per EM image from mice receiving hNSCs, hNSCs+ PC61.5, hNSCs+IgG, and control PBS. For E-H, more than 200 axons were counted per group. Data is presented as average ± SEM and analyzed using one-way ANOVA followed by Tukey’s multiple comparison test. (*p<0.05**p<0.01; **p<0.001; NS is not significant).

Similar articles

Cited by

References

    1. Ali N, et al., 2017. Regulatory T Cells in Skin Facilitate Epithelial Stem Cell Differentiation. Cell. 169, 1119–1129 e11. - PMC - PubMed
    1. Arpaia N, et al., 2015. A Distinct Function of Regulatory T Cells in Tissue Protection. Cell. 162, 1078–89. - PMC - PubMed
    1. Ben-Hur T, et al., 2013. Cell-based reparative therapies for multiple sclerosis. Curr Neurol Neurosci Rep. 13, 397. - PubMed
    1. Bergmann CC, et al., 2006. Coronavirus infection of the central nervous system: host-virus stand-off. Nat Rev Microbiol. 4, 121–32. - PMC - PubMed
    1. Blurton-Jones M, et al., 2009. Neural stem cells improve cognition via BDNF in a transgenic model of Alzheimer disease. Proc Natl Acad Sci U S A. 106, 13594–9. - PMC - PubMed

Publication types