. 2020 Apr 8;11(4):406.
doi: 10.3390/genes11040406.

MCPH1 Lack of Function Enhances Mitotic Cell Sensitivity Caused by Catalytic Inhibitors of Topo II

Affiliations

MCPH1 Lack of Function Enhances Mitotic Cell Sensitivity Caused by Catalytic Inhibitors of Topo II

María Arroyo et al. Genes (Basel). .

Abstract

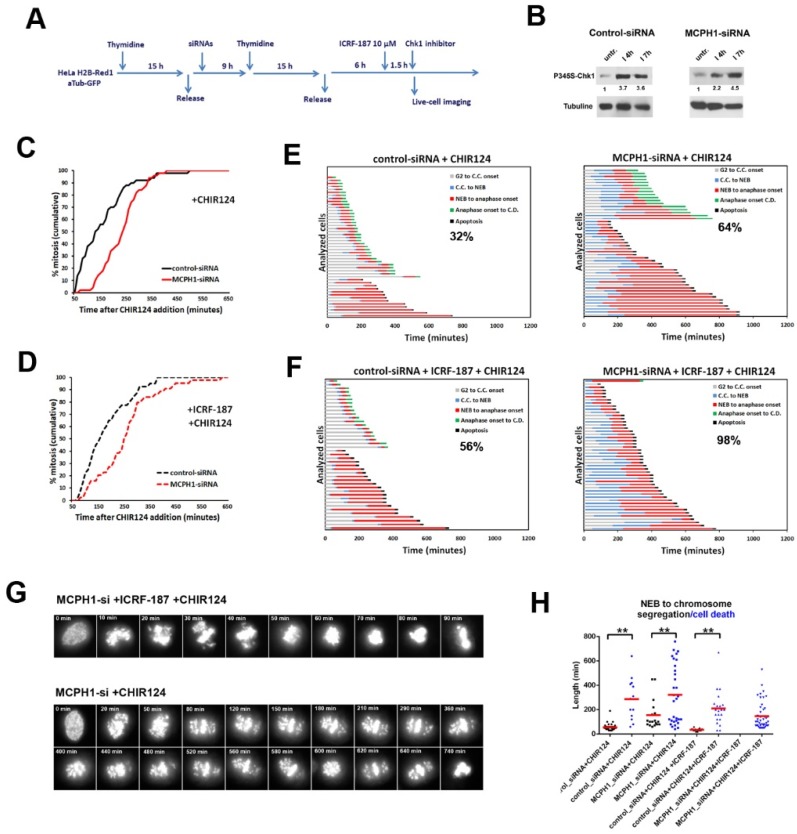
The capacity of Topoisomerase II (Topo II) to remove DNA catenations that arise after replication is essential to ensure faithful chromosome segregation. Topo II activity is monitored during G2 by a specific checkpoint pathway that delays entry into mitosis until the chromosomes are properly decatenated. Recently, we demonstrated that the mitotic defects that are characteristic of cells depleted of MCPH1 function, a protein mutated in primary microcephaly, are not a consequence of a weakened G2 decatenation checkpoint response. However, the mitotic defects could be accounted for by a minor defect in the activity of Topo II during G2/M. To test this hypothesis, we have tracked at live single cell resolution the dynamics of mitosis in MCPH1 depleted HeLa cells upon catalytic inhibition of Topo II. Our analyses demonstrate that neither chromosome alignment nor segregation are more susceptible to minor perturbation in decatenation in MCPH1 deficient cells, as compared with control cells. Interestingly, MCPH1 depleted cells were more prone to mitotic cell death when decatenation was perturbed. Furthermore, when the G2 arrest that was induced by catalytic inhibition of Topo II was abrogated by Chk1 inhibition, the incidence of mitotic cell death was also increased. Taken together, our data suggest that the MCPH1 lack of function increases mitotic cell hypersensitivity to the catalytic inhibition of Topo II.

Keywords: ICRF; MCPH1; Topoisomerase II; anaphase errors; chromosome condensation; chromosome segregation; decatenation checkpoint; mitotic catastrophe; mitotic cell death.


Conflict of interest statement

The authors declare no conflict of interest. The funders had no role in the design of the study; in the collection, analyses, or interpretation of data; in the writing of the manuscript, or in the decision to publish the results.

Figures

Figure 1
Figure 1
Catalytic inhibition of Topo II by ICRF induces permanent G2 arrest in MCPH1 depleted cells in the absence of double strand breaks (DSBs). (A) Description of the experimental procedure performed in HeLa cells stably expressing fluorescent H2B-Red1 and αTubuline-GFP. Cells were synchronized at the G1/S border by double thymidine block. Transfection with small interfering RNAs (siRNAs) duplexes was performed during the release from the first thymidine block. ICRF-187 (10 µM) was added 6 h after release from the second thymidine block to coincide with the occurrence of PLCs (“Prophase-like” cells) during G2 in the siRNA treated cells [1]. Fluorescent images were collected immediately after release from ICRF-193 incubation (2 h) with a Leica TCS SP5 microscope. Images were stacked and processed using Image J software. Timing data were obtained after visual inspection of a minimum of 50 cells. (B) Immunoblot analyses of MCPH1 and alpha-tubulin (loading control) levels in HeLa H2B-Red1 cells treated as explained in A. (C, D) Cumulative frequency chart showing the timing (in min) of mitosis onset, revealed by nuclear envelope breakdown, for cells monitored as explained in A. Time after ICRF-187 or solvent addition is shown. Data representative of two independent experiments is shown. (E) Frequency of segregation errors for cells in anaphase from A (n = 50). Data from MCPH1-siRNA samples were not analyzed as no mitotic cells were observed (NA, not analyzed). (F) Box-plots showing the time interval of the indicated mitotic events in min. for the indicated treatments. The red line indicates the mean value. At least 50 cells were analyzed in each case. Statistical comparisons for the mean and median data were performed by t-student and Wilcoxon (W) tests respectively. ** p < 0.01; N.S. = not significant. (G, H) Selected frames showing the cell cycle dynamics of representative control-siRNA and MCPH1-siRNA transfected cells upon the indicated treatments. Red arrows point to bridge figures persisting during late mitosis in control cells. Time from onset of live-cell recording is indicated in min. (I) Representative images of mid-Z sections from cells after 3 h of incubation with ICRF-187 (10 uM), etoposide (15 uM) or mock. (J) Box-plots showing the number of γ-H2AX foci per nucleus observed by immunofluorescence after 3 h of incubation with the corresponding inhibitors. Boxplots represent the median with the box depicting the 25–75 percentile and the lines denote the 95% confidence interval. Statistical significance was tested with a paired two-samples Wilcoxon test, ** p < 0.005, N.S. not significant. NEB: Nuclear Envelope Breakdown.
Figure 2
Figure 2
Low dose inhibition of Topo II has a negative impact on the viability of mitotic cells lacking MCPH1 function. (A) Description of the experimental procedure performed. (B) Cumulative frequency chart showing the timing (in min) of mitosis onset, revealed by nuclear envelope breakdown, for 50 cells monitored as explained in A. Time after ICRF addition is shown. Data representative of two independent experiments is shown. (C, D) Box-plots showing the time interval of the indicated mitotic events in min. for the indicated treatments. The red line indicates the mean value. 50 cells were analyzed in each case. Statistical comparisons for the mean and median data were performed by t-student and Wilcoxon (W) tests respectively. **p < 0.01; N.S. not significant. (E) Frequency of segregation errors for control-siRNA and MCPH1-siRNA after the corresponding treatments. Mean and range (bars) data from two independent experiments are presented. Pooled data were pairwise compared by Χ2 test of independence. *p < 0.05. (F, G) Dynamics of G2/M progression for individual cells analyzed in A. The timing of different key mitotic events is shown in different colors. The number refers to the percentage of cells undergoing mitotic cell death. (H, J) Selected frames showing the mitotic progression of representative control-siRNA and MCPH1-siRNA treated cells as explained in A. Red arrowhead points to lagging chromosomes in anaphase. White arrows point to unaligned chromosomes. Asterisk denotes the occurrence of mitotic cell death, which was defined by massive chromosome shattering. Time in min. from nuclear envelope breakdown (0 min) is shown. (K) Illustrative example of a prometaphase cell depleted of MCPH1 function. Note that unaligned chromosomes, indicated by arrows, appear close to the spindle poles. C.C: Chromosome condensation, C.D.: Chromosome decondensation.
Figure 3
Figure 3
Upon recovery from ICRF187-mediated G2 arrest MCPH1 depleted cells have reduced viability during mitosis. (A) Description of the experimental procedure performed. (B) Cumulative frequency chart showing the timing (in min) of mitosis onset, revealed by nuclear envelope breakdown, for 50 cells monitored as explained in A. Time after release from ICRF-187 addition is shown. Data representative of two independent experiments is presented. (C, D) Charts showing the frequency of mitotic cell death (C) and segregation errors during anaphase (D) from the cells analyzed in A. Mean and range (bars) data from two independent experiments are presented. Pooled data were pairwise compared by χ2 test of independence. *p < 0.05. (E, F) Box-plots showing the time interval of the indicated mitotic events in min. for the indicated treatments. The red line indicates the mean value. 50 cells were analyzed in each case. Statistical comparisons for the mean and median data were performed by t-student and Wilcoxon (W) tests respectively. **p < 0.01
Figure 4
Figure 4
Cells lacking MCPH1 function are hypersensitive to abrogation of the ICRF187-induced G2 arrest by Chk1 inhibition. (A) Description of the experimental procedure performed. (B) Immunoblot analyses of phosphoS345-Chk1 and tubulin levels in control-siRNA and MCPH1-siRNA cells after incubation with ICRF-193 for the indicated times. Relative comparison of phosphoS345-Chk1 levels upon normalization with loading control is shown below each sample. (C, D) Cumulative frequency chart showing the timing (in min) of mitosis onset, revealed by nuclear envelope breakdown, for 50 cells monitored as explained in A. Time after CHIR124 or solvent addition is shown. Data representative of two independent experiments is shown. (E, F) Dynamics of G2/M progression for individual cells analyzed in A. The timing of different key mitotic events is showed in different colors. The number refers to the percentage of cells undergoing mitotic cell death in each sample. (G) Selected frames showing MCPH1-siRNA cells undergoing mitotic cell death upon the indicated treatments. Time in min. from nuclear envelope breakdown (0 min) is shown (H) Box-plots showing pairwise comparisons of the time that cells within the same sample (indicated) required to either initiate mitotic cell death (black symbols) or initiate chromosome segregation (blue symbols), after nuclear envelope breakdown. Red lines denote the mean value. Statistical comparisons for the mean and median data were done by t-student and Wilcoxon (W) tests respectively. ** p < 0.01

References

    1. Wang J.C. Cellular roles of DNA topoisomerases: A molecular perspective. Nat. Rev. Mol. Cell Biol. 2002;3:430–440. doi: 10.1038/nrm831. - DOI - PubMed
    1. Clarke D.J., Vas A.C., Andrews C.A., Díaz-Martínez L.A., Giménez-Abián J.F. Topoisomerase II checkpoints: Universal mechanisms that regulate mitosis. Cell Cycle. 2006;5:1925–1928. doi: 10.4161/cc.5.17.3200. - DOI - PubMed
    1. Giménez-Abián J.F., Clarke D.J., Giménez-Martín G., Weingartner M., Giménez-Abián M.I., Carballo J.A., Díaz de la Espina S.M., Bögre L., De la Torre C. DNA catenations that link sister chromatids until the onset of anaphase are maintained by a checkpoint mechanism. Eur. J. Cell Biol. 2002;81:9–16. doi: 10.1078/0171-9335-00226. - DOI - PubMed
    1. Adachi Y., Luke M., Laemmli U.K. Chromosome assembly in vitro: Topoisomerase II is required for condensation. Cell. 1991;64:137–148. doi: 10.1016/0092-8674(91)90215-K. - DOI - PubMed
    1. Clarke D.J., Johnson R.T., Downes C.S. Topoisomerase II inhibition prevents anaphase chromatid segregation in mammalian cells independently of the generation of DNA strand breaks. J. Cell Sci. 1993;569:563–569. - PubMed

Publication types

MeSH terms

LinkOut - more resources