

Detecting geospatial patterns of Plasmodium falciparum parasite migration in Cambodia using optimized estimated effective migration surfaces
- PMID: 32276636
- PMCID: PMC7149848
- DOI: 10.1186/s12942-020-00207-3
Detecting geospatial patterns of Plasmodium falciparum parasite migration in Cambodia using optimized estimated effective migration surfaces
Abstract
Background: Understanding the genetic structure of natural populations provides insight into the demographic and adaptive processes that have affected those populations. Such information, particularly when integrated with geospatial data, can have translational applications for a variety of fields, including public health. Estimated effective migration surfaces (EEMS) is an approach that allows visualization of the spatial patterns in genomic data to understand population structure and migration. In this study, we developed a workflow to optimize the resolution of spatial grids used to generate EEMS migration maps and applied this optimized workflow to estimate migration of Plasmodium falciparum in Cambodia and bordering regions of Thailand and Vietnam.
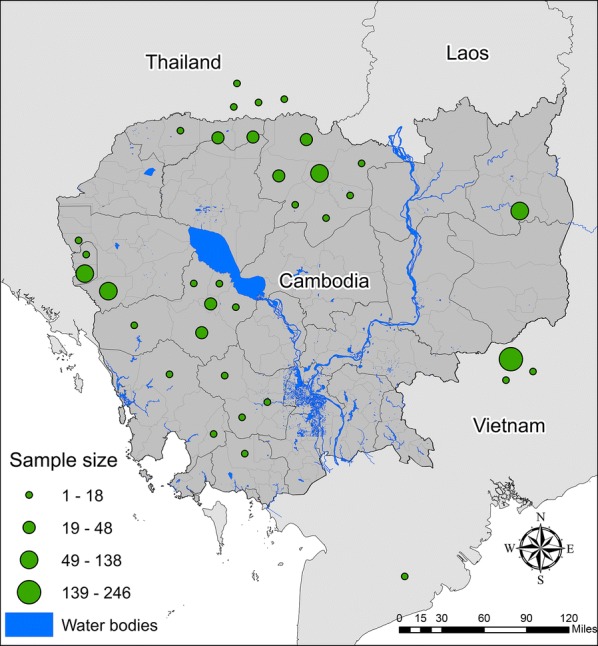
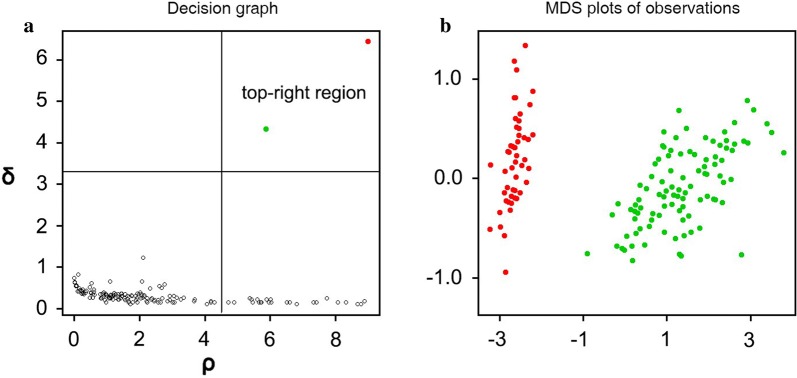
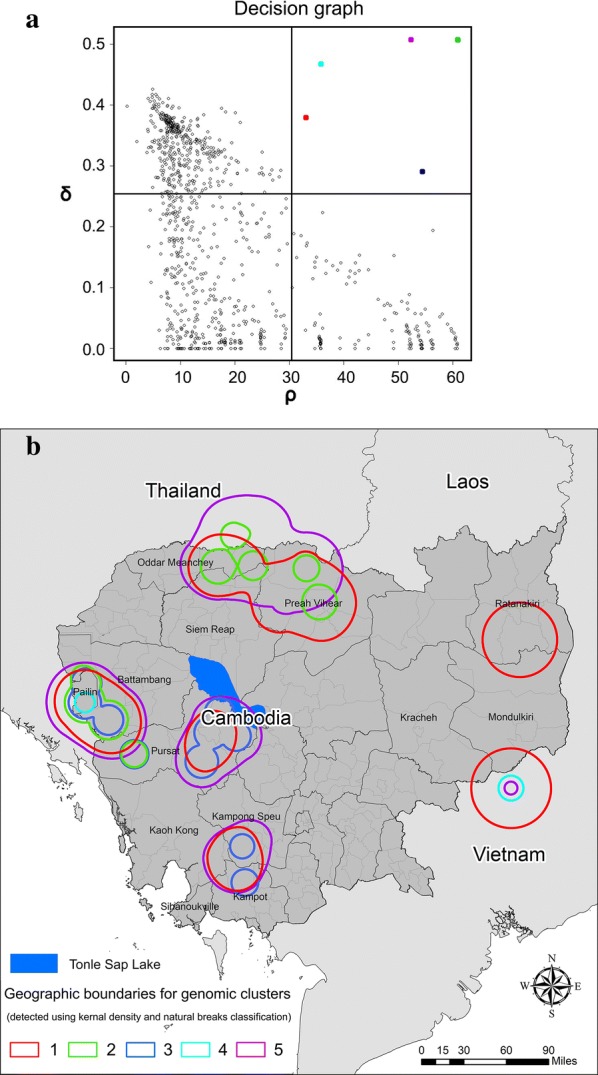
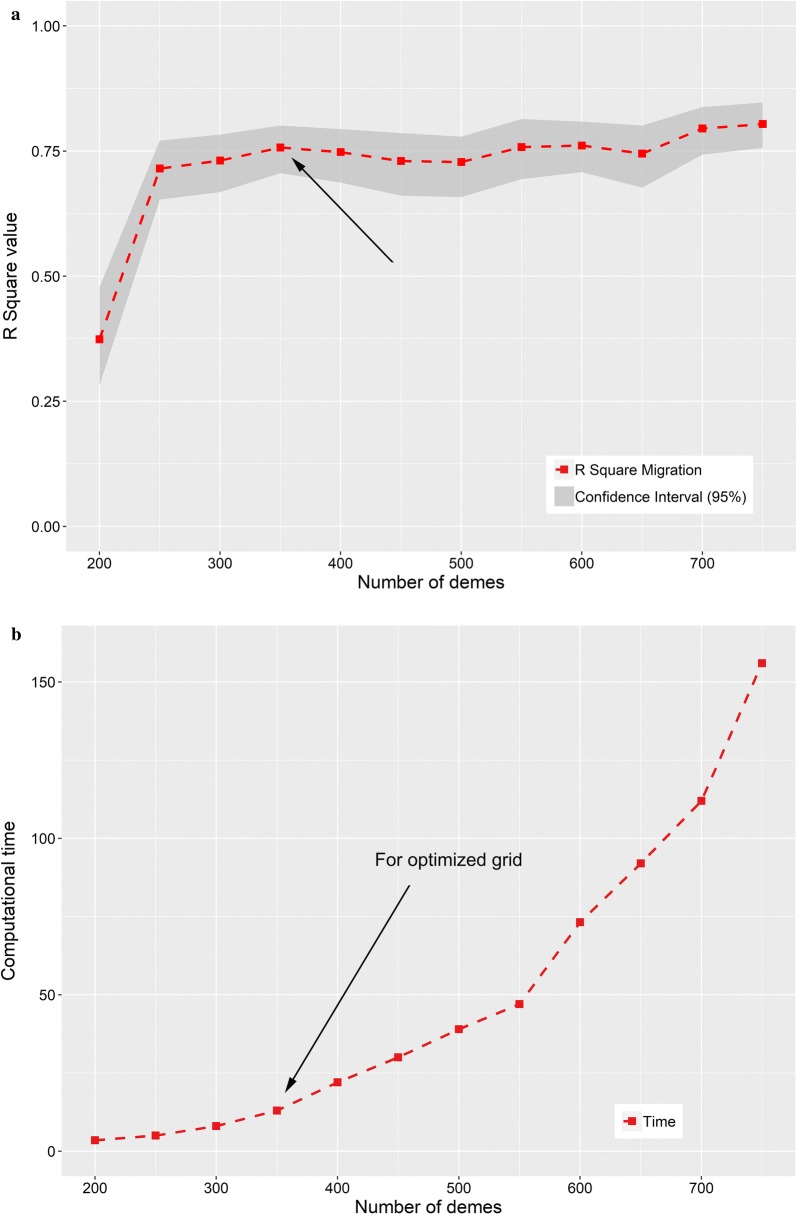
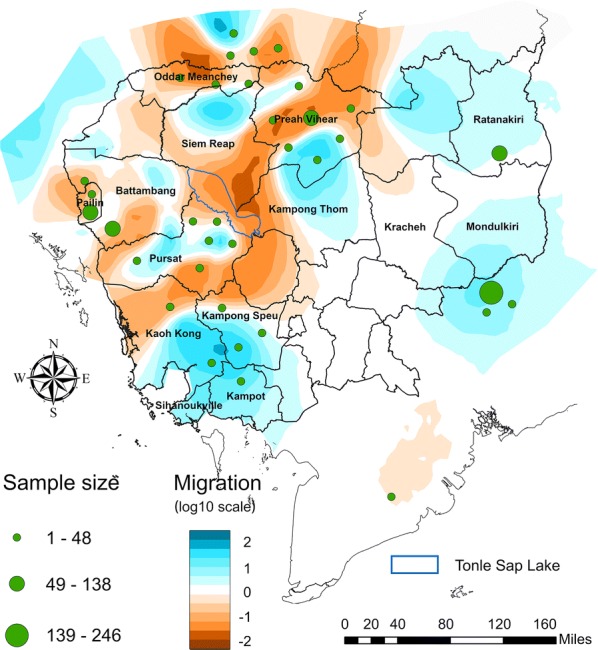
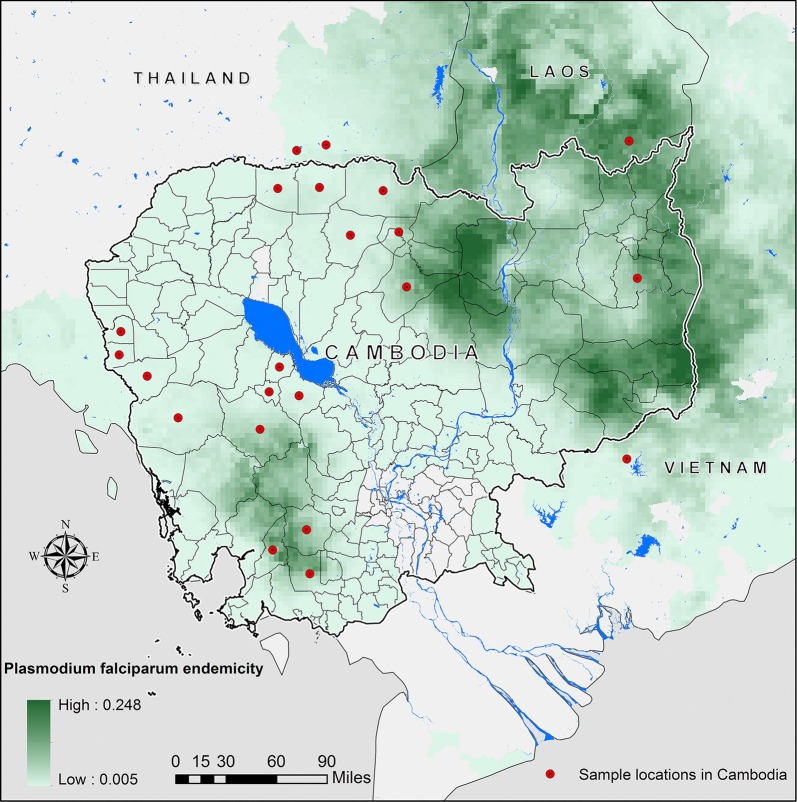
Methods: The optimal density of EEMS grids was determined based on a new workflow created using density clustering to define genomic clusters and the spatial distance between genomic clusters. Topological skeletons were used to capture the spatial distribution for each genomic cluster and to determine the EEMS grid density; i.e., both genomic and spatial clustering were used to guide the optimization of EEMS grids. Model accuracy for migration estimates using the optimized workflow was tested and compared to grid resolutions selected without the optimized workflow. As a test case, the optimized workflow was applied to genomic data generated from P. falciparum sampled in Cambodia and bordering regions, and migration maps were compared to estimates of malaria endemicity, as well as geographic properties of the study area, as a means of validating observed migration patterns.
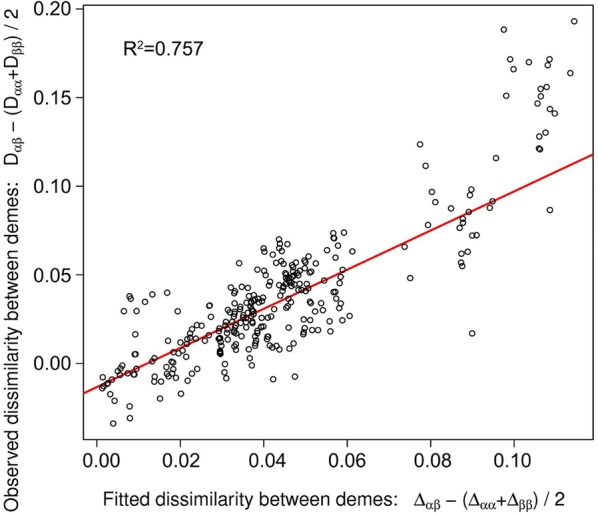
Results: Optimized grids displayed both high model accuracy and reduced computing time compared to grid densities selected in an unguided manner. In addition, EEMS migration maps generated for P. falciparum using the optimized grid corresponded to estimates of malaria endemicity and geographic properties of the study region that might be expected to impact malaria parasite migration, supporting the validity of the observed migration patterns.
Conclusions: Optimized grids reduce spatial uncertainty in the EEMS contours that can result from user-defined parameters, such as the resolution of the spatial grid used in the model. This workflow will be useful to a broad range of EEMS users as it can be applied to analyses involving other organisms of interest and geographic areas.
Keywords: Estimated effective migration surfaces; Malaria elimination; Parasite migration; Plasmodium falciparum.
Conflict of interest statement
The authors declare that they have no competing interests.
Figures
References
Publication types
MeSH terms
Grants and funding
LinkOut - more resources
Full Text Sources
Molecular Biology Databases
