. 2020 Apr 10;51(1):52.
doi: 10.1186/s13567-020-00777-x.

Mycoplasma gallisepticum triggers immune damage in the chicken thymus by activating the TLR-2/MyD88/NF-κB signaling pathway and NLRP3 inflammasome

Affiliations

Mycoplasma gallisepticum triggers immune damage in the chicken thymus by activating the TLR-2/MyD88/NF-κB signaling pathway and NLRP3 inflammasome

Chunli Chen et al. Vet Res. .

Abstract

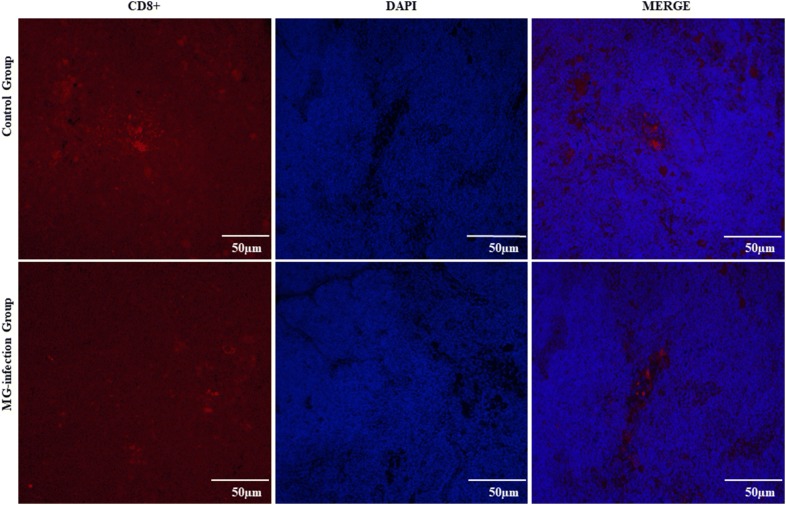
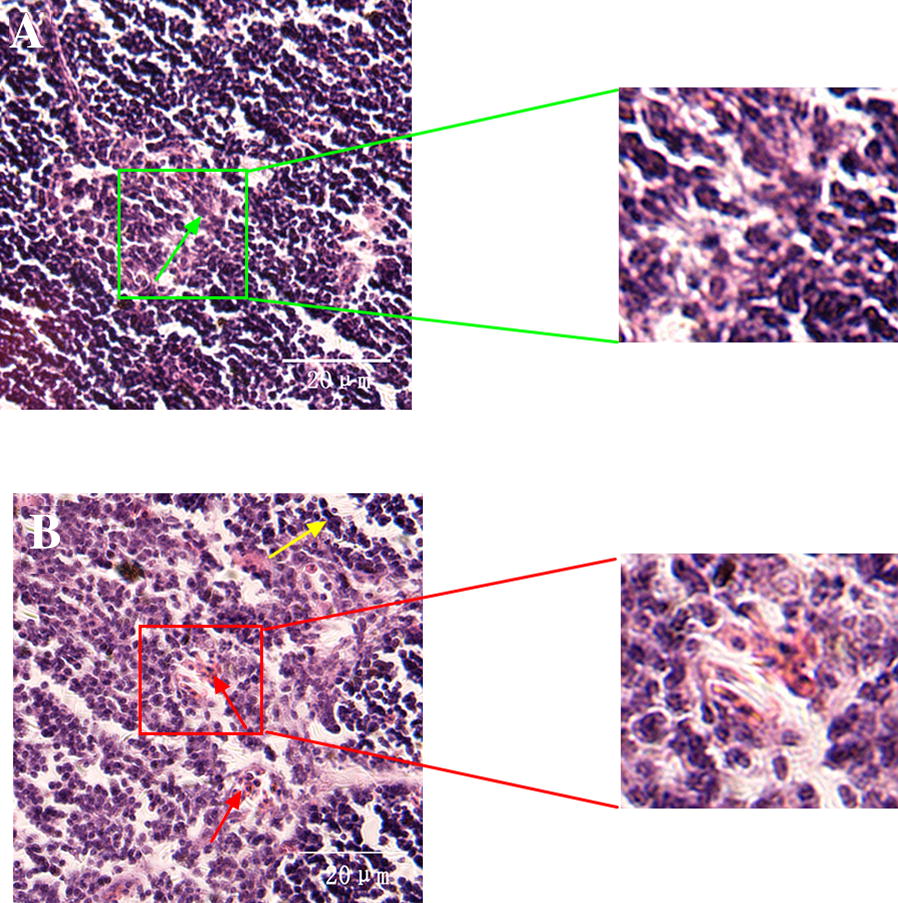
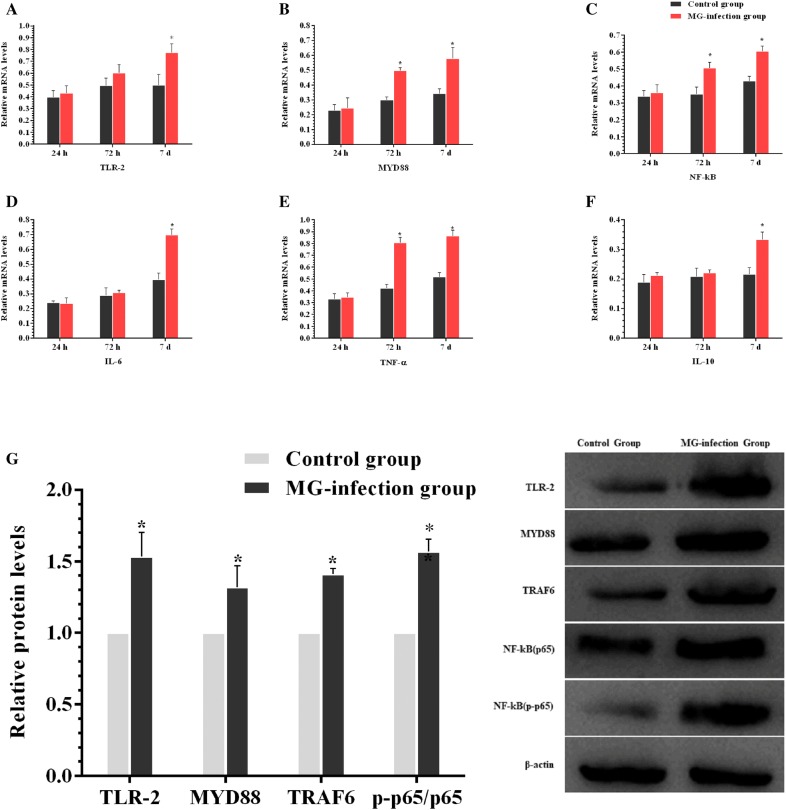
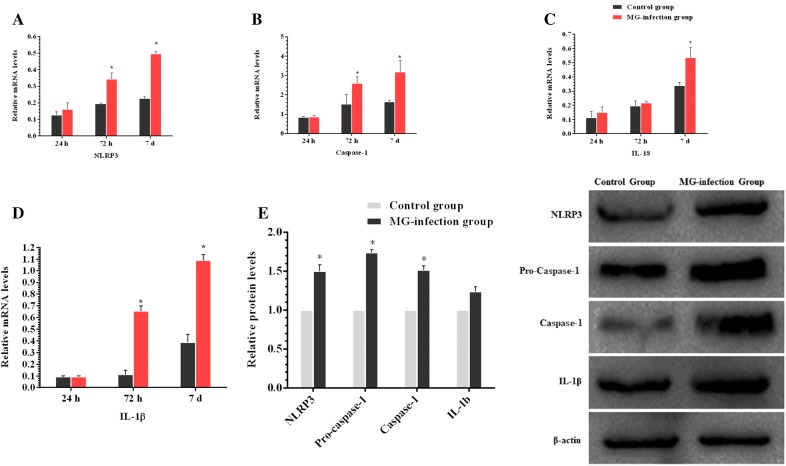
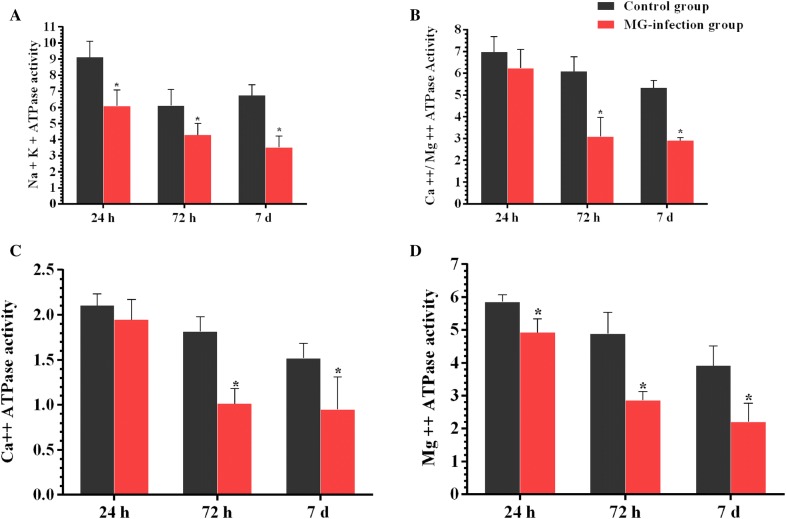
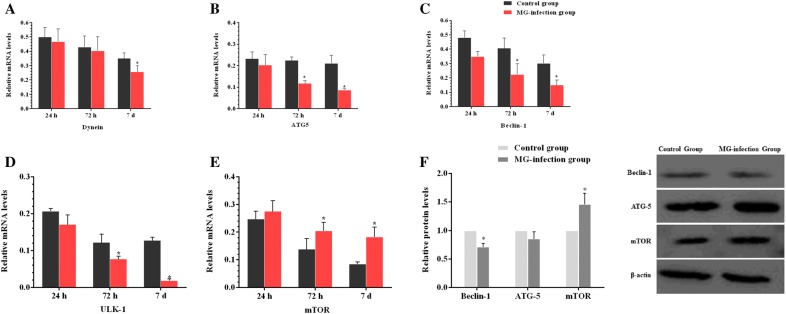
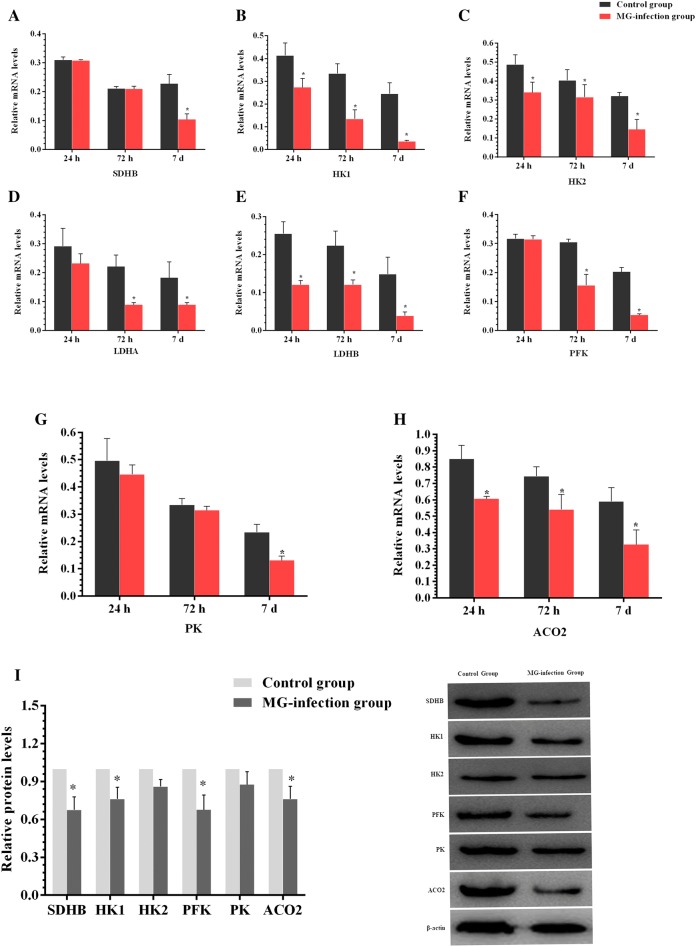
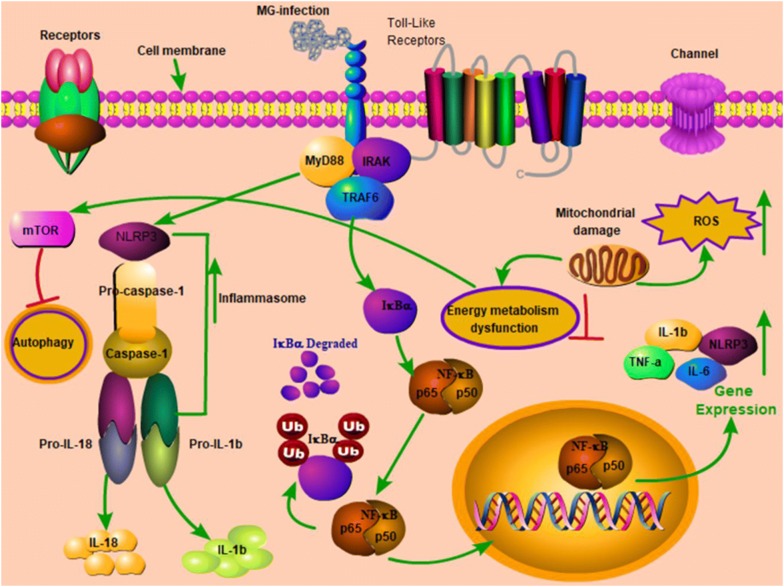
Previous studies reported that Mycoplasma gallisepticum (MG) causes immune dysregulation in chickens. However, the underlying mechanisms of immune dysregulation in chickens are still unclear. The thymus is a primary lymphoid organ where the proliferation, differentiation and selection of T-lymphocytes occur, whereas T-lymphocytes play a crucial role in innate immune responses. To evaluate the effects of MG-infection on chicken thymus, White Leghorn chickens were divided into (1) control group and (2) MG-infection group. ATPase activities were detected by commercial kits. The hallmarks of inflammation, autophagy and energy metabolism were examined in chicken thymus tissues by histopathology, transmission electron microscopy, immunofluorescence microscopy, RT-PCR and western blotting. Immunofluorescence examination revealed that the number of CD8+ lymphocytes has significantly reduced in MG-infection group. In addition, morphological analysis revealed that MG induced inflammatory cells infiltration. The mitochondria were swollen and chromatin material was condensed in MG-infection group. The mRNA and protein expression results showed that MG-infection triggered the nucleotide-binding oligomerization domain, leucine rich repeat and pyrin domain containing 3 (NLRP3) inflammasome through TLR-2/MyD88/NF-κB signaling pathway. Meanwhile, the expressions of autophagy-related genes were reduced both at mRNA and protein level in MG-infection group. While, ATPase activities and the expression of energy metabolism-related genes were reduced in the thymus of MG-infected chickens. These results showed that MG-infection triggered inflammatory response through TLR-2/MyD88/NF-κB signaling pathway, activated NLRP3 inflammasome, reduced the level of autophagy and impaired energy metabolism, which then lead to tissue damage in chicken thymus. The data provide new insights in MG-infection-mediated immune damage and provide possible therapeutic targets for future targeted therapy.


Conflict of interest statement

The authors declare that they have no competing interests.

Figures

Figure  1
Figure  1
The effect of MG-infection on the number of CD8+T-lymphocytes were estimated by using immunofluorescence microscopy. The photomicrographs were taken at 400 × magnification (n = 3). Groups are represented as control group and MG-infection group. The immunofluorescence photomicrographs are represented as CD8+, DAPI and Merge in each group.
Figure  2
Figure  2
Ultrastructural analysis showing the effect of MG-infection on chicken thymus. Ultrastructural analysis (Figure 3) was performed at day 7 post-infection. Experimental groups are represented as (A) control group and (B) MG-infection group (n = 3). It is clear from the ultrastructural photomicrographs (zooming area) that the mitochondria (green arrow) are intact and clearly visible in the control group. In contrast, mitochondrial swelling (red arrow), increased intercellular space, nuclear lysis, and cell membrane deformation (yellow arrow) were present in the MG-infection group.
Figure  3
Figure  3
Histological examination showing the effect of MG-infection on morphology of thymus tissues. The stained Sects. (40 × magnification) are represented as (A) control group (B) and MG-infection group (n = 3). The green arrow shows normal intact structure of thymus tissues in the control group, while yellow arrow shows necrotic debris and red arrow shows that thymus tissues lose their compact arrangement with increased inflammatory cells infiltrates.
Figure  4
Figure  4
MG-infection induced TLR-2/MyD88/NF-κB pathway. Panels A–F represent mRNA levels of inflammation-related genes at the three time points and panel G represents protein expression level. Experimental groups are represented as control group and MG-infection group. Bar graphs represent mean results ± SD (n = 3). *P < 0.05 represents statistically significant difference compared to the control group.
Figure  5
Figure  5
MG-infection activated NLRP3 inflammasome in chicken thymus. Panels A-D represent mRNA levels at the three time points and panel E shows protein levels of the two experimental groups at day 7. Experimental groups are represented as control group and MG-infection group. Bar graphs represent mean results ± SD (n = 3). *P < 0.05 represents statistically significant difference compared to the control group.
Figure  6
Figure  6
MG-infection suppressed ATPase activities in chicken thymus. Panels AD show the effect of MG-infection on Mg ++-ATPase, Ca ++-Mg ++-ATPase, Ca ++ATPase and Na + -K + -ATPase activities, assessed at the three time points. Experimental groups are represented as control group and MG-infection group. Bar graphs represent mean results ± SD (n = 3). *P < 0.05 represents statistically significant difference compared to the control group.
Figure  7
Figure  7
MG-infection modulated autophagy in chicken thymus tissues. Panels A–E display mRNA expression levels of autophagy-related genes at the three time points and panel F shows protein expression level at day 7. Experimental groups are represented as control group and MG-infection group. Bar graphs represent mean results ± SD (n = 3). *P < 0.05 represents statistically significant difference compared to the control group.
Figure  8
Figure  8
Effect of MG-infection on energy metabolism-related genes in chicken thymus. Panels A–H represent mRNA expression levels of energy metabolism-related genes at the three time points and panel I represents protein expression levels at day 7. Experimental groups are represented as control group and MG-infection group. Bar graphs represent mean results ± SD (n = 3). *P < 0.05 represents statistically significant difference compared to the control group.
Figure  9
Figure  9
Schematic diagram showing the effect of MG-infection on chicken thymus tissues. MG-infection activated NLRP3 inflammasome involving TLR-2/MyD88/NF-κB pathway, decreased the level of autophagy and induced energy metabolism dysfunction. Red arrows show inhibition/downregulation and green arrows show upregulation or increased expression and connection between signaling molecules.

References

    1. Razin S, Yogev D, Naot Y. Molecular biology and pathogenicity of mycoplasmas. Microbiol Mol Biol Rev. 1998;62:1094–1156. doi: 10.1128/MMBR.62.4.1094-1156.1998. - DOI - PMC - PubMed
    1. Majumder S, Zappulla F, Silbart LK. Mycoplasma gallisepticum lipid associated membrane proteins up-regulate inflammatory genes in chicken tracheal epithelial cells via TLR-2 ligation through an NF-kB dependent pathway. PLoS One. 2014;9:e112796. doi: 10.1371/journal.pone.0112796. - DOI - PMC - PubMed
    1. Majumder S, Silbart LK. Interaction of Mycoplasma gallisepticum with chicken tracheal epithelial cells contributes to macrophage chemotaxis and activation. Infect Immun. 2016;84:266–274. doi: 10.1128/IAI.01113-15. - DOI - PMC - PubMed
    1. Pflaum K, Tulman ER, Beaudet J, Liao X, Geary SJ. Global changes in Mycoplasma gallisepticum phase-variable lipoprotein gene vlhA expression during in vivo infection of the natural chicken host. Infect Immun. 2016;84:351–355. doi: 10.1128/IAI.01092-15. - DOI - PMC - PubMed
    1. Papazisi L, Frasca S, Gladd M, Liao X, Yogev D, Geary SJ. GapA and CrmA coexpression is essential for Mycoplasma gallisepticum cytadherence and virulence. Infect Immun. 2002;70:6839–6845. doi: 10.1128/IAI.70.12.6839-6845.2002. - DOI - PMC - PubMed

MeSH terms