. 2020 Oct 1;88(7):541-553.
doi: 10.1016/j.biopsych.2020.02.008. Epub 2020 Feb 19.

Cumulative Effects of Social Stress on Reward-Guided Actions and Prefrontal Cortical Activity

Affiliations

Cumulative Effects of Social Stress on Reward-Guided Actions and Prefrontal Cortical Activity

Florent Barthas et al. Biol Psychiatry. .

Abstract

Background: When exposed to chronic social stress, animals display behavioral changes that are relevant to depressive-like phenotypes. However, the cascading relationship between incremental stress exposure and neural dysfunctions over time remains incompletely understood.

Methods: We characterized the longitudinal effect of social defeat on goal-directed actions and prefrontal cortical activity in mice using a novel head-fixed sucrose preference task and two-photon calcium imaging.

Results: Behaviorally, stress-induced loss of reward sensitivity intensifies over days. Motivational anhedonia, the failure to translate positive reinforcements into future actions, requires multiple sessions of stress exposure to become fully established. For neural activity, individual layer 2/3 pyramidal neurons in the cingulate and medial secondary motor subregions of the medial prefrontal cortex have heterogeneous responses to stress. Changes in ensemble activity differ significantly between susceptible and resilient mice after the first defeat session and continue to diverge following successive stress episodes before reaching persistent abnormal levels.

Conclusions: Collectively, these results demonstrate that the cumulative impact of an ethologically relevant stress can be observed at the level of cellular activity of individual prefrontal neurons. The distinct neural responses associated with resilience versus susceptibility suggests the hypothesis that the negative impact of social stress is neutralized in resilient animals, in part through an adaptive reorganization of prefrontal cortical activity.

Keywords: Chronic stress; Goal-directed behavior; Prefrontal cortex; Pyramidal neurons; Reward; Social defeat.


Conflict of interest statement

DISCLOSURES

The authors report no biomedical financial interests or potential conflicts of interest.

Figures

Figure 1:
Figure 1:. A self-paced, instrumental sucrose preference task for the head-fixed mouse
(A) Schematic of the experimental setup. The head-fixed mouse had access to a composite lick spout with three openings, each of which could deliver fluid independently. The mouse sat atop a skewered sphere or a treadmill and could run forwards or backwards. (B) The task was based on a tandem fixed-ratio (FR), fixed-interval (FI) schedule. To illustrate the FR10-FI5 schedule, licks detected and reinforcement delivered from an actual behavioral session were plotted. (C) The task had a block design, cycling through multiple types of reinforcement including 0%, 3%, and 10% sucrose solutions. The sequence was always 0%, 3%, 10%, 3%, and then 0%, 3%, 10%, 3% again, and so on. (D) Lick rate for a typical session. Lick rate was calculated in 10-s bins. The colored patches indicated the reinforcement type and duration of the blocks. Note that there were time gaps between the blocks, because a new block would begin only after the completion of a FR10 action sequence. The animal responded for about 30 min before stopping due to satiation. (E) Rewards earned for each block. This is the same session as (D). (F) Rewards earned per session. Open circles, individual sessions; bar, mean ± s.e.m. (G) Rewards earned for each reinforcement type, normalized by rewards earned in 0% blocks, per session. Open circles, individual sessions; bar, mean ± s.e.m; Main effect of reinforcement type (F3,114 = 47.8; P = 4 x 10⁻²⁰), comparisons: 0% vs. 3% pc, P = 0.012; 0% vs. 10%, P = 4 x 10⁻⁹; 3% nc vs. 3% pc, P = 0.0011; 3% nc vs. 10%, P = 4 x 10⁻⁹; 3% pc vs. 10%, P = 1 x 10⁻⁷, ANOVA with post hoc Tukey-Kramer test. (H) Mean lick density relative to the time of reinforcement, plotted separately for each reinforcement type. (I) Consummatory licks per reward for each reinforcement type, normalized by the number in 0% blocks. Open circles, individual sessions; bar, mean ± s.e.m; Main effect of reinforcement type (F3,114 = 9.0; P = 6 x 10⁻⁸), comparisons: 0% vs. 3% pc, P = 0.02; 0% vs. 10%, P = 5 x 10⁻⁷; 3% nc vs. 10%, P = 2 x 10⁻⁶; 3% pc vs. 10%, P = 0.03, ANOVA with post hoc Tukey-Kramer test. (J) A separate cohort of mice was trained on a variant of the task with the same FR10-FI5 schedule, however reinforcement type was randomized for each reward. Open circles, individual sessions; bar, mean ± s.e.m; Main effect of reinforcement type (F2,26 = 25.0; P = 9 x 10⁻⁷), comparisons: 0% vs. 10%, P = 8 x 10⁻⁷; 3% vs. 10%, P = 1 x 10⁻⁴, ANOVA with post hoc Tukey-Kramer test. (K) Another separate cohort of mice was trained on a variant of task in which the reinforcement types were 0, 0.23, and 1 mM sucralose. (L) Similar to (H) except for sucralose task. Main effect of reward type (F3,105 = 10.6; P = 4 x 10⁻⁶), comparisons: 0 vs. 1.00, P = 0.0006; 0.23 nc vs. 0.23 pc, P = 0.006; 0.23 nc vs. 1.00, P = 8 x 10⁻⁶, ANOVA with post hoc Tukey-Kramer test. (M) Similar to (I) except for sucralose task. Main effect of reward type (F3,105 = 15.9; P = 1 x 10⁻⁸), comparisons: 0 vs. 1.00, P = 2 x 10⁻⁸; 0.23 nc vs. 1.00, P = 9 x 10⁻⁶; 0.23 pc vs. 1.00, P = 1 x 10⁻⁴, ANOVA with post hoc Tukey-Kramer test. Sample sizes were 39 sessions from 39 mice (F – I), 14 sessions from 2 mice (J), and 39 sessions from 9 mice (K – M). * P < 0.05, ** P < 0.01, *** P < 0.001. In the list above, if a potential post hoc comparison was unnoted, P ≥ 0.05.
Figure 2:
Figure 2:. Motivational anhedonia as a sustained phenotype in susceptible, but not resilient, mice.
(A) Timeline of the chronic social defeat stress and behavioral experiments. (B) Based on the social interaction ratio, mice subjected to social defeat were divided into resilient and susceptible individuals. Controls were handled but did not experience social defeat. Each circle in the beeswarm plot represents an animal. (C) Example movement trajectories for a susceptible and a resilient individual, when the CD1 aggressor mouse was present or absent in the interaction zone (red rectangle). (D) Rewards earned for each reinforcement type, normalized by rewards earned in 0% blocks, per session, for control animals. For each animal, the value was an average across days according to three stages: “pre” for day −1 and 1, “stress” for day 5, 7, and 9, and “post” for day 11 and 13. Gray line, individual animal; bar, mean ± s.e.m. Main effect of reinforcement type (F2,117 = 21.4, P = 1 x 10⁻⁸), but not for stage (F2,117 = 0.57, P = 0.6) or interaction (F4,117 = 0.16, P = 1), ANOVA with reinforcement type and stage as fixed factors, subject as random factor. (E) Similar to (D) for susceptible animals. Main effect of reinforcement type (F2,90 = 20.0, P = 7 x 10⁻⁸) and stage (F2,90 = 6.16, P = 0.003), but not interaction (F4,90 = 1.28, P = 0.3), with comparisons: pre vs. stress, P = 0.005; pre vs. post P = 0.02; stress vs. post, P = 0.9, ANOVA with reinforcement type and stage as fixed factors, subject as random factor, and post hoc Tukey-Kramer test. (F) Similar to (D) for resilient animals. Main effect of reinforcement type (F2,126 = 40.6, P = 3 x 10⁻¹⁴), stage (F2,126 = 5.05, P = 0.008), but not interaction (F4,126 = 1.70, P = 0.2), with comparisons: pre vs. stress, P = 0.013; pre vs. post, P = 1; stress vs. post, P = 0.02, ANOVA with reinforcement type and stage as fixed factors, subject as random factor, and post hoc Tukey-Kramer test. Sample sizes were 14 mice (D), 11 mice (E), and 15 mice (F). * P < 0.05, ** P < 0.01, *** P < 0.001.
Figure 3:
Figure 3:. A model of self-paced, instrumental sucrose preference based on motivational vigor
(A) Schematic of the model. Animal should select a response time that minimizes the total cost. Total cost is the sum of an energetic cost, incurred if actions have to be performed in quick succession, and an opportunity cost, incurred when potential rewards are delayed due to inaction. The opportunity cost depends on the expected reinforcement type, and a marginal utility term for diminishing returns due to satiation. From the optimal response time, we could estimate the number of completed actions per block. (B) Task performance and model fit for an example session on day −1. (C) Similar to (B) on day 9 for the same animal. (D) The opportunity cost coefficients determined by fitting model to individual sessions for control animals. Line, mean ± s.e.m. Shading, days with social defeat. Main effect of reinforcement type (F2,305 = 14.0, P = 2 x 10⁻⁶), but not for day (F11,305 = 1.33, P = 0.2) or interaction (F22,305 = 0.541, P = 1), ANOVA with reinforcement type and day as fixed factors, subject as random factor. (E) Similar to (D) for susceptible animals. Main effect of reinforcement type (F2,269 = 8.43, P = 3 x 10⁻⁴) and day (F10,269 = 4.82, P = 3 x 10⁻⁶), but not for interaction (F20,269 = 0.983, P = 0.48), ANOVA with reinforcement type and day as fixed factors, subject as random factor. Comparisons: for the c10 parameter, versus day −1, P = 1.0 for day 1; P = 1.0 for day 3; P = 0.06 for day 5; P = 0.04 for day 7; P = 0.02 for day 9; P = 0.04 for day 11; P = 0.7 for day 13, from post hoc Tukey-Kramer test. (F) Similar to (D) for resilient animals. Main effect of reinforcement type (F2,344 = 13.8, P = 2 x 10⁻⁶) and day (F11,344 = 3.39, P = 2 x 10⁻⁴), but not for interaction (F22,344 = 0.544, P = 1.0), ANOVA with reinforcement type and day as fixed factors, subject as random factor. Comparisons: for the c10 parameter, versus day −1, P = 1.0 for day 1; P = 1.0 for day 3; P = 0.1 for day 5; P = 0.4 for day 7; P = 0.5 for day 9; P = 1.0 for day 11; P = 1.0 for day 13, from post hoc Tukey-Kramer test. (G) The opportunity cost coefficient for the 10% sucrose reinforcement. On an animal-by-animal basis, the mean pre-stress values are plotted against the during-stress values. For susceptible animals, correlation coefficient = 0.77, P = 0.006. For resilient animals, correlation coefficient = 0.43, P = 0.1. Each circle in the scatter plot represents an animal. Black crosshair, mean ± s.e.m. (H) The change-point parameter for the marginal utility, determined by fitting model to individual sessions for control animals. Line, mean ± s.e.m. Shading, days with social defeat. No effect of day (F11,101 = 0.416, P = 1), ANOVA with day as fixed factor, subject as random factor. (I) Similar to (H) for susceptible animals. Main effect of day (F10,89 = 3.89, P = 3 x 10⁻⁴), ANOVA with day as fixed factor, subject as random factor. Comparisons: versus day −1, P = 1.0 for day 1; P = 0.07 for day 3; P = 0.07 for day 5; P = 0.008 for day 7; P = 0.004 for day 9; P = 0.2 for day 11; P = 1.0 for day 13, from post hoc Tukey-Kramer test. (J) Similar to (H) for resilient animals. Main effect of day (F11,114 = 5.00, P = 3 x 10⁻⁶), ANOVA with day as fixed factor, subject as random factor. Comparisons: versus day −1, P = 1.0 for day 1; P = 0.08 for day 3; P = 0.05 for day 5; P = 0.0006 for day 7; P = 0.0001 for day 9; P = 0.1 for day 11; P = 1.0 for day 13, from post hoc Tukey-Kramer test. Sample sizes were 14 mice (D, H), 11 mice (E, I), 15 mice (F, J). * P < 0.05, ** P < 0.01, *** P < 0.001.
Figure 4:
Figure 4:. Chronic social defeat had only transient effect on consummatory actions
(A) Top, lick raster, chosen randomly from 10 trials of each reinforcement type from a session on day - 1. Bottom, mean lick density relative to the time of reinforcement, plotted separately for each reinforcement type, for the same session. (B) Similar to (A) on day 9 for the same animal. (c) Consummatory licks per reward for each reinforcement type, normalized by the number in 0% blocks, for control animals. For each animal, the value was an average across days according to three stages: “pre” for day −1 and 1, “stress” for day 5, 7, and 9, and “post” for day 11 and 13. Gray line, individual animal; bar, mean ± s.e.m. Main effect of reinforcement type (F2,117 = 6.49, P = 0.002), but not for stage (F2,117 = 0.99, P = 0.4) or interaction (F4,117 = 0.28, P = 0.9), ANOVA with reinforcement type and stage as fixed factors, subject as random factor. (D) Similar to (C) for susceptible animals. Main effect of reinforcement type (F2,90 = 3.35, P = 0.04) and stage (F2,90 = 3.30, P = 0.04), but not interaction (F4,90 = 0.22, P = 0.9), with comparisons: pre vs. stress, P = 0.048; pre vs. post P = 0.9; stress vs. post, P = 0.2, ANOVA with reinforcement type and stage as fixed factors, subject as random factor, and post hoc Tukey-Kramer test. (E) Similar to (C) for resilient animals. Main effect of reinforcement type (F2,126 = 13.3, P = 5 x 10⁻⁶), but not stage (F2,126 = 1.27, P = 0.3) or interaction (F4,126 = 0.39, P = 0.8), ANOVA with reinforcement type and stage as fixed factors, subject as random factor. Sample sizes were 14 mice (C, D), 11 mice (E, F), and 15 mice (G, H). * P < 0.05.
Figure 5:
Figure 5:. Longitudinal imaging of spontaneous activity of layer 2/3 pyramidal neurons in Cg1/M2
(A) Timeline of the experiments. (B) A fixed coronal section showing the extent of virally mediated expression of GCaMP6s-mRuby2 in Cg1/M2. (C) In vivo two-photon images from an awake, head-fixed mouse for GCaMP6s (green) and mRuby2 (red) in pyramidal neurons in Cg1/M2. The images were taken 6 days apart. (D) Spontaneous fluorescence transients for an example cell from (C), recorded 2 days apart across 7 sessions spanning 13 days during a social defeat experiment. The insets show a still frame of the in vivo GCaMP6s and mRuby2 fluorescence on the corresponding days. (E) Similar to (D) for two other cells.
Figure 6:
Figure 6:. Social defeat rapidly alters the prefrontal cortical activity
(A) The timeline for experiments to determine the impact of social defeat stress on prefrontal cortical activity. The shaded green area represents the time window used for analysis of the short-term effects. (B) Based on the social interaction ratio, mice subjected to social defeat were divided into resilient and susceptible individuals. Controls were handled but did not experience social defeat. Each circle represents an animal. Note that the imaging animals were a new cohort and not part of the behavior-only study. (C) Baseline rate of calcium events on day −1 for control, susceptible, and resilient animals. Filled circles, median; bar, 25th and 75th percentiles. Control versus susceptible: P = 0.6, control versus resilient: P = 0.4, susceptible versus resilient: P = 0.4, Wilcoxon rank-sum test. Control versus susceptible: P = 0.2, control versus resilient: P = 0.01, susceptible versus resilient: P = 1 x 10⁻⁴, Kolmogorov-Smirnov test. (D) Change in neural activity from day −1 to 1 for control, susceptible, and resilient animals. The activity change was a normalized difference in the rate of events inferred from fluorescence transients, calculated separately for each cell. Filled circles, median; bar, 25th and 75th percentiles. Control versus susceptible: P = 0.002, control versus resilient: P = 0.3, susceptible versus resilient: P = 0.0001, Wilcoxon rank-sum test. (E) Histogram of the neural activity change from day −1 to 1 for control, susceptible, and resilient animals. Control versus susceptible: P = 2.1 x 10⁻⁵, control versus resilient: P = 0.005, susceptible versus resilient: P = 6.1 x 10⁻⁶, Kolmogorov-Smirnov test. Sample sizes for (C - E) were 62 cells from 4 control animals, 86 cells from 4 susceptible animals, and 59 cells from 3 resilient animals. ** P < 0.01, *** P < 0.001.
Figure 7:
Figure 7:. Social defeat induces heterogeneous long-term activity changes in the prefrontal cortex
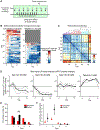
(A) The timeline for experiments to determine the impact of social defeat stress on prefrontal cortical activity. The shaded green area represents the time window used for analysis of the long-term effects. (B) Heatmaps showing the change in spontaneous activity relative to the pre-stress baseline. Each row is a cell. The left and right heatmaps contain the 58 cells from 4 susceptible animals and 35 cells from 3 resilient animals respectively. Red indicates an increase in spontaneous activity relative to pre-stress day −1. Blue indicates a decrease. (C) The dendrogram and pairwise similarity matrix for the hierarchical clustering with Euclidean distance as the distance metric on the entire data set of 93 cells. (D) Cells were classified as Type 1 – 4 based on the cluster membership identified by the hierarchical procedure. For each Type, the change in spontaneous activity was averaged across cells. Solid line, median. Dotted lines, 20th and 80th percentiles. (E) Proportion of cells in susceptible or resilient animal that was classified as Type 1 – 4. Comparing the proportions between susceptible and resilient animals, the difference was significant for Type 2 (P = 0.002, chi-square test), and did not reach significance for Type 1 (P = 0.49), Type 3 (P = 0.05), and 4 (P = 0.20). (F) Baseline rate of calcium events on day −1 in susceptible or resilient animals for Type 1 – 4 cells. Filled circles, median; bar, 25th and 75th percentiles. Two-way ANOVA with factors of cell type and animal group. Main effect of cell type (F3,85 = 14.0; P = 2 x 10⁻⁷), but not for animal group (F1,85 = 2.0; P = 0.2) or interaction (F3,85 = 2.0; P = 0.1). Post hoc Tukey-Kramer comparisons: Type 1 vs. 2, P = 0.0005; Type 1 vs. 3, P = 0.04; Type 1 vs. 4, P = 0.3; Type 2 vs. 3, P = 6 x 10⁻⁷; Type 2 vs. 4, P = 0.002; Type 3 vs. 4, P = 1.

Comment in

References

    1. Kendler KS, Karkowski LM, Prescott CA (1999): Causal relationship between stressful life events and the onset of major depression. Am J Psychiatry. 156:837–841. - PubMed
    1. McEwen BS (2004): Protection and damage from acute and chronic stress: allostasis and allostatic overload and relevance to the pathophysiology of psychiatric disorders. Ann N Y Acad Sci. 1032:1–7. - PubMed
    1. McEwen BS, Stellar E (1993): Stress and the individual. Mechanisms leading to disease. Arch Intern Med. 153:2093–2101. - PubMed
    1. Arnsten AF (2009): Stress signalling pathways that impair prefrontal cortex structure and function. Nat Rev Neurosci. 10:410–422. - PMC - PubMed
    1. Hollon NG, Burgeno LM, Phillips PE (2015): Stress effects on the neural substrates of motivated behavior. Nat Neurosci. 18:1405–1412. - PMC - PubMed

Publication types