. 2020 Apr 10;5(46):eaax0062.
doi: 10.1126/sciimmunol.aax0062.

Gut-resident CX3CR1hi macrophages induce tertiary lymphoid structures and IgA response in situ

Affiliations

Gut-resident CX3CR1hi macrophages induce tertiary lymphoid structures and IgA response in situ

Balázs Koscsó et al. Sci Immunol. .

Abstract

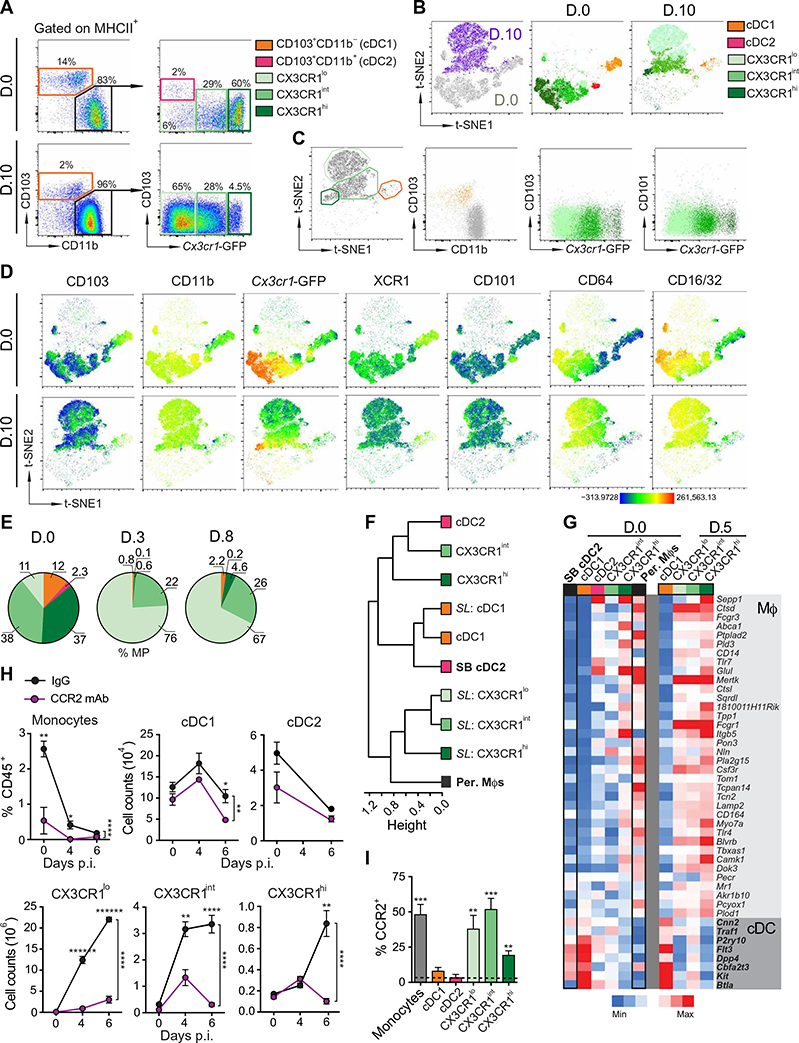
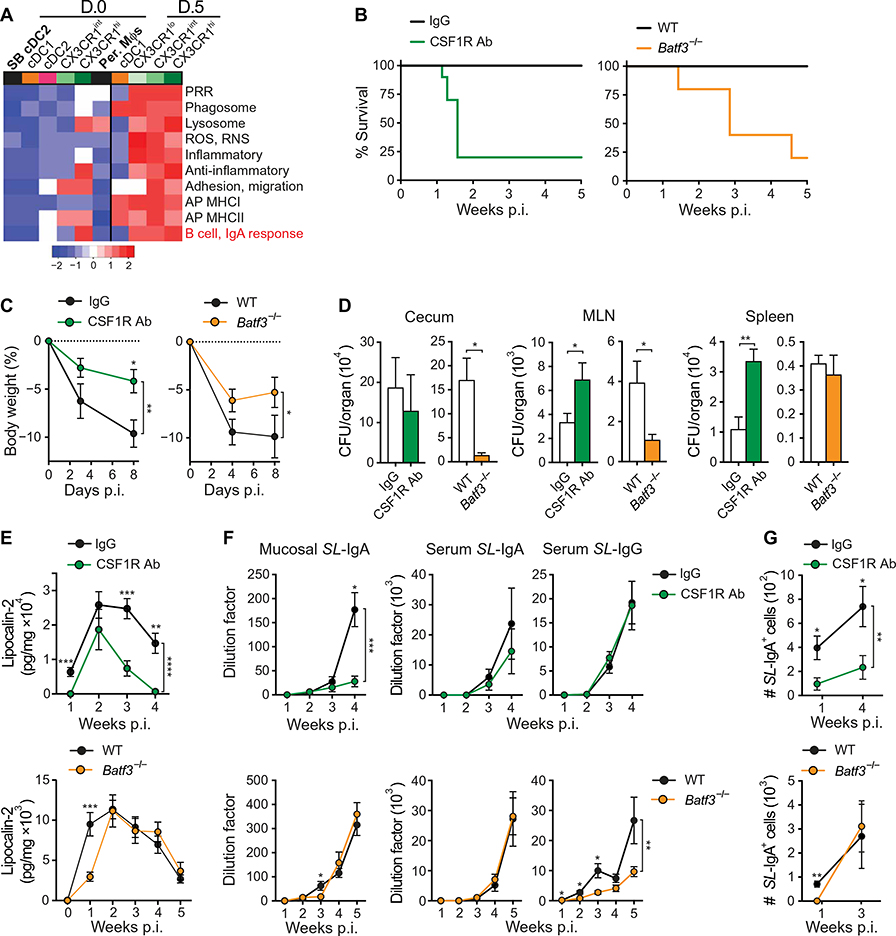
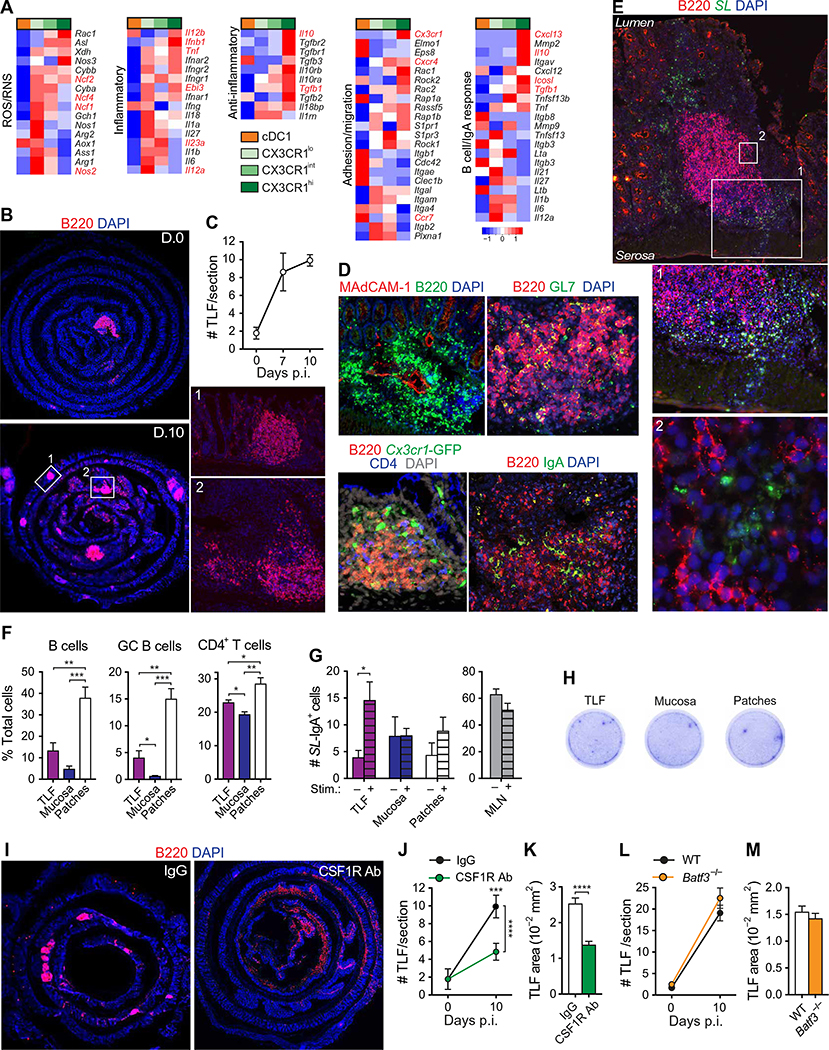
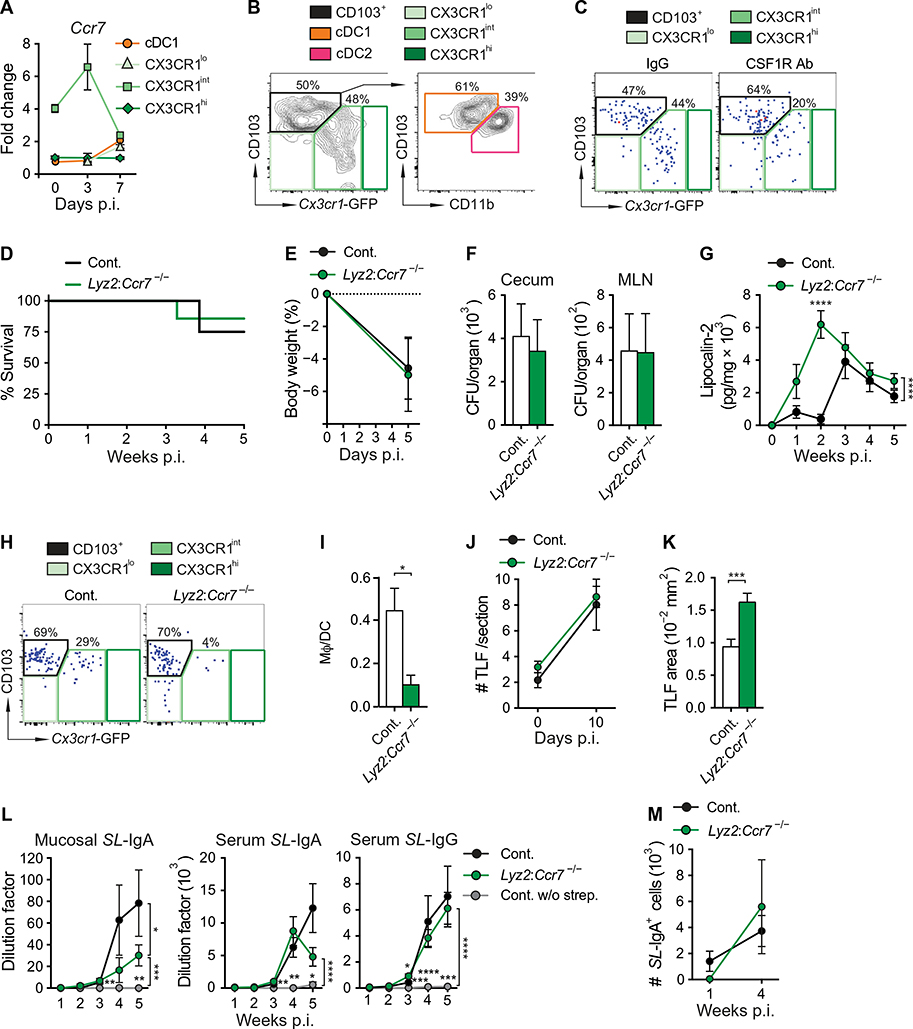
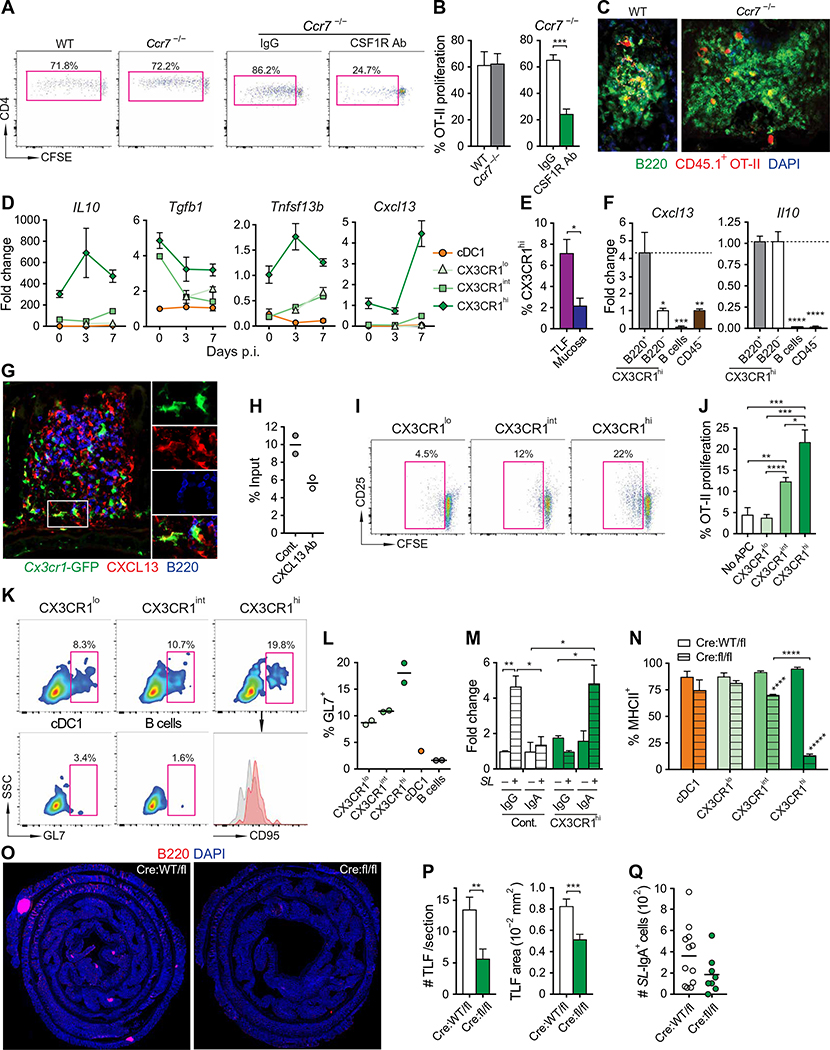
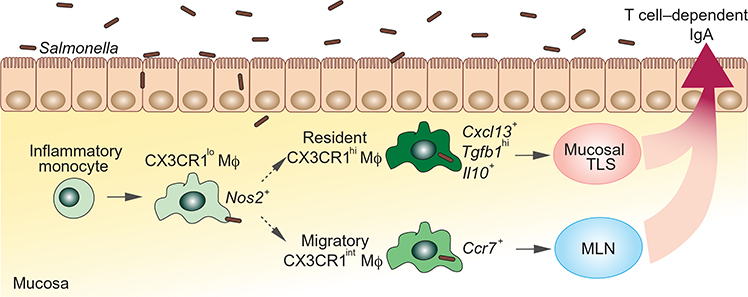
Intestinal mononuclear phagocytes (MPs) are composed of heterogeneous dendritic cell (DC) and macrophage subsets necessary for the initiation of immune response and control of inflammation. Although MPs in the normal intestine have been extensively studied, the heterogeneity and function of inflammatory MPs remain poorly defined. We performed phenotypical, transcriptional, and functional analyses of inflammatory MPs in infectious Salmonella colitis and identified CX3CR1+ MPs as the most prevalent inflammatory cell type. CX3CR1+ MPs were further divided into three distinct populations, namely, Nos2 +CX3CR1lo, Ccr7 +CX3CR1int (lymph migratory), and Cxcl13 +CX3CR1hi (mucosa resident), all of which were transcriptionally aligned with macrophages and derived from monocytes. In follow-up experiments in vivo, intestinal CX3CR1+ macrophages were superior to conventional DC1 (cDC1) and cDC2 in inducing Salmonella-specific mucosal IgA. We next examined spatial organization of the immune response induced by CX3CR1+ macrophage subsets and identified mucosa-resident Cxcl13 +CX3CR1hi macrophages as the antigen-presenting cells responsible for recruitment and activation of CD4+ T and B cells to the sites of Salmonella invasion, followed by tertiary lymphoid structure formation and the local pathogen-specific IgA response. Using mice we developed with a floxed Ccr7 allele, we showed that this local IgA response developed independently of migration of the Ccr7 +CX3CR1int population to the mesenteric lymph nodes and contributed to the total mucosal IgA response to infection. The differential activity of intestinal macrophage subsets in promoting mucosal IgA responses should be considered in the development of vaccines to prevent Salmonella infection and in the design of anti-inflammatory therapies aimed at modulating macrophage function in inflammatory bowel disease.


Conflict of interest statement

Competing interests: The authors declare that they have no competing interests.

Figures

Fig. 1.
Fig. 1.. Inflammatory CX3CR1+ MPs are composed of CX3CR1lo, CX3CR1int, and CX3CR1hi Mϕ subsets.
Cx3cr1GFP/WT (F1 of B6 × 129S1) and Ccr2RFP/WTCx3cr1GFP/WT mice were infected with SL1344 as described in Materials and Methods. (A) Flow cytometry dot plots show phenotypes and percentages of MPs in the normal [day 0 (D.0)] and infected [day 10 after infection (p.i.)] LB. Gated on total MPs defined as viable CD45+CD11blo/hiCD11clo/hiMHCII+ populations (fig. S2A). (B) t-SNE flow cytometry plots define phenotypes of all MP subsets in the normal (day 0) and infected (day 10 after infection) colon. Gated on total MPs as in (A). (C) Flow cytometry dot plots show the phenotype of MP populations identified using unbiased t-SNE analysis. (D) t-SNE heat maps show levels of CD103, CD11b, Cx3cr1-GFP, XCR1, CD101, CD64, and CD16/32 expression by MP subsets in normal (day 0) and inflamed LB (day 10 after infection) based on t-SNE analysis in (B). (E) Pie charts show percentages of each MP subset among total MPs in the normal (day 0) and infected (days 3 and 8 after infection) LB. (F) Hierarchy of MP populations based on RNA-seq analysis of MP subsets isolated by FACS from the normal (day 0) and infected (day 5 after infection) LB as compared with controls: SB cDC2 and peritoneal (Per.) Mϕs isolated from normal mice on the same background. The height at which any two samples are joined in the dendrogram indicates the distance between them. Samples clustered close to each other are more similar than others. (G) RNA-seq heat map shows levels of Mϕ- and cDC-specific genes expressed by MP subsets isolated by FACS from the normal (day 0) and infected (day 5 after infection) LB as compared with controls: SB cDC2 and peritoneal Mϕs isolated from normal mice on the same background. (H) Uninfected (day 0) and Salmonella-infected mice were treated with CCR2 mAb to deplete monocytes or control IgG as described in Materials and Methods. Graphs show cell counts of LB MPs and percentages of blood Ly6Chi monocytes (n = 3 to 6). (I) Percentages (%) of CCR2+ cells (identified as RFP+ cells) among blood monocyte and LB MP populations in Ccr2RFP/WTCx3cr1GFP/WT mice infected with Salmonella (day 8 after infection) (n = 3 to 4). Graphs show means ± SEM from the combination of two independent experiments. Statistical analysis: two-way ANOVA, *P < 0.05, **P < 0.01, ****P < 0.0001, and ******P < 0.000001.
Fig. 2.
Fig. 2.. CX3CR1+ Mϕ subsets are required for the development of the mucosal Salmonella-specific IgA response.
Cx3cr1GFP/WT mice (F1 of B6 × 129S1) were infected with SL1344 (A). WT mice were injected with CSF1R mAb to deplete Mϕs (CSF1R Ab) or control IgG before infection with SL1344 (B to G). Batf3−/− mice were used as a cDC1-deficient model, and their WT littermates were used as control (B to G). Mice were rescued with ampicillin (E to G). (A) RNA-seq heat map shows expression levels of the indicated pathways by MP subsets isolated by FACS from normal (day 0) and infected (day 5 after infection) LB as compared with controls: SB cDC2 and peritoneal Mϕs isolated from normal mice on the same background (see the Supplementary Materials for statistical analysis). AP, antigen presentation. (B) Survival curves of mice treated with IgG or CSF1R Ab (left) and WT and Batf3−/− mice (right) (n = 5 to 10). (C) Weight loss as percentage of body weight at day 0 of mice treated with IgG or CSF1R Ab (left) and WT and Batf3−/− mice (right) (n = 7 to 9). (D) Salmonella CFU in the cecum (day 1 after infection), MLNs (day 2 after infection), and spleen (day 6 after infection) of mice treated with IgG or CSF1R Ab (left) and WT and Batf3−/− mice (right) (n = 4 to 10). (E) Lipocalin-2 titers in fecal pellets of infected mice treated with IgG or CSF1R Ab (top) and WT and Batf3−/− mice (bottom) (n = 7 to 10). (F) Salmonella (SL)-specific antibody titers in fecal pellets (mucosal IgA) and blood (serum IgA and IgG) in infected mice treated with IgG or CSF1R Ab (top) and WT and Batf3−/− mice (bottom) (n = 4 to 8). (G) Numbers of Salmonella-specific IgA-producing cells in the LB of infected mice treated with IgG or CSF1R Ab (top) and WT and Batf3−/− mice (bottom) as measured by ELISpot (n = 5 to 7). Graphs show means ± SEM and are representative or combination of at least two independent experiments. Statistical analysis: Student’s t test or two-way ANOVA, *P < 0.05, **P < 0.01, and ***P < 0.001.
Fig. 3.
Fig. 3.. CX3CR1+ Mϕ subsets are required for the development of TLSs, which serves as a site for Salmonella-specific IgA response.
WT and Cx3cr1GFP/WT mice (A to H), CSF1R Ab and control IgG treated mice (I to K), and Batf3−/− and WT mice (L and M) were infected with WT Salmonella SL1344. (A) RNA-seq heat maps show expression levels of genes related to the indicated pathways by MP subsets isolated by FACS from infected (day 5 after infection) LB (see the Supplementary Materials for statistical analysis). (B) Representative images of cross sections of colonic Swiss rolls stained with B220 (B cells; red) mAb and 4′,6-diamidino-2-phenylindole (DAPI) (nuclei; blue). Colons were obtained from WT uninfected (day 0) and infected (day 10 after infection) mice. (C) Statistical summary of (B) shows number of TLS follicles (TLF) per section before and after infection (n = 3 to 4). (D) Top left: Colonic cross sections from WT mice (day 10 after infection) were stained with B220 (B cells; green) and MAdCAM1 [high endothelial venules (HEV); red] antibodies and DAPI (nuclei; blue). Bottom left: Colonic cross sections from Cx3cr1GFP/WT mice (day 10 after infection) were stained with B220 (B cells; red) and CD4 (CD4T cells; blue) mAbs and DAPI (nuclei; gray). Top right: Colonic cross sections from WT mice (day 10 after infection) were stained with B220 (B cells; red) and GL7 (GC B cells; green) mAbs and DAPI (nuclei; blue). Bottom right: Colonic cross sections from WT mice (day 10 after infection) were stained with B220 (B cells; red) and IgA (IgA+ B cells; green) mAbs and DAPI (nuclei; blue). (E) Colonic cross sections from WT mice (day 10 after infection) were stained with B220 (B cells; red) and Salmonella-specific (SL; green) antibodies and DAPI (nuclei; blue). (F) Statistical summary of flow cytometry data shows proportions of B220+ B cells, GL7+CD95+ GC B cells, and CD4+ T cells among live cells in single-cell suspension prepared from macroscopic TLSs, remaining mucosa, and colonic and cecal patches of LB isolated from an infected WT mouse (day 14 after infection) (n = 4). (G) Numbers of Salmonella-specific IgA-producing cells [unstimulated or stimulated (Stim.) with anti-CD40 mAb, BAFF, and IL-21] in TLSs, mucosa, LB patches, and MLNs (per 105 plated total cells) isolated from a WT mouse (day 14 after infection) (n = 3 to 6). (H) Images of ELISpot wells from a representative experiment described in (G); cells stimulated with anti-CD40 mAb, BAFF, and IL-21. (I) Representative images of cross sections of colonic Swiss rolls from infected (day 10 after infection) control (IgG) and CSF1R Ab mice stained with B220 (B cells; red) mAb and DAPI (nuclei; blue). (J) Numbers of follicles per colonic section in control (IgG) and CSF1R Ab mice before and after infection (n = 3 to 4). (K) Area of follicles in colonic sections of control (IgG) and CSF1R Ab mice (day 10 after infection) (n = 3 to 4). (L) Numbers of follicles per colonic section in WT and Batf3−/− mice before and after infection (n = 3 to 6). (M) Area of follicles in colonic sections of WT and Batf3−/− mice (day 10 after infection) (n = 3 to 6). Graphs show means ± SEM and are representative or combination of at least two independent experiments. Statistical analysis: Student’s t test, *P < 0.05, **P < 0.01, ***P < 0.001, and ****P < 0.0001.
Fig. 4.
Fig. 4.. Antigen presentation by CX3CR1+ Mϕ subsets is required for the development of TLSs and the mucosal Salmonella-specific IgA response.
H2-Ab1fl/fl (Cont.) and Lyz2Cre/WTH2-Ab1fl/fl (Lyz2:MHCII−/−) mice were infected with SL1344. Mice were rescued with ampicillin (D to F). (A) Survival curves (n = 4 to 7). (B) Weight loss as a percentage of body weight at day 0 (n = 7 to 10). (C) Salmonella CFU in the cecum (day 1 after infection), MLNs (day 2 after infection), and spleen (day 2 after infection) of Cont. and Lyz2:MHCII−/− mice (n = 6 to 12). (D) Lipocalin-2 titers in fecal pellets of infected control and Lyz2:MHCII−/− mice (n = 6 to 10). (E) Salmonella-specific antibody titers in fecal pellets (mucosal IgA) and blood (serum IgA and IgG) in infected control and Lyz2:MHCII−/− mice (n = 6 to 10). (F) Numbers of Salmonella-specific IgA-producing cells in the LB of control and Lyz2:MHCII−/− mice as measured by ELISpot (n = 4 to 5). (G) Representative images of cross sections of colonic Swiss rolls stained with B220 (B cells; red) and DAPI (nuclei; blue), day 10 after infection. (H) Numbers of follicles per colonic section before and after infection in control and Lyz2:MHCII−/− mice (day 10 after infection) (n = 2 to 7). (I) Area of follicles in colonic sections of control and Lyz2:MHCII−/− mice (day 10 after infection) (n = 7). (J) Numbers of total B and GC B cells in the LB before and after infection in control and Lyz2:MHCII−/− mice (n = 4 to 5). (K) Numbers of total CD4+ T and Tfh cells in control and Lyz2:MHCII−/− mice (day 10 after infection) (n = 4). Graphs show means ± SEM and are representative or combination of at least two independent experiments. Statistical analysis: Student’s t test or two-way ANOVA. *P < 0.05, **P < 0.01, ***P < 0.001, and ****P < 0.0001.
Fig. 5.
Fig. 5.. Migration of CX3CR1int Mϕs to the MLNs is not required for TLS formation and function.
Ccr7fl/fl (Cont.) and Lyz2Cre/WTCcr7fl/fl (Lyz2:Ccr7−/−) mice and other indicated mouse strains were infected with SL1344. Mice were rescued with ampicillin in drinking water (F, K, and L). (A) Kinetics of Ccr7 expression by MP subsets isolated by FACS from the normal and infected LB from Cx3cr1GFP/WT mice (F1 of B6 × 129S1) as measured by quantitative polymerase chain reaction (qPCR). Data show fold change over CX3CR1hi Mϕs at day 0 (n = 3 to 6). (B) Flow cytometry zebra plots show percentages of cDC and Mϕ subsets in the lymph collected from pre-MLN lymphatic vessels of WT mice (day 9 after infection). Gated on total viable CD45+CD11blo/hiCD11clo/hiMHCII+ MPs. (C) Flow cytometry dot plots show percentages of cDC and Mϕ subsets in the lymph collected from pre-MLN lymphatic vessels of mice treated with control and CSF1R Ab (day 11 after infection). Gated on total viable CD45+CD11blo/hiCD11clo/hiMHCII+ MPs. (D) Survival curves of control and Lyz2:Ccr7−/− mice (n = 4 to 7). (E) Weight loss as a percentage of day 0 in control and Lyz2:Ccr7−/− mice (n = 8 to 9). (F) Salmonella CFU in the cecum and MLNs of control and Lyz2:Ccr7−/− mice at day 1 after infection (n = 4 to 5). (G) Lipocalin-2 titers in fecal pellets of infected control and Lyz2:Ccr7−/− mice (n = 8 to 9). (H) Flow cytometry dot plots show percentages of cDC and Mϕ subsets in the lymph collected from pre-MLN lymphatic vessels of infected control and Lyz2:Ccr7−/− mice (day 4 after infection) mice. Gated on total viable CD45+CD11blo/hiCD11clo/hiMHCII+ MPs. (I) Statistical summary of (G) shows the ratio of percentage of CD103+ cDCs and CX3CR1int Mϕ subsets among MHCII+ MPs in lymph from control and Lyz2:Ccr7−/− mice (n = 5 to 6). (J) Numbers of follicles per colonic section in control and Lyz2:Ccr7−/− mice before and after infection (n = 3 to 8). (K) Area of follicles in colonic sections of control and Lyz2:Ccr7−/− mice (day 10 after infection) (n = 3 to 8). (L) Salmonella-specific antibody titers in fecal pellets (mucosal IgA) and blood (serum IgA and IgG) in infected control and Lyz2:Ccr7−/− mice and negative control mice infected without streptomycin pretreatment (Cont. w/o strep.) (n = 6 to 9). (M) Numbers of Salmonella-specific IgA-producing cells as measured by ELISpot in the LB of infected control and Lyz2:Ccr7−/− mice (n=4 to 10). Graphs show means ± SEM and are representative or combination of at least two independent experiments. Statistical analysis: Student’s t test or two-way ANOVA, *P < 0.05, **P < 0.01, ***P < 0.001, and ****P < 0.0001.
Fig. 6.
Fig. 6.. Mucosa-resident CX3CR1hi Mϕs induce TLS associated T and B cell/IgA responses.
Mice were infected with WT SL1344 (SL) or OVA-expressing SL1344 (SL-OVA) where indicated. (A) WT, Ccr7/, Ccr7/ control (injected with IgG), and Ccr7/ mice injected with CSF1R mAb were infected with SL-OVA the day before receiving CFSE-labeled congenic CD45.1+ OT-II T cells. Representative flow cytometry dot plots show percentages of CFSE low cells among total CD45.1+Vα2+CD4+CCR9 T cells in the LB on day 5 after infection. (B) Statistical summary of (A) (n = 3 to 5). (C) Colonic sections (day 7 after infection) from WT and Ccr7−/− mice described in (A) were stained with B220 (B cells; green) and CD45.1 (OT-II T cells; red) mAbs and DAPI (blue). (D) Kinetics of II10, Tgfb, Tnfsf13b (BAFF), and CxcI13 expression by MP subsets isolated by FACS from the normal (day 0) and infected LB as measured by qPCR Data shows fold change over control (day 0) cDC1 (II10 and Tgfb) or control (day 0) CX3CR1hi Mϕs (Tnfsf13b and CxcI13) (n = 3 to 5). (E) Statistical summary of flow cytometry data shows proportions of B220+ cells among CX3CR1hi Mϕs in TLSs or mucosa of infected LB isolated from a WT mouse (day 14 after infection) (n=4 to 6). (F) CxcI13 and II10 expression by B220+ and B220 CX3CRhi Mϕs subsets, B cells, and CD45 stromal cells FACS-isolated from the infected LB (day 7 after infection) as measured by qPCR. Data show fold change over B220CX3CRhi Mϕs (n = 3 to 6). (G) Colonic cross sections from Cx3cr1GFP/WT mice (day 10 after infection) were stained with CXCL13 (red) and B220 (B cells; blue) antibodies and DAPI (nuclei; gray). (H) Migration of B220+ B cells in transwell experiments cultured with CX3CRhi Mϕs FACS-isolated from infected LB (day 12 after infection), in presence or absence of CXCL13-blocking antibody (CXCL13 Ab). Data are shown as a percentage of input (n = 2). (I) MP subsets isolated from LB of infected Cx3cr1GFP/WT mice (day 5 after infection) were cocultured in vitro with CFSE-labeled OT-II CD4+ T cells in the presence of 2 × 10⁶ CFU of HK SL-OVA. Representative flow cytometry dot plots show percentages of proliferating CFSE low cells among OT-II Vα2+CD4+ T cells on day 4 of coculture. (J) Statistical summary of (I) (n = 5). (K) B220+ B cells (negative control) or MP subsets isolated from LB of infected Cx3cr1GFP/WT mice (day 5 after infection) were cocultured with naïve splenic B cells from an uninfected congenic CD45.1+ donor. Representative flow cytometry plots show percentages of GL7+ cells among total CD45.1+B220+ B cells. Histogram compares CD95 expression by GL7 (gray) and GL7+ (red) CD45.1+B220+ B cells. (L) Summary of (K) (n = 2). (M) IgG and IgA levels in supernatants of naïve splenic B cells cultured alone (Cont.) or cocultured with CX3CR1hi Mϕs isolated from LB of infected Cx3cr1GFP/WT mice (day 5 after infection) in the presence or absence of SL1344 (SL). Data show fold change over B cells cultured alone without SL (n = 3). (N) Statistical summary of flow cytometry data show proportions of MHCII+ cells among MP populations in the LB isolated from tamoxifen-treated Cx3cr1CreER/WTH2-Ab1WT/fl (Cre:WT/fl) or Cx3cr1CreER/WTH2-Ab1fl/fl (fl/fl) mice (Crefl/fl) (day 7 after infection) (n = 4). (O) Representative images of cross sections of colonic Swiss rolls from tamoxifen-treated Cx3cr1CreER/WTH2-Ab1WT/fl (WT/fl) or Cx3cr1CreER/WTH2-Ab1fl/fl (fl/fl) mice stained with B220 (B cells; red) and DAPI (nuclei; blue), day 7 after infection. (P) Numbers and area of follicles in colonic section of tamoxifen-treated Cx3cr1CreER/WTH2-Ab1WT/fl (Cre:WT/fl) or Cx3cr1CreER/WTH2-Ab1fl/fl (Cre:fl/fl) mice (day 7 after infection) (n = 6 to 8). (Q) Numbers of Salmonella-specific IgA-producing cells as measured by ELISpot in the LB of tamoxifen-treated Cx3cr1CreER/WTH2-Ab1WT/fl (WT/fl) or Cx3cr1CreER/WTH2-Ab1fl/fl (fl/fl) mice (day 7 after infection) (n = 8 to 12). Graphs show means ± SEM and are representative or combination of at least two independent experiments. Statistical analysis: Student’s t test or two-way ANOVA, *P < 0.05, **P < 0.01, ***P < 0.001, and ****P < 0.0001.
Fig. 7.
Fig. 7.. Proposed model of spatial organization of mucosal Salmonella-specific IgA response induced by intestinal inflammatory Mϕ subsets.
Three functionally distinct Mϕ populations are present in the inflamed colon: Wos2+CX3CR1lo with the bactericidal gene expression signature, lymph-migratory Ccr7+CX3CR1int, and mucosa-resident Cxcl13+CX3CR1hi populations. In infectious colitis, they collectively induce Salmonella-specific IgA response in two locations: MLNs where CX3CR1int Mϕs migrate and locally within the mucosa via formation of TLSs driven by CX3CR1hi Mϕs.

Similar articles

Cited by

References

    1. Gross M, Salame TM, Jung S, Guardians of the gut-Murine intestinal macrophages and dendritic cells. Front. Immunol 6, 254 (2015). - PMC - PubMed
    1. Bogunovic M, Ginhoux F, Helft J, Shang L, Hashimoto D, Greter M, Liu K, Jakubzick C, Ingersoll MA, Leboeuf M, Stanley ER, Nussenzweig M, Lira SA, Randolph GJ, Merad M, Origin of the lamina propria dendritic cell network. Immunity 31,513–525 (2009). - PMC - PubMed
    1. Joeris T, Müller-Luda K, Agace WW, Mowat AM, Diversity and functions of intestinal mononuclear phagocytes. Mucosal Immunol. 10, 845–864 (2017). - PubMed
    1. Guilliams M, Ginhoux F, Jakubzick C, Naik SH, Onai N, Schraml BU, Segura E, Tussiwand R, Yona S, Dendritic cells, monocytes and macrophages: A unified nomenclature based on ontogeny. Nat. Rev. Immunol 14, 571–578 (2014). - PMC - PubMed
    1. Bain CC, Montgomery J, Scott CL, Kel JM, Girard-Madoux MJH, Martens L, Zangerle-Murray TFP, Ober-Blöbaum J, Lindenbergh-Kortleve D, Samsom JN, Henri S, Lawrence T, Saeys Y, Malissen B, Dalod M, Clausen BE, Mowat AM, TGFβR signalling controls CD103+CD11b+ dendritic cell development in the intestine. Nat. Commun 8, 620 (2017). - PMC - PubMed

Publication types