. 2020 May;30(5):697-710.
doi: 10.1101/gr.253351.119. Epub 2020 Apr 10.

Intragenic repeat expansion in the cell wall protein gene HPF1 controls yeast chronological aging

Affiliations

Intragenic repeat expansion in the cell wall protein gene HPF1 controls yeast chronological aging

Benjamin P Barré et al. Genome Res. 2020 May.

Abstract

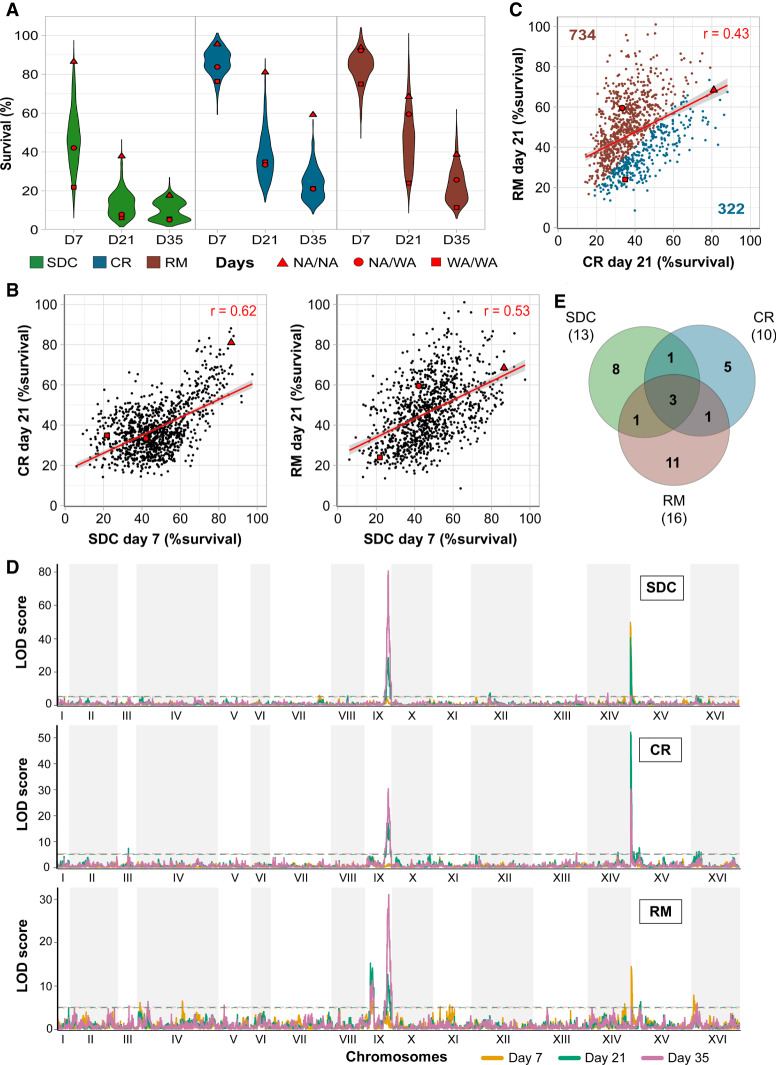
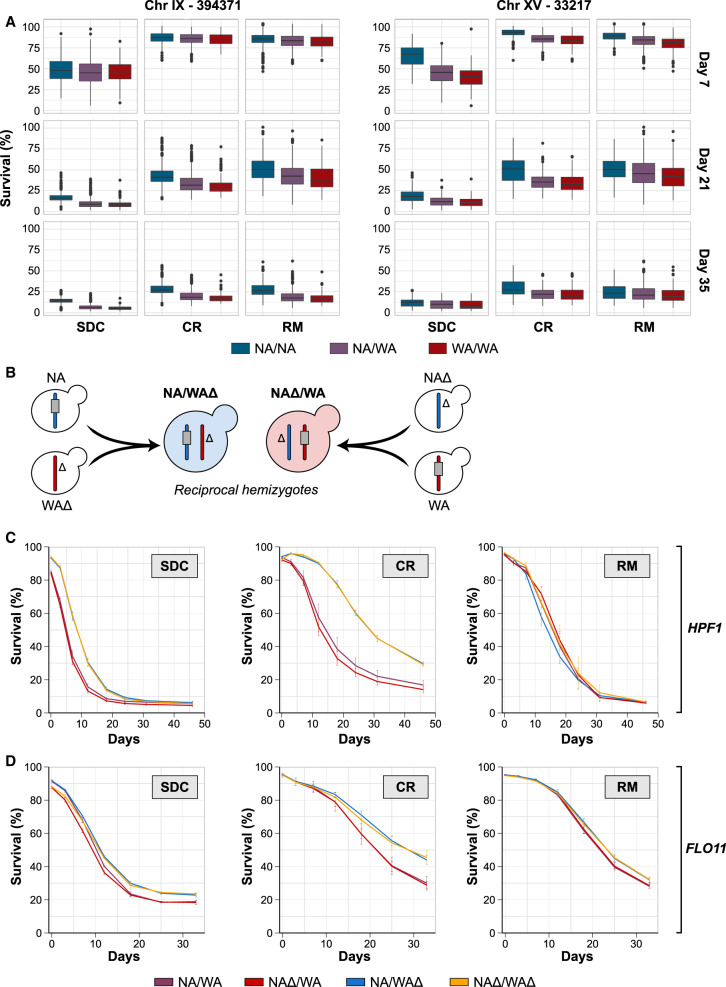
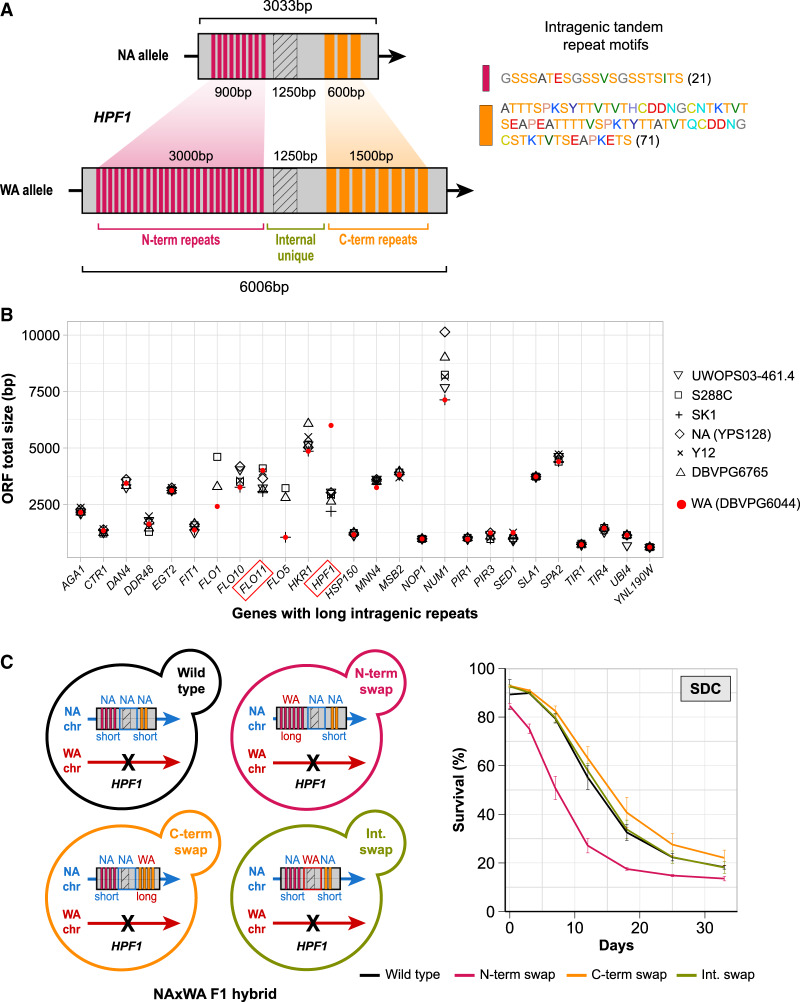
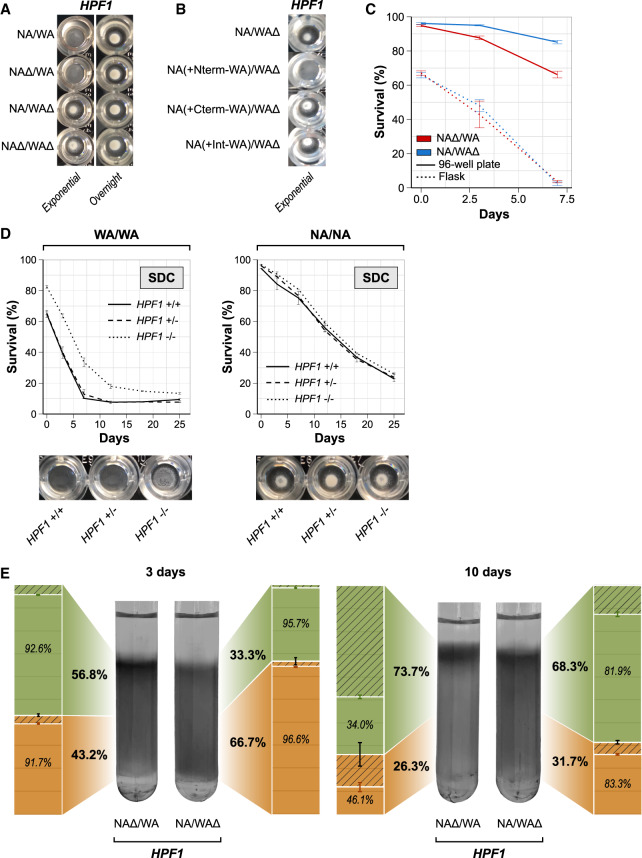
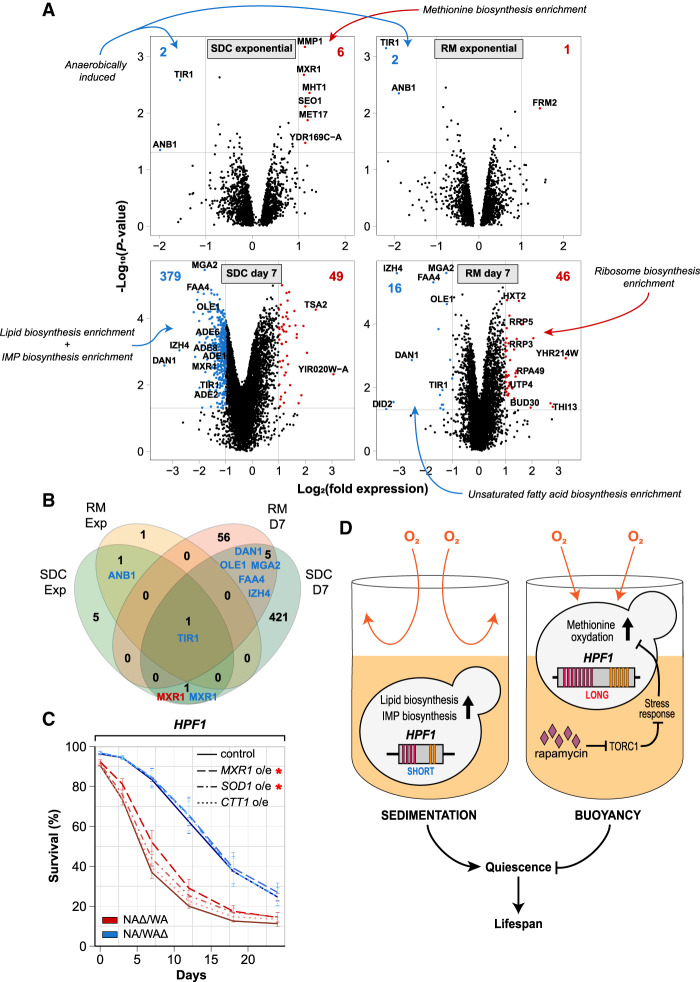
Aging varies among individuals due to both genetics and environment, but the underlying molecular mechanisms remain largely unknown. Using a highly recombined Saccharomyces cerevisiae population, we found 30 distinct quantitative trait loci (QTLs) that control chronological life span (CLS) in calorie-rich and calorie-restricted environments and under rapamycin exposure. Calorie restriction and rapamycin extended life span in virtually all genotypes but through different genetic variants. We tracked the two major QTLs to the cell wall glycoprotein genes FLO11 and HPF1 We found that massive expansion of intragenic tandem repeats within the N-terminal domain of HPF1 was sufficient to cause pronounced life span shortening. Life span impairment by HPF1 was buffered by rapamycin but not by calorie restriction. The HPF1 repeat expansion shifted yeast cells from a sedentary to a buoyant state, thereby increasing their exposure to surrounding oxygen. The higher oxygenation altered methionine, lipid, and purine metabolism, and inhibited quiescence, which explains the life span shortening. We conclude that fast-evolving intragenic repeat expansions can fundamentally change the relationship between cells and their environment with profound effects on cellular lifestyle and longevity.


Figures

Figure 1.
Figure 1.
Calorie restriction and rapamycin extend life span through different genetic variants. Chronological life span of 1056 diploid segregant lineages from an F12 NA/WA advanced intercross. CLS was measured by counting viable cells (%) 7, 21, and 35 d after entry into quiescence, following growth in calorie-sufficient (SDC), -restricted (CR), and rapamycin (RM) media. Red: Founder homozygote parents (NA/NA, WA/WA) and their F1 hybrid (NA/WA). (A) CLS distributions across time points and conditions. (B) Comparing CLS across environments and time points. Red line: linear regression, with 95% confidence interval. (C) CLS comparison in RM and CR. Numbers: lineages living longer in CR (blue) or RM (brown). (D) Linkage analysis of CLS. Panels: calorie-rich (top), -restricted (middle), and rapamycin (bottom) media. Line color: 7 (yellow), 21 (green), and 35 (purple) days after entry into quiescence. y-axis: LOD score, x-axis: genome position. Dashed lines: Significance QTL (α = 0.05). (E) QTLs private to and shared between environments. Numbers in parentheses: total QTLs per environment.
Figure 2.
Figure 2.
Natural allelic variations in the HPF1 and FLO11 control chronological life span. (A) Chronological life span of the 1056 POLs separated according to genotype at the markers with highest LOD score in each of the two major QTLs: 394,381 kb in Chromosome IX (in FLO11) and 33,217 kb in Chromosome XV (in HPF1). (B) Schematic representation of the NA/WA reciprocal hemizygosity design used to validate the CLS effect of the HPF1 and FLO11 WA alleles. Color: NA (blue) and WA (red) chromosomes. Gray rectangle: candidate gene (HPF1, FLO11), Δ: gene deletion. (C) Reciprocal hemizygosity. CLS of NA/WA hemizygotes for NA (blue; WAΔ) and WA (red; NAΔ) HPF1, heterozygote for HPF1 (purple; NA/WA), and lacking HPF1 (yellow; NAΔ/WAΔ). (D) As in C, but for FLO11.
Figure 3.
Figure 3.
Massive intragenic tandem repeat expansions within HPF1 shorten life span. (A) Schematic representation of the intragenic repeats (colored rectangles) in HPF1 for NA and WA alleles. Hatched rectangle: a HPF1 internal unique region with high sequence variation between NA and WA alleles. Right: repeat motif units. Amino acids are colored according to the RasMol nomenclature. Numbers = motif size (amino acids). (B) Size variation of genes containing long intragenic repeats in seven diverged S. cerevisiae strains (Verstrepen et al. 2005; Yue et al. 2017). Diamonds: North American, red circles: West African. (C) Left panel: Design of allele swaps of HPF1 segments in the NA/WA F1 hybrid. The WA-HPF1 allele was deleted (black cross), while the NA-HPF1 was kept unchanged (wild type), or a segment was replaced by the corresponding WA-HPF1 segment. N-term: N-terminal repeats, C-term: C-terminal repeats, Int: internal unique region. Right panel: CLS for allele swapped constructs in SDC media.
Figure 4.
Figure 4.
Buoyancy triggered by HPF1 N-terminal repeat expansions shortens life span. (A,B) Buoyancy of cells cultivated for 7 h (exponential phase) or overnight in calorie-rich medium in a 96-well plate. (A) HPF1 hemizygotes. (B) HPF1 allele swaps (as described in Fig. 3C). (C) Comparing CLS of HPF1 hemizygote cells cultivated in shake flasks and 96-well plates. Shake flasks had a 1:5 medium/volume ratio and were shaken at 220 rpm. Ninety-six-well plates were filled with 200 µL medium, with no shaking. (D) CLS and buoyancy (96-well plates; exponential phase) of WA and NA homozygotes parents with no (full line), 1 (dashed lines), or both copies (dotted lines) of HPF1 deleted in calorie-rich medium. (E) Percoll density gradients with HPF1 hemizygotes incubated in SDC media in a 96-well plate for either 3 d (left panel) or 10 d (right panel). The upper (nonquiescent cells) and lower (quiescent cells) phases were isolated by pipetting. The fraction (bold) and viability (italics) of cells in each phase were measured by flow cytometry (bar plots). Green: Upper/nonquiescent fraction, orange: lower/quiescent fraction, hatched area: dead cell fraction.
Figure 5.
Figure 5.
HPF1-induced buoyancy reprograms methionine, lipid, and purine metabolism. (A) Transcriptome changes induced by WA-HPF1-dependent buoyancy. NA/WA hybrids hemizygotes for WA or NA-HPF1 were cultivated in calorie-rich (left panels) or rapamycin (right panels) medium, and RNA was extracted and sequenced from exponential phase (top panels) or aging (bottom panels; 7 d after entry into quiescence) cells. y-axis: −log10 (P-value), x-axis: log2 (HPF1 NAΔ/WA) – log2 (HPF1 NA/WAΔ). Blue: transcripts more (>2×, P < 0.05) abundant in HPF1 NA/WAΔ, red: transcripts more (>2×, P < 0.05) abundant in HPF1 NAΔ/WA. The total number of transcripts passing each criterion are reported (top corners, blue and red text). Gene Ontology classifications enriched among transcripts passing each criterion are indicated (blue and red arrows) (Supplemental Table S5). (B) Comparing the number of transcripts more (>2×, P < 0.05) abundant in HPF1 NA/WAΔ (blue) or in HPF1 NAΔ/WA (red) across environments (SDC and RM, in exponential phase and after 7 d of aging [D7]). (C) CLS of HPF1 reciprocal hemizygotes overexpressing (o/e) either MXR1 (dashed), SOD1 (dot-dashed), or CTT1 (dotted) in SDC media in 96-well plate. Red asterisk indicates significance (P < 0.05 unpaired Student's t-test) at 7 d (MXR1) and 12 d (MXR1 and SOD1). (D) Model for how the intragenic tandem repeat expansions in WA-HPF1 shortens the life span by shifting cells from a sedentary (left) to a buoyant lifestyle (right), exposing them to more oxygen and causing mild oxidation of, in particular, methionine, which impairs entry into quiescence. Rapamycin prevents the accumulation of oxidized methionine, possibly through inhibiting TORC1 and through the activation of stress response genes.

Similar articles

Cited by

References

    1. Allen C, Büttner S, Aragon AD, Thomas JA, Meirelles O, Jaetao JE, Benn D, Ruby SW, Veenhuis M, Madeo F, et al. 2006. Isolation of quiescent and nonquiescent cells from yeast stationary-phase cultures. J Cell Biol 174: 89–100. 10.1083/jcb.200604072 - DOI - PMC - PubMed
    1. Alvers AL, Fishwick LK, Wood MS, Hu D, Chung HS, Dunn WA Jr, Aris JP. 2009. Autophagy and amino acid homeostasis are required for chronological longevity in Saccharomyces cerevisiae. Aging Cell 8: 353–369. 10.1111/j.1474-9726.2009.00469.x - DOI - PMC - PubMed
    1. Aragon AD, Rodriguez AL, Meirelles O, Roy S, Davidson GS, Tapia PH, Allen C, Joe R, Benn D, Werner-Washburne M. 2008. Characterization of differentiated quiescent and nonquiescent cells in yeast stationary-phase cultures. Mol Biol Cell 19: 1271–1280. 10.1091/mbc.e07-07-0666 - DOI - PMC - PubMed
    1. Arlia-Ciommo A, Leonov A, Beach A, Richard VR, Bourque SD, Burstein MT, Kyryakov P, Gomez-Perez A, Koupaki O, Feldman R, et al. 2018. Caloric restriction delays yeast chronological aging by remodeling carbohydrate and lipid metabolism, altering peroxisomal and mitochondrial functionalities, and postponing the onsets of apoptotic and liponecrotic modes of regulated cell death. Oncotarget 9: 16163–16184. 10.18632/oncotarget.24604 - DOI - PMC - PubMed
    1. Avanesov AS, Ma S, Pierce KA, Yim SH, Lee BC, Clish CB, Gladyshev VN. 2014. Age- and diet-associated metabolome remodeling characterizes the aging process driven by damage accumulation. eLife 3: e02077 10.7554/eLife.02077 - DOI - PMC - PubMed

Publication types

MeSH terms

LinkOut - more resources