. 2020 Apr 10;3(5):e202000661.
doi: 10.26508/lsa.202000661. Print 2020 May.

Vav1 and mutant K-Ras synergize in the early development of pancreatic ductal adenocarcinoma in mice

Affiliations

Vav1 and mutant K-Ras synergize in the early development of pancreatic ductal adenocarcinoma in mice

Yaser Salaymeh et al. Life Sci Alliance. .

Abstract

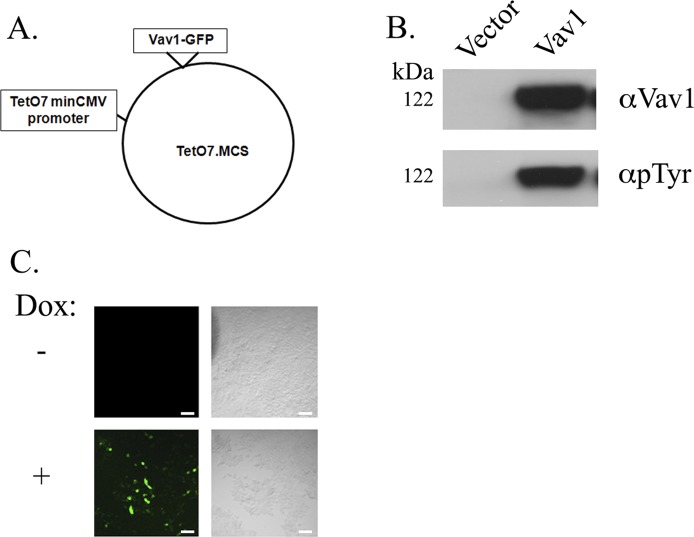
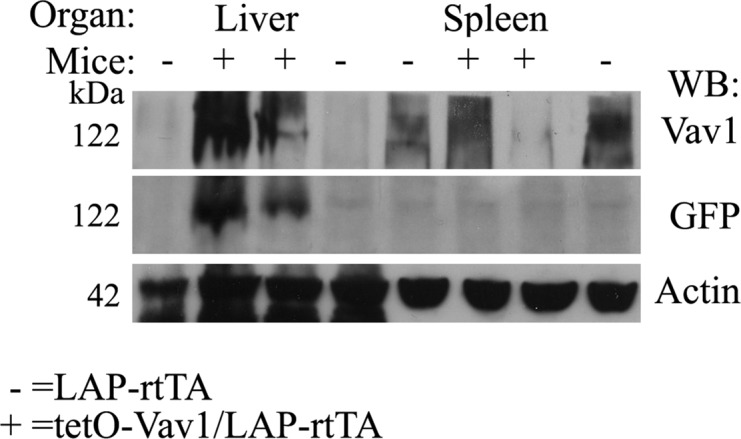
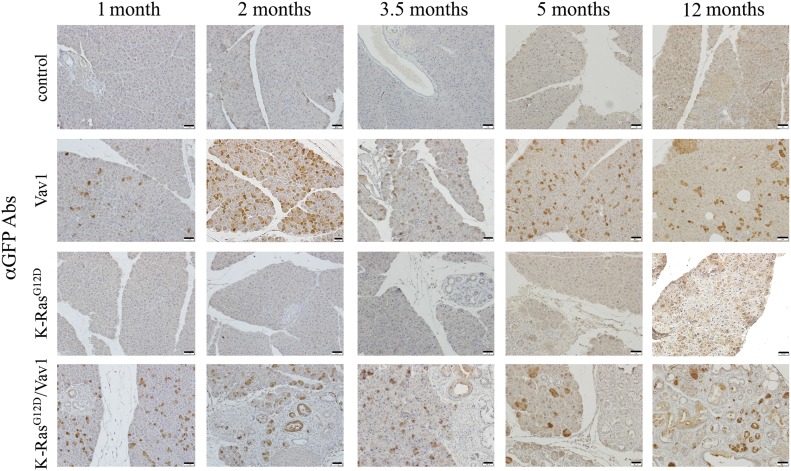
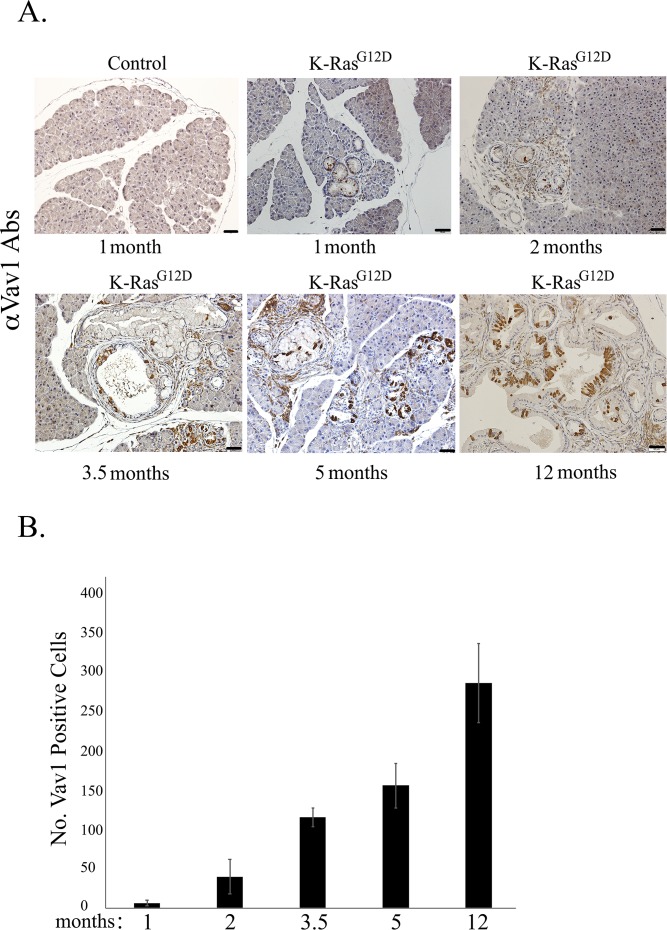
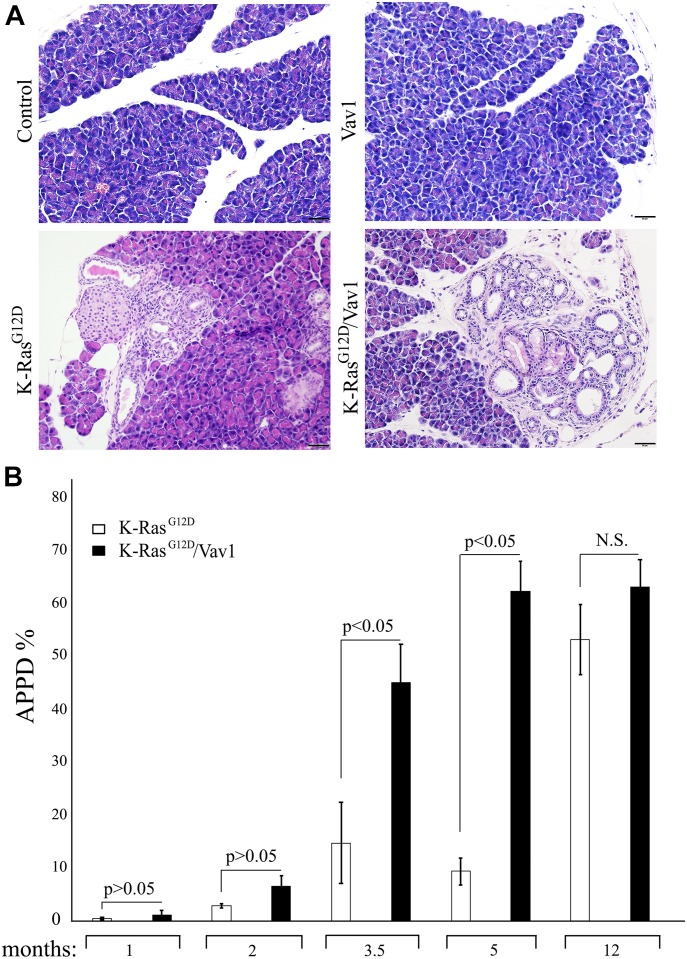
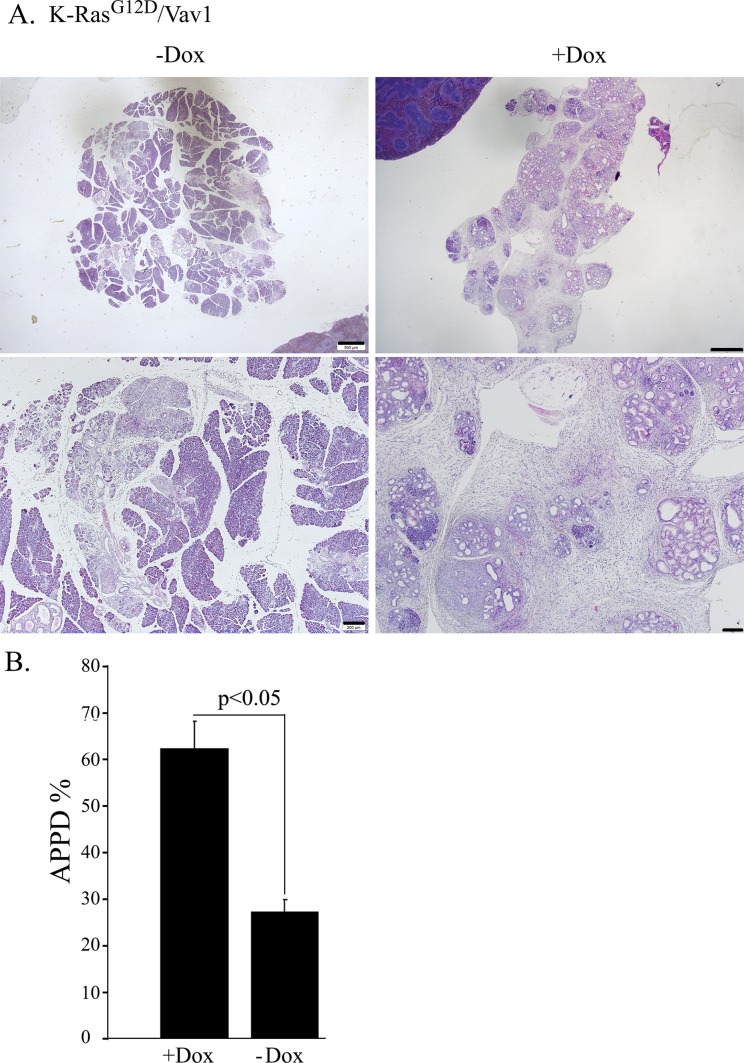
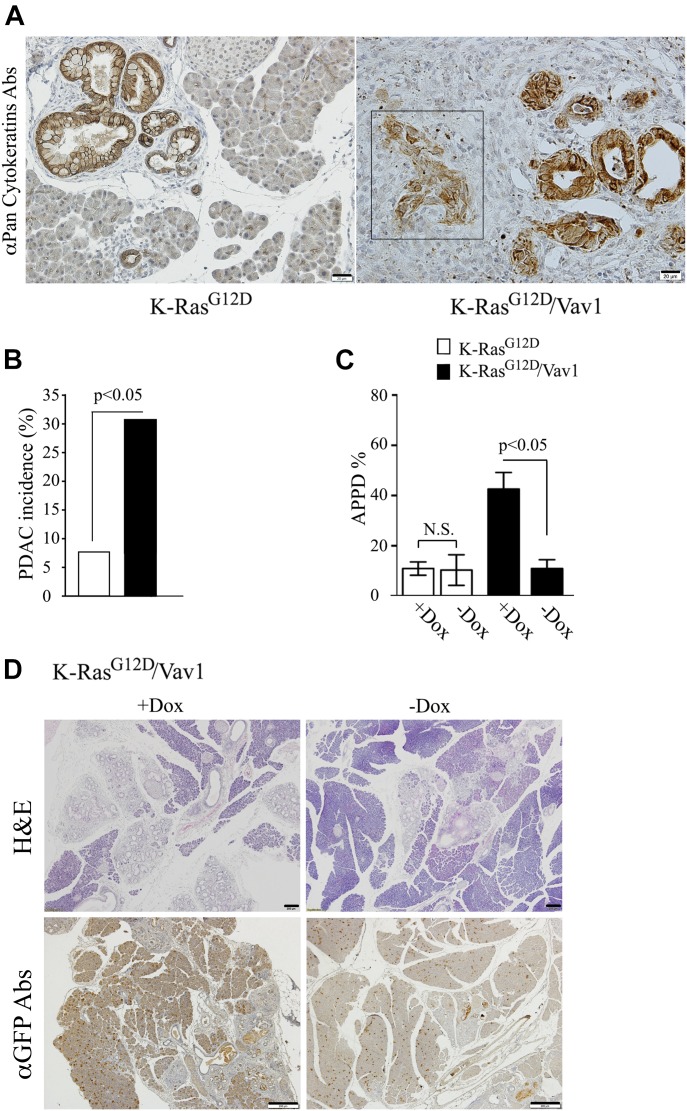
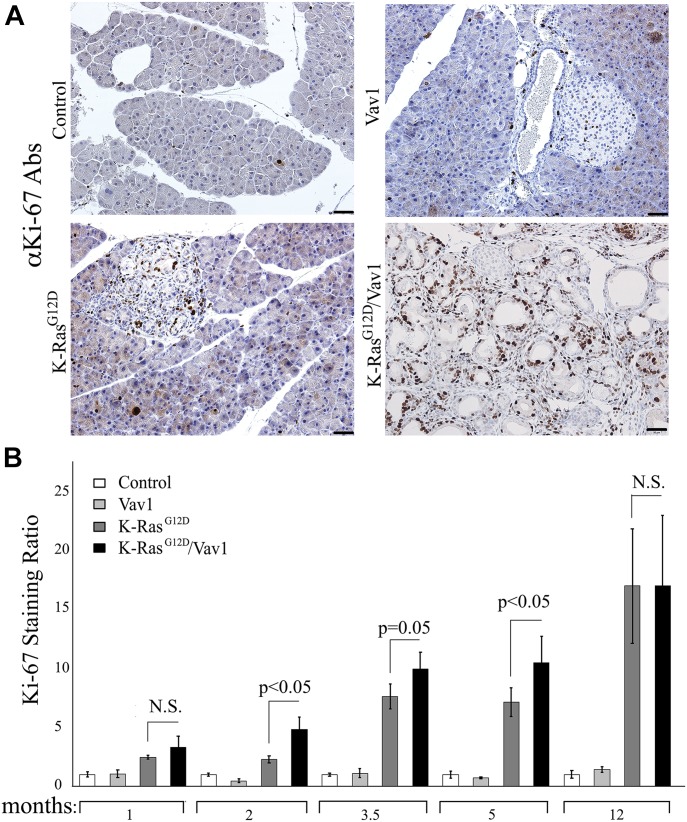
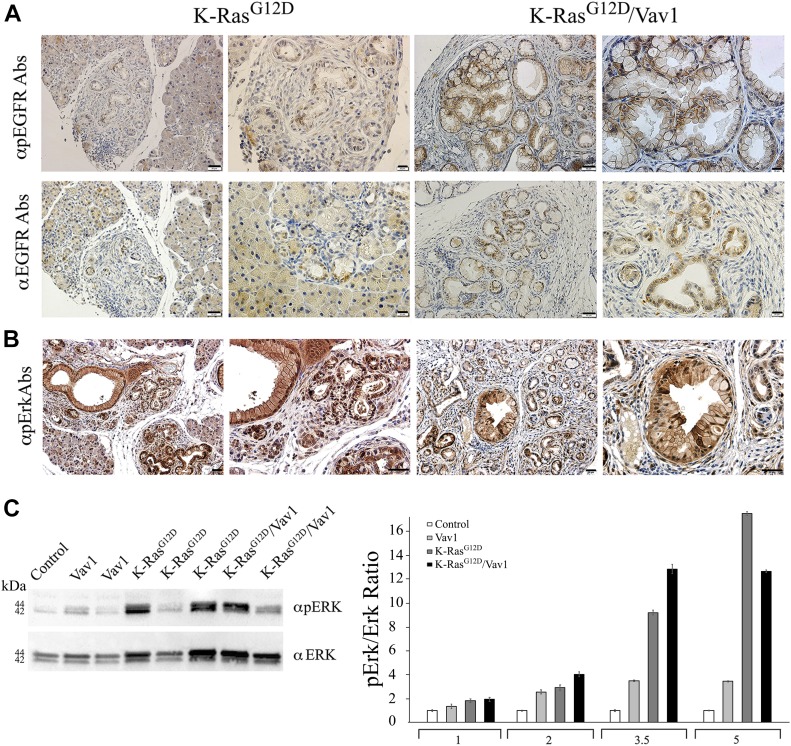
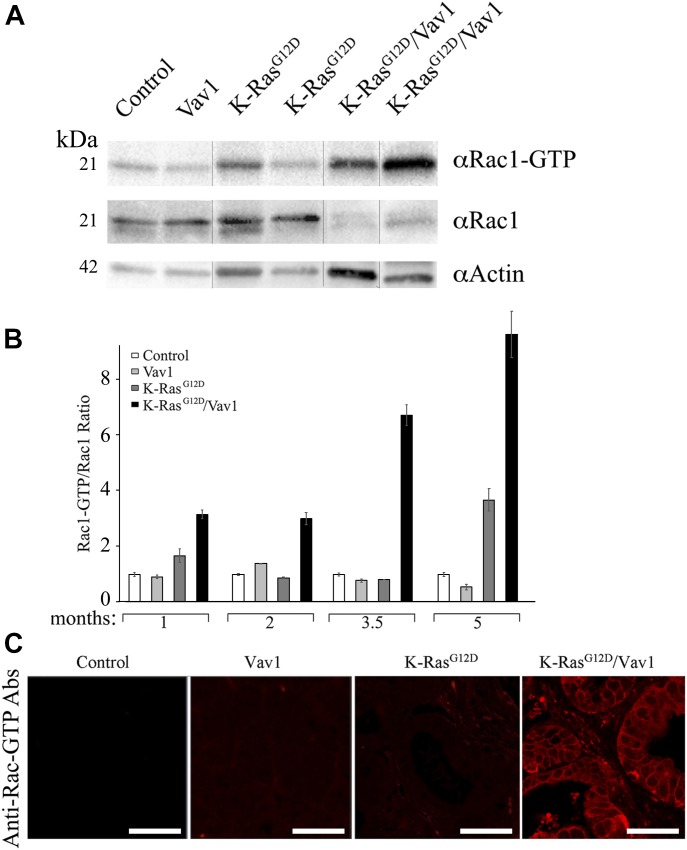
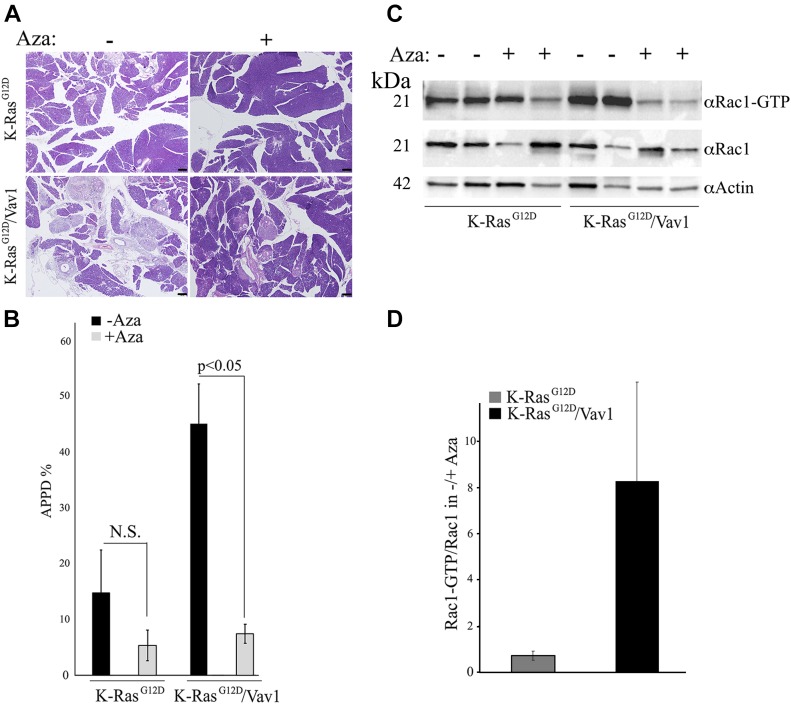
To explore the contribution of Vav1, a hematopoietic signal transducer, to pancreatic ductal adenocarcinoma (PDAC) development, we generated transgenic mouse lines expressing, Vav1, K-RasG12D, or both K-RasG12D and Vav1 in pancreatic acinar cells. Co-expression of Vav1 and K-RasG12D synergistically enhanced acinar-to-ductal metaplasia (ADM) formation, far exceeding the number of lesions developed in K-RasG12D mice. Mice expressing only Vav1 did not develop ADM. Moreover, the incidence of PDAC in K-RasG12D/Vav1 was significantly higher than in K-RasG12D mice. Discontinuing Vav1 expression in K-RasG12D/Vav1 mice elicited a marked regression of malignant lesions in the pancreas, demonstrating Vav1 is required for generation and maintenance of ADM. Rac1-GTP levels in the K-RasG12D/Vav1 mice pancreas clearly demonstrated an increase in Rac1 activity. Treatment of K-RasG12D and K-RasG12D/Vav1 mice with azathioprine, an immune-suppressor drug which inhibits Vav1's activity as a GDP/GTP exchange factor, dramatically reduced the number of malignant lesions. These results suggest that Vav1 plays a role in the development of PDAC when co-expressed with K-RasG12D via its activity as a GEF for Rac1GTPase.


Conflict of interest statement

The authors declare that they have no conflict of interest.

Figures

Figure S1.
Figure S1.. Plasmid construction and validation.
(A) Wild-type Vav1 was subcloned into Teto7minCMV plasmid transgene plasmid fused to GFP (tetO–Vav1). (B) HEK293 cells were transfected with the tetO–Vav1 plasmid and a vector that encodes the reverse tetracycline responsive transactivator (rtTA). After treatment with Dox, the cells were lysed and analyzed by Western blotting for the presence of Vav1 and its phosphotyrosine status. The empty plasmid served as control vector. (C) HEK293 cells were transfected with the tetO–Vav1 plasmid either treated (+) or nontreated (−) with Dox were subjected to immunofluorescence. Green = GFP, which refers to Vav1 expression. Scale bar represents 50 μm.
Figure S2.
Figure S2.. Validation of tissue-specific expression of Vav1 transgene in vivo.
Western blot analysis of liver and spleen tissue from tetO–Vav1 mice crossed with LAP–rtTA mice (tetO–Vav1/LAP–rtTA; positive mice) with anti-Vav1, anti-GFP expression (indicative of the transgene Vav1 expression) and anti-actin Abs. Source data are available for this figure.
Fig 1.
Fig 1.. Expression of GFP in the pancreata from different mouse lines.
Representative paraffin sections of the pancreata of the various mouse lines at different time points after the onset of transgene induction (as indicated) were stained with anti-GFP Abs that identify the Vav1 transgene. Scale bar represents 25 μm. Number of mice stained in this experiment are outlined in Table S1.
Figure S3.
Figure S3.. Expression of endogenous Vav1 in the K-RasG12Dmouse pancreas.
(A) Paraffin sections of pancreata from a control mouse (at 1-mo post tamoxifen and Dox administration) and from K-RasG12D mice at the indicated time points after transgene induction were stained with anti-Vav1 antibodies and then assessed for endogenous Vav1 expression. A representative of each of those stained sections is depicted. Scale bar represents 50 μm. (B) Endogenous Vav1 expression was quantified by counting Vav1-positive acinar and ductal cells in K-RasG12D mice at different times after transgene induction: at 1 mo (n = 2), 2 mo (n = 4), 3.5 mo (n = 3), 5 mo (n = 3), and 12 mo (n = 3). Five randomly chosen fields were counted in mouse sections (scale bar represents 50 μm). Calculated mean values of Vav1-positive acinar/ductal cells at each time point are represented in the graph. SEM are shown.
Fig 2.
Fig 2.. Vav1 and K-RasG12D synergize in the generation of malignant pancreatic lesions.
Hematoxylin and eosin (H&E)–stained pancreata of control, Vav1, K-RasG12D, and K-RasG12D/Vav1 mice, at 1, 2, 3.5, 5, and 12 mo after the onset of transgene induction were analyzed for the appearance of malignant lesions. (A) Representative pictures of H&E–stained sections taken 3.5 mo after the onset of transgene induction are shown. Scale bar represents 20 μm. (B) The extent of malignant lesions generated in K-RasG12D and K-RasG12D/Vav1 mice at the indicated time points after onset of transgene induction was calculated. The sum of area occupied by ADM, PanINs, and PDAC lesions (APPD) was measured as a fraction of the total area of the pancreas (APPD%). Numbers of K-RasG12D and K-RasG12D/Vav1 mice used, respectively, were n = 4 and n = 8 at 1 mo; n = 6 and n = 8 at 2 mo; n = 13 and n = 17 at 3.5 mo; n = 9 and n = 9 at 5 mo; and n = 7 and n = 5 at 12 mo. Significant differences between the two analyzed groups (P < 0.05; t test) are indicated. N.S. refers to statistical nonsignificant differences. SEM are shown.
Figure S4.
Figure S4.. K-RasG12D/Vav1 mice were either treated with tamoxifen and Dox (+Dox) or treated with tamoxifen only (−Dox).
5 mo after Vav1 transgene induction, the mice were euthanized and their pancreata was analyzed for the appearance of malignant lesions. (A) A representative picture of hematoxylin and eosin (H&E) sections of pancreas from these mice at two magnifications: upper panel scale bar represents 500 μm and lower panel scale bar represents 200 μm. (B) The extent of malignant lesions generated in K-RasG12D/Vav1 mice either expressing both K-RasG12D and Vav1 (+Dox; n = 9) or expressing K-RasG12D (−Dox; n = 3) only is presented as a histogram. At the time point of 5 mo post-transgene induction. SEM and significance between the two groups analyzed are indicated (t test).
Fig 3.
Fig 3.. Vav1 expression enhances pancreatic ductal adenocarcinoma (PDAC) generation in the K-RasG12D/Vav1 mouse pancreas and is critical for pancreatic malignant lesions.
(A) Representative K-RasG12D (left) and K-RasG12D/Vav1 (right) stained with anti–pan-cytokeratin Abs are shown. The presence of PDAC is shown in a representative pancreatic section from a K-RasG12D/Vav1 mouse 1 mo after transgene induction (square, right panel). Scale bar represents 20 μm. (B) The extent of PDAC present in K-RasG12D and K-RasG12D/Vav1 mice at the different time points after transgene induction was assessed. The histogram summarizes the incidence of PDAC development in K-RasG12D mice and in K-RasG12D/Vav1 mice. Two of 26 K-RasG12D mice (7.7%) and 12 of 39 K-RasG12D/Vav1 mice (30.8%) had developed PDAC lesions. PDAC developed in K-RasG12D/Vav1 ranging from 1 to 12 mo post transgenes induction, whereas PDAC in K-RasG12D developed in mice of 3.5 and 5 mo post transgene induction. Significance of the difference between them (P < 0.05) was calculated using a two-tailed chi-squared test (Fisher’s exact test). (C) In some K-RasG12D/Vav1 mice (see numbers below), before completion of 3.5 mo of transgene induction, their Vav1 expression was discontinued for 20 d by removal of Dox from their drinking water (−Dox). Hematoxylin and eosin (H&E) staining of the pancreata of K-RasG12D and K-RasG12D/Vav1 either treated with Dox and tamoxifen (+Dox) or in which Dox was removed from their drinking water for 20 d before completion of 3.5 mo of transgene induction (−Dox) was performed. All the mice were then analyzed for the appearance of malignant lesions. The number of malignant lesions generated in these mice was calculated as APPD%, both for those treated with Dox (+Dox; n = 13 and n = 17, respectively) and for those in which Dox was omitted for 20 d (−Dox; n = 3 and n = 7, respectively). Significant differences between the two analyzed groups (P < 0.05; t test) are indicated. N.S. refers to statistical nonsignificant differences. SEM are shown. (D) Pancreatic sections from K-RasG12D/Vav1 mice after 3.5 mo post transgene induction either treated with Dox (+Dox) or in which Dox treatment was discontinued for 20 d (−Dox) were either stained by H&E (upper panel) or anti-GFP Abs (lower panel). Representative pictures are shown. Scale bar represents 200 μm.
Fig 4.
Fig 4.. Proliferation of pancreatic cells from control, Vav1, K-RasG12D, and K-RasG12D/Vav1 mice.
Proliferation of acinar and ductal pancreatic cells obtained, at different times after initiation of transgene induction, from control, Vav1, K-RasG12D, and K-RasG12D/Vav1 mice was assessed by anti-Ki-67 staining. (A) Representative pictures of Ki-67–stained pancreatic sections taken from mice 5 mo after the start of transgene induction. Scale bar represents 50 μm. (B) Proliferation was quantified by counting 10 fields from each pancreatic section and calculating the mean value. The numbers of mice used for Ki-67 staining calculations are recorded in Table S1. To obtain the Ki-67 staining ratio in each case, the result at each time point was divided by the result obtained for the control at the same time point. Significant differences between the two analyzed groups (P < 0.05; t test) are indicated. N.S. refers to statistical nonsignificant differences. SEM are shown.
Fig 5.
Fig 5.. Staining of phospho-EGFR and phospho-Erk in malignant pancreatic lesions from K-RasG12D/Vav1 mice.
(A) Pancreatic sections from 4 K-RasG12D and 8 K-RasG12D/Vav1 mice treated with tamoxifen and Dox for 5 mo were stained for pEGFR (upper panel) and total EGFR (lower panel). Representative pictures at two magnifications are shown. The scale bars represent either 50 μm (left pictures in each group) or 20 μm (right pictures in each group) as indicated. (B) Pancreatic sections from K-RasG12D and K-RasG12D/Vav1 mice treated with tamoxifen and Dox for 5 mo were stained for pERK. Representative pictures are shown. Scale bar represents 20 μm. (C) Lysates from pancreatic tissues of 5-mo post-transgene induction from 3 control, 2 Vav1, 3 K-RasG12D, and 2 K-RasG12D/Vav1 mice were Western blotted using anti–phospho-Erk and anti-Erk (left panel). A representative blot from four independent experiments is shown. Relative Erk phosphorylation in the pancreata of control, Vav1, K-RasG12D, and K-RasG12D/Vav1 mice at 1, 2, 3.5, and 5 mo after the onset of transgene induction was calculated by quantifying their Western blots using ImageJ 1.49V software (right panel). Number of mice in these experiments are outlined in Table S1. SEM are shown.
Fig 6.
Fig 6.. Activation of Rac–GTP in malignant pancreatic lesions from K-RasG12/Vav1 mice.
Rac1–GTP activation in the pancreata of control, Vav1, K-RasG12D, and K-RasG12D/Vav1 mice was analyzed. (A) Western blotting using anti–Rac1–GTP Abs, anti-Rac1, and anti-actin were used to evaluate Rac1–GTP levels in protein lysates from pancreatic tissues of control, Vav1, K-RasG12D, and K-RasG12D/Vav1 mice (two mice in each group) at 5 mo after transgene induction. The vertical black lines delineate sliced images that juxtapose lanes that were nonadjacent in the gel. (B) The levels of Rac1–GTP versus total Rac1 at the pancreata of control, Vav1, K-RasG12D, and K-RasG12D/Vav1 mice at 1, 2, 3.5, and 5 mo after initiation of transgene induction were calculated. Each Rac1–GTP/Rac1 was then divided by the control ratio. Band intensity of the Western blots was quantified using ImageJ 1.49V software. Number of mice in these experiments are outlined in Table S1. SEM are shown. (C) Immunofluorescence of Rac1–GTP of the pancreata from 2 control, 3 Vav1, 3 K-RasG12D, and 4 K-RasG12D/Vav1 mice, 3.5 mo post-transgene induction was performed. Representative pictures are depicted. Scale bar represents 25 μm. All sections were also stained with anti–Alexa Flour 594 dye for background analysis and found negative. Source data are available for this figure.
Fig 7.
Fig 7.. Treatment of K-RasG12D and K-RasG12D/Vav1 mice with azathioprine.
At 2 mo after initiation of transgene induction, K-RasG12D and K-RasG12D/Vav1 mice were injected i.p. with azathioprine (Aza; 10 mg/kg), 5 d a week for 1 mo, and euthanized 15 d after the last injection. (A) Representative pictures of hematoxylin and eosin (H&E)–stained sections of pancreata from Aza-untreated (indicated by −) and Aza-treated mice (indicated by +) are shown. Scale bar represents 200 μm. (B) The histogram shows the extent of malignant lesions (APPD%) generated in Aza-treated K-RasG12D and K-RasG12D/Vav1 mice. Numbers of K-RasG12D and K-RasG12D/Vav1 mice used without treatment (−) were n = 8 and n = 12, respectively, and numbers treated with Aza (+) were n = 6 and n = 7, respectively. Significant differences between the two analyzed groups (P < 0.05; t test) are indicated. N.S. refers to statistical nonsignificant differences. SEM are shown. (C) Western blotting using anti–Rac1–GTP Abs, anti-Rac1 and anti-actin were used to evaluate Rac1–GTP levels in protein lysates from pancreatic tissues of Aza-untreated (−) or Aza-treated (+) K-RasG12D and K-RasG12D/Vav1 mice. (D) The relative ratio of Rac1–GTP/Rac1 level was calculated for each group of Aza-untreated (−) or Aza-treated (+) mice. Band intensity of the Western blots was quantified using ImageJ 1.49V software. SEM are shown.

References

    1. Abate F, da Silva-Almeida AC, Zairis S, Robles-Valero J, Couronne L, Khiabanian H, Quinn SA, Kim MY, Laginestra MA, Kim C, et al. (2017) Activating mutations and translocations in the guanine exchange factor VAV1 in peripheral T-cell lymphomas. Proc Natl Acad Sci U S A 114: 764–769. 10.1073/pnas.1608839114 - DOI - PMC - PubMed
    1. Aichler M, Seiler C, Tost M, Siveke J, Mazur PK, Da Silva-Buttkus P, Bartsch DK, Langer P, Chiblak S, Durr A, et al. (2012) Origin of pancreatic ductal adenocarcinoma from atypical flat lesions: A comparative study in transgenic mice and human tissues. J Pathol 226: 723–734. 10.1002/path.3017 - DOI - PubMed
    1. Ardito CM, Gruner BM, Takeuchi KK, Lubeseder-Martellato C, Teichmann N, Mazur PK, Delgiorno KE, Carpenter ES, Halbrook CJ, Hall JC, et al. (2012) EGF receptor is required for KRAS-induced pancreatic tumorigenesis. Cancer Cell 22: 304–317. 10.1016/j.ccr.2012.07.024 - DOI - PMC - PubMed
    1. Bardeesy N, Aguirre AJ, Chu GC, Cheng KH, Lopez LV, Hezel AF, Feng B, Brennan C, Weissleder R, Mahmood U, et al. (2006) Both p16(Ink4a) and the p19(Arf)-p53 pathway constrain progression of pancreatic adenocarcinoma in the mouse. Proc Natl Acad Sci U S A 103: 5947–5952. 10.1073/pnas.0601273103 - DOI - PMC - PubMed
    1. Biankin AV, Waddell N, Kassahn KS, Gingras MC, Muthuswamy LB, Johns AL, Miller DK, Wilson PJ, Patch AM, Wu J, et al. (2012) Pancreatic cancer genomes reveal aberrations in axon guidance pathway genes. Nature 491: 399–405. 10.1038/nature11547 - DOI - PMC - PubMed

Publication types

MeSH terms

Substances