. 2020 Sep;11(9):661-679.
doi: 10.1007/s13238-020-00713-x. Epub 2020 Apr 10.

BMAL1 regulates mitochondrial fission and mitophagy through mitochondrial protein BNIP3 and is critical in the development of dilated cardiomyopathy

Affiliations

BMAL1 regulates mitochondrial fission and mitophagy through mitochondrial protein BNIP3 and is critical in the development of dilated cardiomyopathy

Ermin Li et al. Protein Cell. 2020 Sep.

Abstract

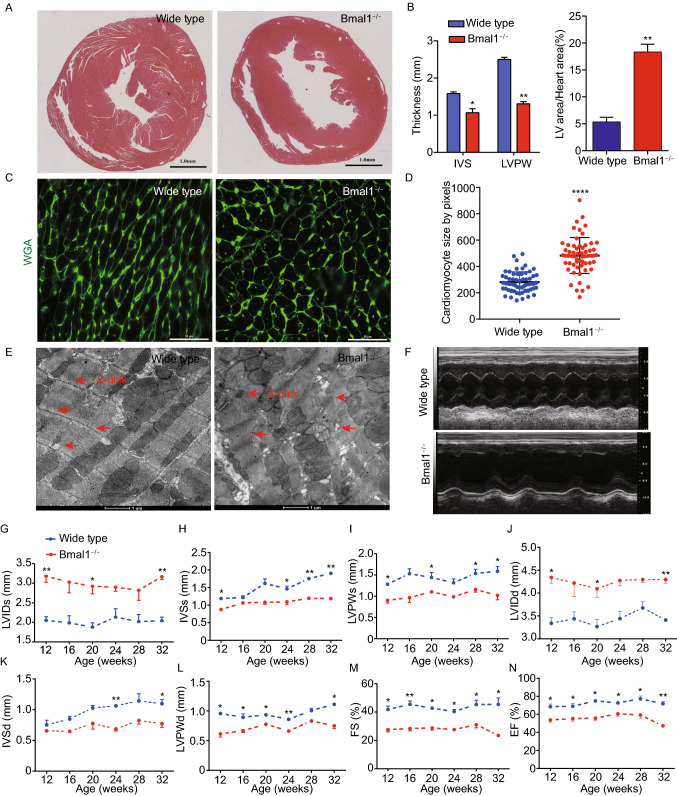
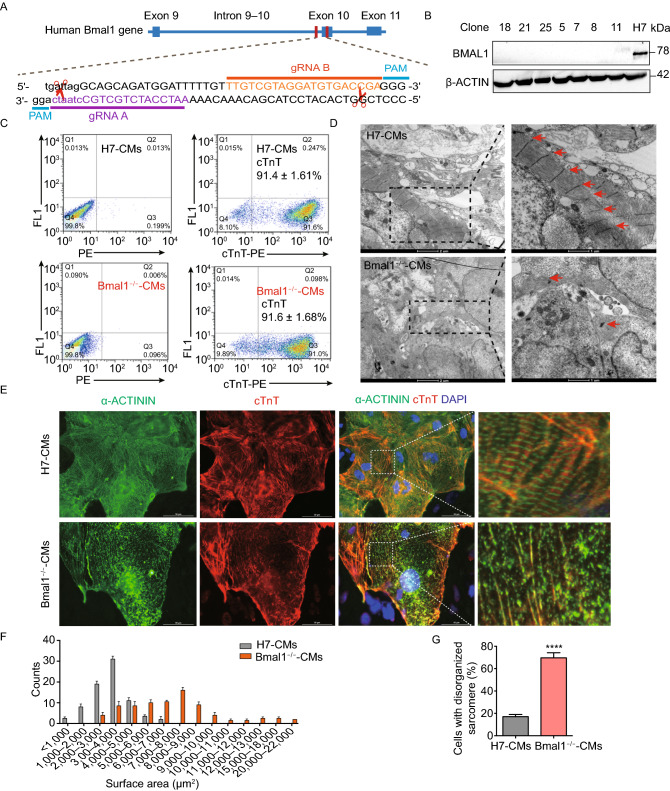
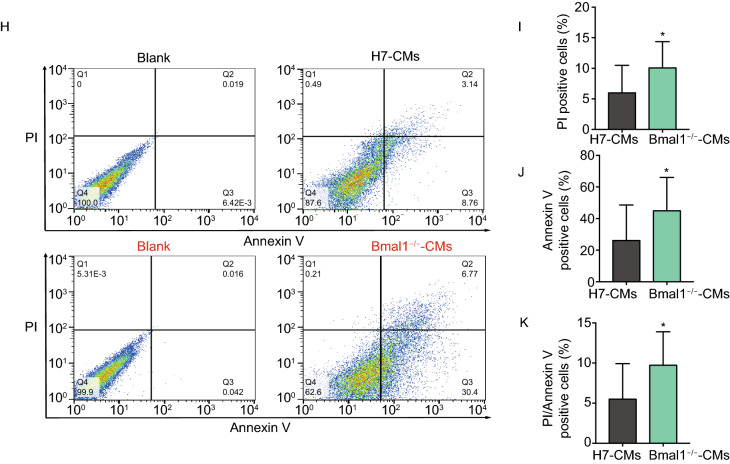
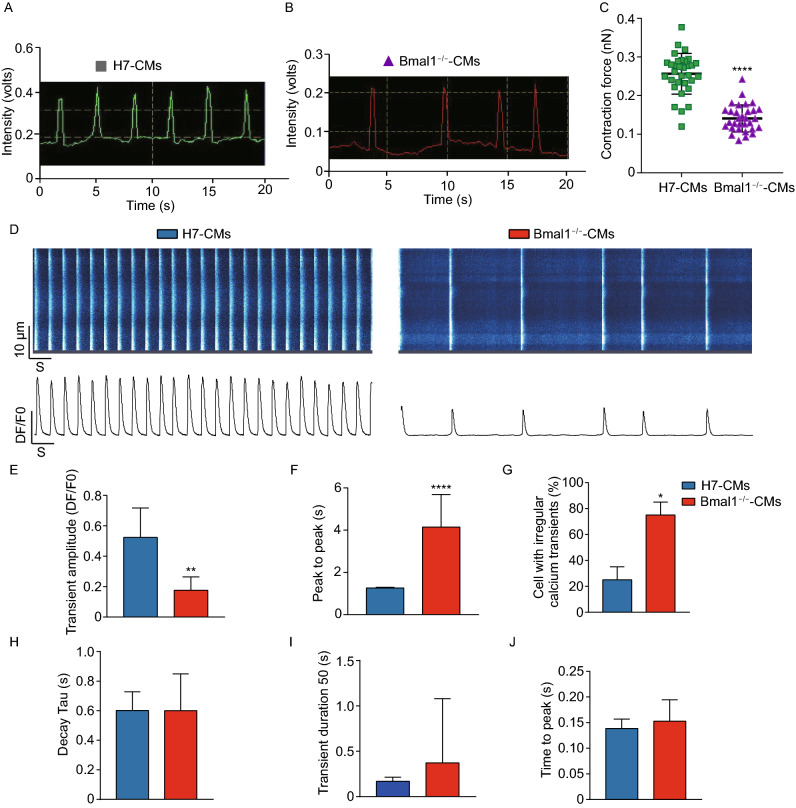
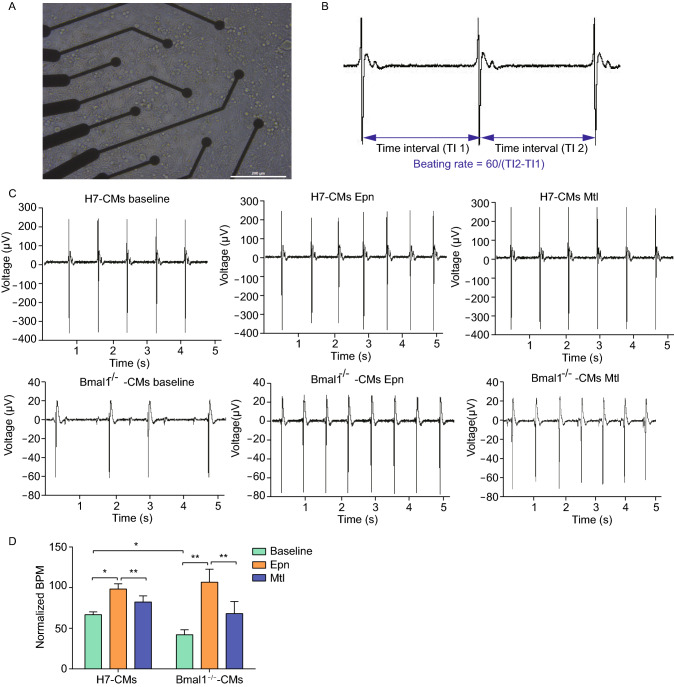
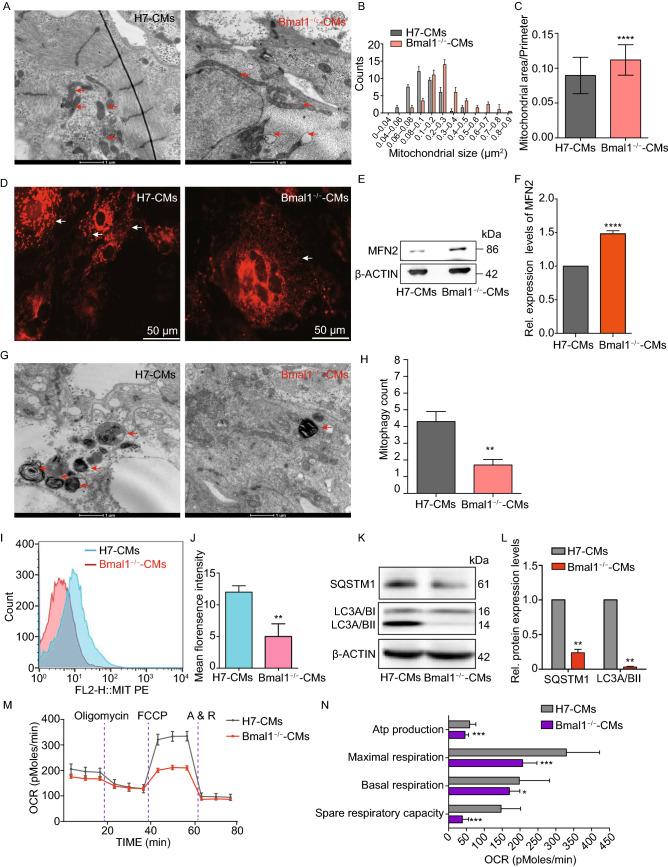
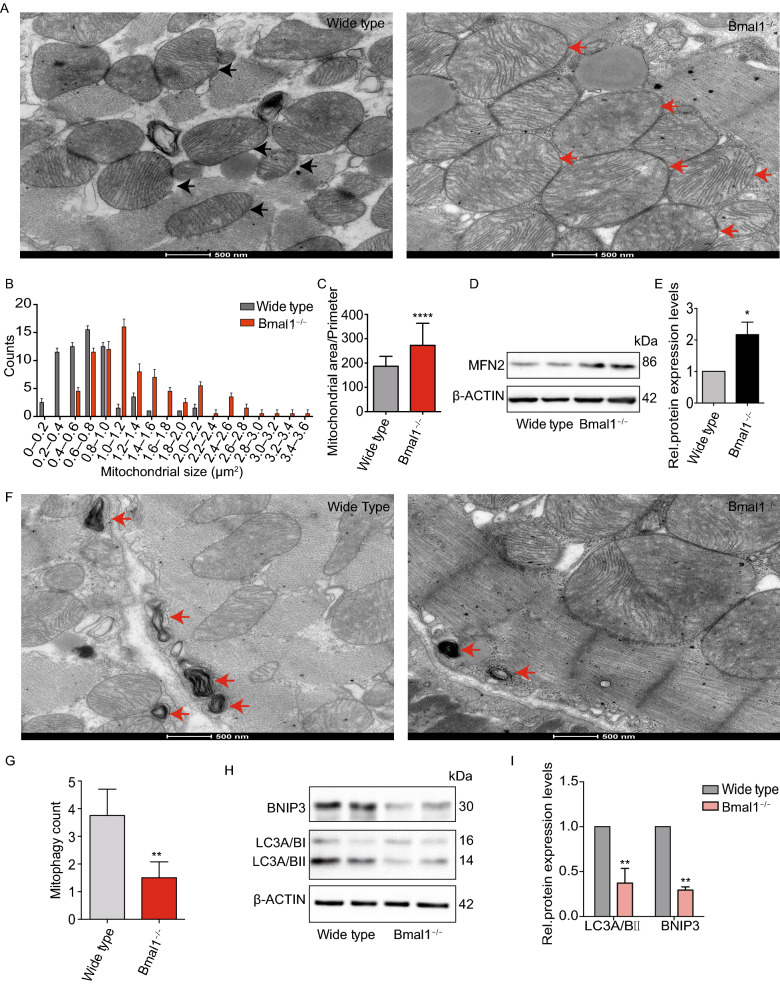
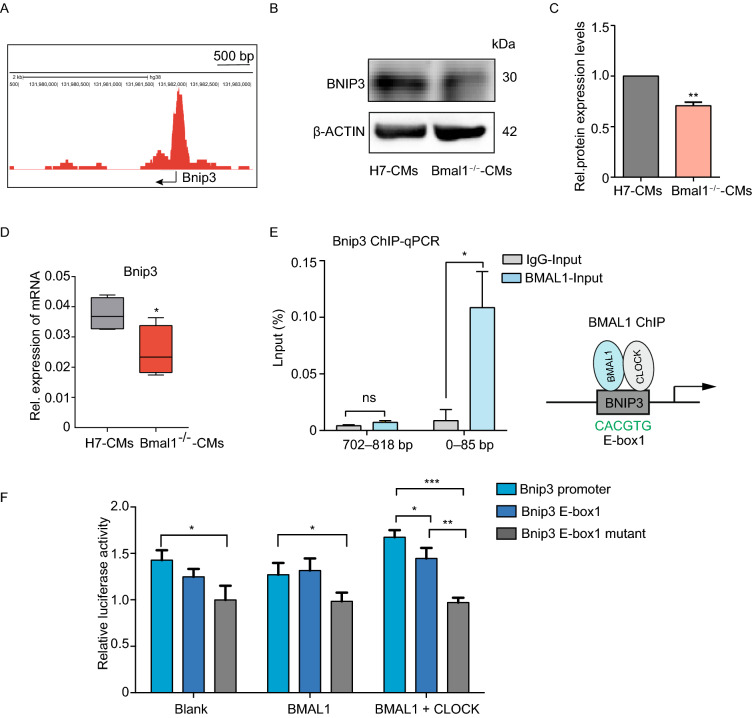
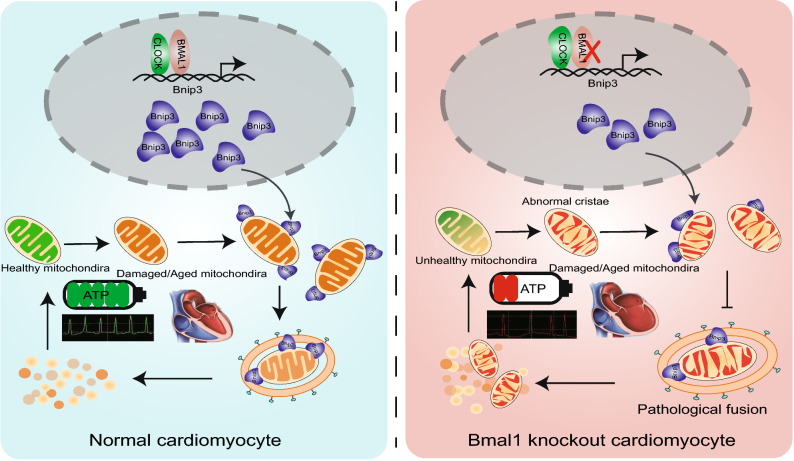
Dysregulation of circadian rhythms associates with cardiovascular disorders. It is known that deletion of the core circadian gene Bmal1 in mice causes dilated cardiomyopathy. However, the biological rhythm regulation system in mouse is very different from that of humans. Whether BMAL1 plays a role in regulating human heart function remains unclear. Here we generated a BMAL1 knockout human embryonic stem cell (hESC) model and further derived human BMAL1 deficient cardiomyocytes. We show that BMAL1 deficient hESC-derived cardiomyocytes exhibited typical phenotypes of dilated cardiomyopathy including attenuated contractility, calcium dysregulation, and disorganized myofilaments. In addition, mitochondrial fission and mitophagy were suppressed in BMAL1 deficient hESC-cardiomyocytes, which resulted in significantly attenuated mitochondrial oxidative phosphorylation and compromised cardiomyocyte function. We also found that BMAL1 binds to the E-box element in the promoter region of BNIP3 gene and specifically controls BNIP3 protein expression. BMAL1 knockout directly reduced BNIP3 protein level, causing compromised mitophagy and mitochondria dysfunction and thereby leading to compromised cardiomyocyte function. Our data indicated that the core circadian gene BMAL1 is critical for normal mitochondria activities and cardiac function. Circadian rhythm disruption may directly link to compromised heart function and dilated cardiomyopathy in humans.

Keywords: cardiomyocytes; cell differentiation; circadian gene BMAL1; dilated cardiomyopathy; human embryonic stem cells; mitochondria.


Figures

Figure 1
Figure 1
Bmal1 deletion caused dilated cardiomyopathy in mice. (A) Histological analyses of heart sections of wild type and Bmal1 KO mice by H&E staining at 32 weeks of age. Scale bar: 1 mm. (B) Statistics of the average thickness of IVS and LVPW of wild type and Bmal1 KO mice (n = 4). *P < 0.05 and **P < 0.01 versus control by two-tailed Student’s t test. (C) Representative confocal microscopy images of WGA staining of myocardium from wild type and Bmal1 KO mice. (D) Quantification of cell surface area as shown in (C) (n = 59 per group). ****P < 0.0001 versus control by two-tailed Student’s t test. (E) Representative electron micrographs of ventricular cardiomyocytes from wide type and Bmal1 KO mice. Red arrows indicate Z-lines. (F) Representative echocardiography images of 32-weeks-old wild type and Bmal1 KO mice. (G–N) Echocardiographic parameters of heart functions from wild type and Bmal1 KO mice over time (n = 4 per group). 2-way ANOVA with post-hoc tes. Data were represented mean ± SD. *P < 0.05 and **P < 0.01 versus control by 2-way ANOVA with post-hoc test
Figure 2
Figure 2
Phenotypic characterizations of BMAL1 KO hESCs-derived cardiomyocytes. (A) Schematic showing the design for generation of BMAL1 KO hESC cell line by genomic editing with CRISPR/Cas9 technique. The CRISPR/Cas9 cutting site is on exon 10 of human BMAL1 gene. gRNA: guide RNA, PAM: protospacer adjacent motif. (B) Western blot of BMAL1 protein expression in wild type hESCs and BMAL1 KO positive hESC clones. (C) Flowcytometry analyses of cardiac differentiation efficiency of wild type and BMAL1 KO hESCs. Cardiomyocytes were stained with the classic cardiac marker cardiac troponin T (cTnT). (D) Representative transmission electron micrographs of sarcomeric structures in wild type and BMAL1 KO hESC-derived cardiomyocytes. Scales bar: 1 µm. (E) Immunostaining of cTnT and α-Actinin in wild type and BMAL1 KO hESC-derived cardiomyocytes. Scale bars: 50 µm. (F) Quantification of cell size for wild type and BMAL1 KO hESC-derived cardiomyocytes (n = 85 per group). (G) Higher percentage of disorganized sarcomeres for BMAL1 KO hESC-derived cardiomyocytes. (H) Detection of apoptosis by flowcytometry in wild type and BMAL1 KO hESC-derived cardiomyocytes. (I–K) Quantification of the ratio of annexin V/PI+ cells, annexin V+/PI cells and annexin V+/PI+ cells. Data were represented as means ± SD. *P < 0.05 and ****P < 0.0001 versus control by two-tailed Student’s t test
Figure 2
Figure 2
Phenotypic characterizations of BMAL1 KO hESCs-derived cardiomyocytes. (A) Schematic showing the design for generation of BMAL1 KO hESC cell line by genomic editing with CRISPR/Cas9 technique. The CRISPR/Cas9 cutting site is on exon 10 of human BMAL1 gene. gRNA: guide RNA, PAM: protospacer adjacent motif. (B) Western blot of BMAL1 protein expression in wild type hESCs and BMAL1 KO positive hESC clones. (C) Flowcytometry analyses of cardiac differentiation efficiency of wild type and BMAL1 KO hESCs. Cardiomyocytes were stained with the classic cardiac marker cardiac troponin T (cTnT). (D) Representative transmission electron micrographs of sarcomeric structures in wild type and BMAL1 KO hESC-derived cardiomyocytes. Scales bar: 1 µm. (E) Immunostaining of cTnT and α-Actinin in wild type and BMAL1 KO hESC-derived cardiomyocytes. Scale bars: 50 µm. (F) Quantification of cell size for wild type and BMAL1 KO hESC-derived cardiomyocytes (n = 85 per group). (G) Higher percentage of disorganized sarcomeres for BMAL1 KO hESC-derived cardiomyocytes. (H) Detection of apoptosis by flowcytometry in wild type and BMAL1 KO hESC-derived cardiomyocytes. (I–K) Quantification of the ratio of annexin V/PI+ cells, annexin V+/PI cells and annexin V+/PI+ cells. Data were represented as means ± SD. *P < 0.05 and ****P < 0.0001 versus control by two-tailed Student’s t test
Figure 3
Figure 3
Compromised contraction force and abnormal calcium handling in BMAL1 KO hESC-derived cardiomyocytes. (A) Representative traces of video detection for contraction movements from single wild type hESC-derived cardiomyocytes day 35 post differentiation. (B) Representative traces of video detection for contraction movements from single BMAL1 KO hESC-derived cardiomyocytes day 35 post differentiation. (C) Quantification of relative contraction force of single wild type and BMAL1 KO hESC-derived cardiomyocytes (n = 32 per group). (D) Representative Ca2+ line scan images and spontaneous Ca2+ transients in wild type and BMAL1 KO hESC-derived cardiomyocytes day 35 post differentiation. (E–J) Quantification of calcium handling parameters in wild type and BMAL1 KO hESC-derived cardiomyocytes. E, transient amplitude (average ΔF/F0). F, peak to peak time. G, ratio of cardiomyocytes with irregular Ca2+ transients. H, decay time. I, transient duration 50. J, time to peak. n = 25 in each group. Data were represented as mean ± SD. *P < 0.05, **P < 0.01 and ****P < 0.0001 versus control by two-tailed Student’s t test
Figure 4
Figure 4
Multi-electrode array analyses of electrophysiology of BMAL1 KO hESC-derived cardiomyocytes. (A) hESC-derived cardiomyocytes day 35 post differentiation cultured on a MEA probe coated with matrigel. Scale bar: 200 μm. (B) Typical field potential traces of hESC-derived cardiomyocytes recorded by MEA. (C) Representative MEA recordings showed field potential traces from wild type and BMAL1 KO hESC-derived cardiomyocytes day 35 post differentiation. (D) Quantification of beating frequency of wild type and BMAL1 KO hESC-derived cardiomyocytes in response to epinephrine and metoprolol. Data were represented as mean ± SD. The statistics were from 3 independent experiments. *P < 0.05 and **P < 0.01 versus control by two-tailed Student’s t test
Figure 5
Figure 5
BMAL1 KO hESC-derived cardiomyocytes exhibited mitochondrial hyperfusion and compromised mitochondrial autophagy. (A) Representative transmission electron micrographs of mitochondria (red arrows) from wild type and BMAL1 KO hESC-derived cardiomyocytes day 35 post differentiation. Mitochondrial enlargement in BMAL1 KO hESC-derived cardiomyocytes was apparent. (B) Quantification of mitochondrial size in wild type and BMAL1 KO hESC-derived cardiomyocytes day 35 post differentiation. (C) Quantification of the ratio of mitochondrial area-perimeter indicated mitochondrial fusion level (enlarged and fused mitochondria possess greater area-perimeter ratio) was upregulated in BMAL1 KO hESC-derived cardiomyocytes (n = 40). (D) Representative confocal images showing RFP-tagged mitochondria (white arrows) in wild type and BMAL1 KO hESC-derived cardiomyocytes day 35 post differentiation. Cox8a-RFP adenovirus was used to tag mitochondria. (E) Western blot analysis of level of Mfn2 proteins regulating mitochondrial dynamics. (F) Quantification of Western blot signals in (E) and normalized to the loading control (α-ACTIN). (G) Transmission electron microscopy examining alterations in mitochondrial autophagy (red arrows) in wild type and BMAL1 KO hESC-derived cardiomyocytes day 35 post differentiation. (H) Mitophagy was counted in 10 different transmission electron images of wild type and BMAL1 KO hESC-derived cardiomyocytes day 35, respectively. (I) Mitophagy intensity in wild type and BMAL1 KO hESC-derived cardiomyocytes day 35 post differentiation analyzed by flowcytometry. (J) Mean intensity of BMAL1 KO hESC-derived cardiomyocytes was markedly decreased. (K) Western blot evaluation of protein expression level of SQSTM1 and LC3A/B-II in wild type and BMAL1 KO hESC-derived cardiomyocytes day 35 post differentiation. (L) Quantification of Western blot signals in (I) and normalized to the loading control (α-ACTIN). n = 3 for each group. (M) Real-time respiration measurements of wild type and BMAL1 KO hESC-derived cardiomyocytes day 35 post differentiation. (N) Statistics of respiration parameters between wild type and BMAL1 KO hESC-derived cardiomyocytes day 35 post differentiation. n = 4 for each group. Data were represented as mean ± SD. *P < 0.05, **P < 0.01, ***P < 0.001, ****P < 0.0001 versus control by two-tailed Student’s t test
Figure 6
Figure 6
Mitochondria in cardiomyocytes of Bmal1-deficient mice exhibited increased fusion and decreased mitophagy. (A) Significantly enlarged mitochondria were observed in Bmal1-deficient myocardium comparing to those in the wild type group. Arrows indicate mitochondria. (B and C) Mitochondrial size and area-perimeter ratio were carried out for the quantification of mitochondrial fusion level (enlarged and fused mitochondria possess greater area-perimeter ratio). (D) The protein expression level of MFN2 was calculated by western Blotting analysis evaluation (expressed as the ratio of β-ACTIN). (E) Columns in graphs show protein normalized for β-ACTIN. (F) Less mitophagy take place in Bmal1−/− mice myocardium than in wild type control group. (G) Mitophagy were counted in 12 different transmission electron images of Bmal1−/− mice myocardium and wild type control group, respectively. (H and I) The protein expression level of LC3A/BI/IIand BNIP3 were assessed by Western Blotting analysis evaluation (expressed as the ratio of LC3A/BII and BNIP3 to β-ACTIN). Data represented the mean ± SD. *P < 0.05, **P < 0.01 and ****P < 0.0001 versus wide type by two-tailed Student’s t test
Figure 7
Figure 7
BNIP3 is controlled by circadian gene BMAL1 via transcription regulation. (A) BMAL1 ChIP-seq showed binding signals on the promoter region of Bnip3 in human U2OS cells (CistromeDB: 71023). The arrow indicates transcription start site (TSS) of the Bnip3 gene. (B) Relative expression of Bnip3 was analyzed in wild type and BMAL1 KO hESC-derived cardiomyocytes day 35 post differentiation. (C) Western Blot showed that the expression of BNIP3 in BMAL1 KO hESC-derived cardiomyocytes was significantly lower than that in wild type cardiomyocytes. (D) The mRNA levels of BNIP3 in BMAL1 KO hESC-derived cardiomyocytes day 35 post differentiation decreased significantly. (E) ChIP analysis of Bmal1 binding to the E-box region of BNIP3 in hESC-derived cardiomyocytes at day 35 post differentiation. (F) Dual luciferase reporter assays revealed that transcriptional activation of Bnip3 in HEK 293 cells by BMAL1. Graph represented firefly luciferase expression normalized to renilla luciferase for each group. Data were mean ± SD from three biological replicates. *P < 0.05, **P < 0.01 and ***P < 0.001 versus control by two-tailed Student’s t test
Figure 8
Figure 8
The regulatory mechanism of BMAL1 in mitophagy of cardiomyocyte and DCM. Our study demonstrated that BMAL1 is able to bind to the E-box element in the promoter region of BNIP3 gene and specifically control BNIP3 protein expression, hence directly affecting the BNIP3-mediated mitochondria quality control process. The circadian gene Bmal1 is critical in the maintenance of normal mitochondria activities and cardiac function

References

    1. Alibhai FJ, LaMarre J, Reitz CJ, Tsimakouridze EV, Kroetsch JT, Bolz SS, Shulman A, Steinberg S, Burris TP, Oudit GY, et al. Disrupting the key circadian regulator CLOCK leads to age-dependent cardiovascular disease. J Mol Cell Cardiol. 2017;105:24–37. - PubMed
    1. Alibhai FJ, Reitz CJ, Peppler WT, Basu P, Sheppard P, Choleris E, Bakovic M, Martino TA. Female ClockDelta19/Delta19 mice are protected from the development of age-dependent cardiomyopathy. Cardiovasc Res. 2018;114:259–271. - PubMed
    1. Ang YS, Rivas RN, Ribeiro AJS, Srivas R, Rivera J, Stone NR, Pratt K, Mohamed TMA, Fu JD, Spencer CI, et al. Disease model of GATA4 mutation reveals transcription factor cooperativity in human cardiogenesis. Cell. 2016;167(1734–1749):e1722. - PMC - PubMed
    1. Azad MB, Chen Y, Henson ES, Cizeau J, McMillan-Ward E, Israels SJ, Gibson SB. Hypoxia induces autophagic cell death in apoptosis-competent cells through a mechanism involving BNIP3. Autophagy. 2008;4:195–204. - PMC - PubMed
    1. Balsalobre A, Damiola F, Schibler U. A serum shock induces circadian gene expression in mammalian tissue culture cells. Cell. 1998;93:929–937. - PubMed

Publication types

MeSH terms