

Human leukocyte antigen selected allogeneic mesenchymal stromal cell therapy in renal transplantation: The Neptune study, a phase I single-center study
- PMID: 32277568
- PMCID: PMC7586810
- DOI: 10.1111/ajt.15910
Human leukocyte antigen selected allogeneic mesenchymal stromal cell therapy in renal transplantation: The Neptune study, a phase I single-center study
Abstract
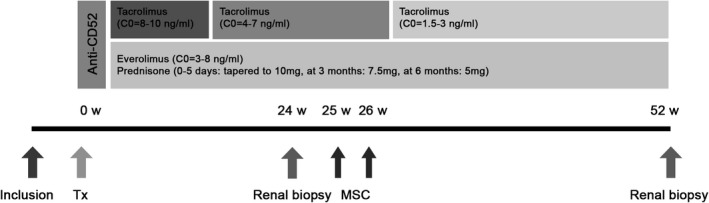
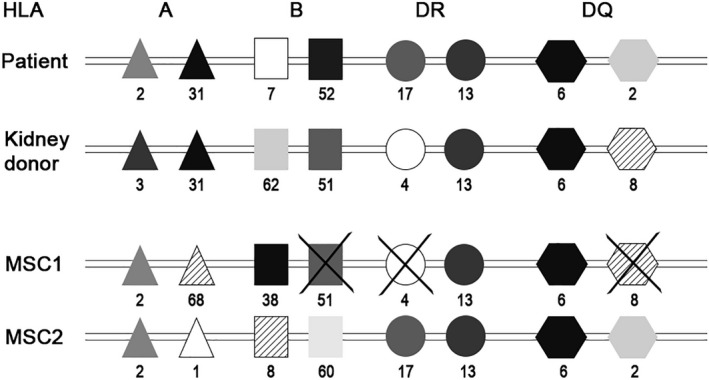
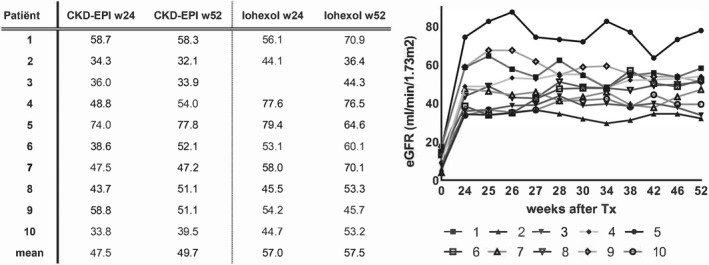
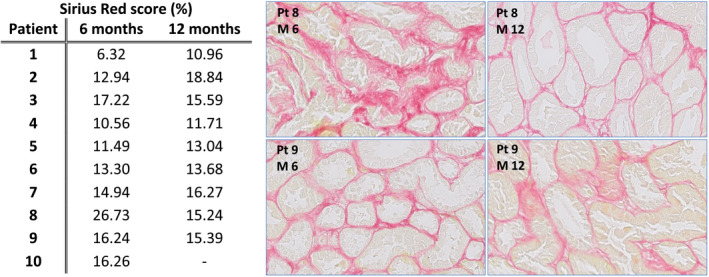
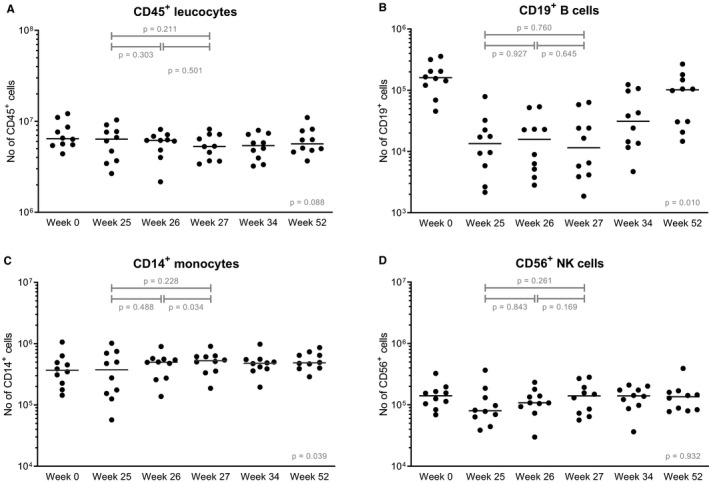
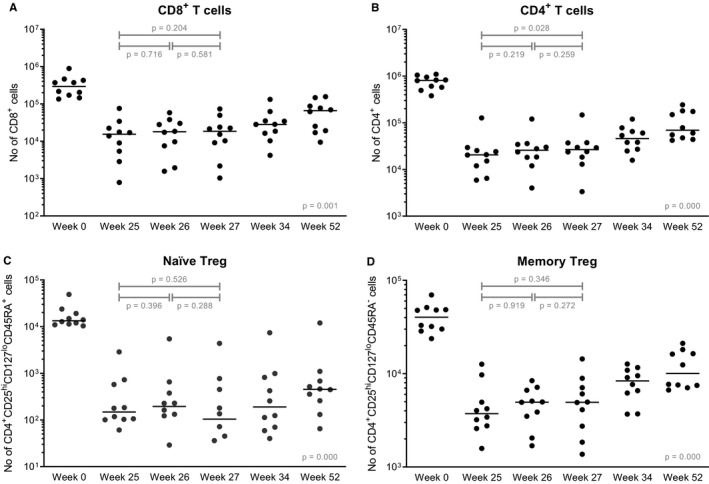
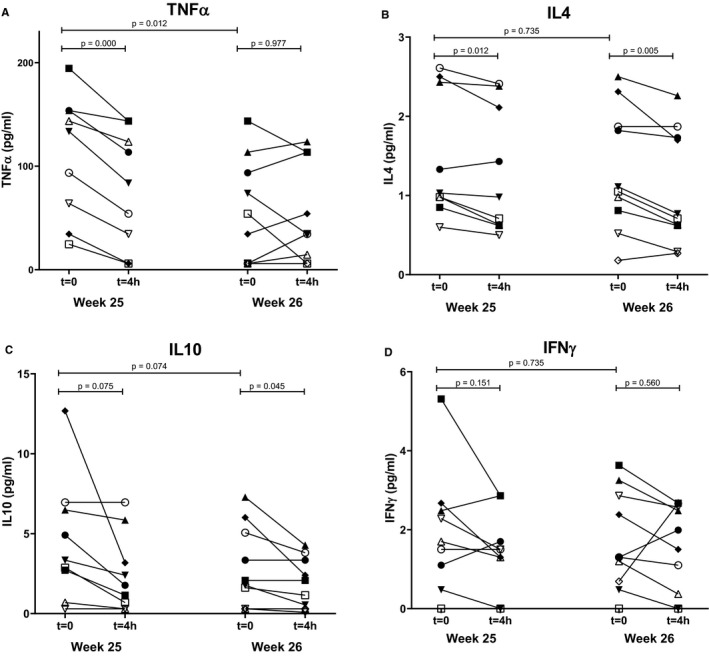
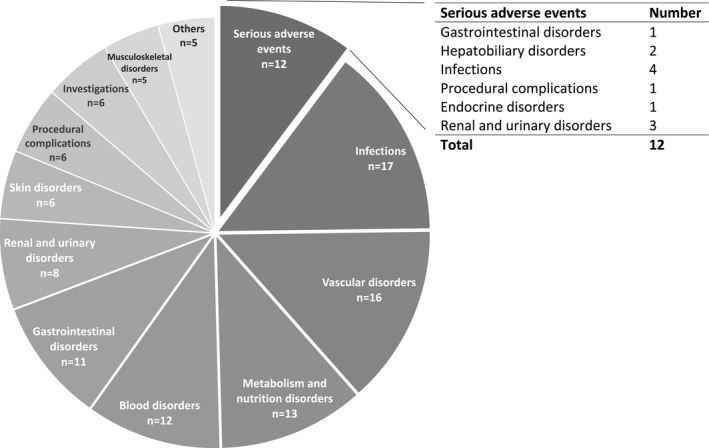
Mesenchymal stromal cells (MSC) hold promise as a novel immune-modulatory therapy in organ transplantation. First clinical studies have used autologous MSCs; however, the use of allogeneic "off-the-shelf" MSCs is more sustainable for broad clinical implementation, although with the risk of causing sensitization. We investigated safety and feasibility of allogeneic MSCs in renal transplantation, using a matching strategy that prevented repeated mismatches. Ten patients received two doses of 1.5 × 10⁶ /kg allogeneic MSCs 6 months after transplantation in a single-center nonrandomized phase Ib trial, followed by lowering of tacrolimus (trough level 3 ng/mL) in combination with everolimus and prednisone. Primary end point was safety, measured by biopsy proven acute rejection (BPAR) and graft loss 12 months after transplantation. Immune monitoring was performed before and after infusion. No BPAR or graft loss occurred and renal function remained stable. One patient retrospectively had DSAs against MSCs, formed before infusion. No major alterations in T and B cell populations or plasma cytokines were observed upon MSC infusion. Administration of HLA selected allogeneic MSCs combined with low-dose tacrolimus 6 months after transplantation is safe at least in the first year after renal transplantation. This sets the stage to further explore the efficacy of third-party MSCs in renal transplantation.
Keywords: clinical research/practice; clinical trial; immune regulation; immunosuppression/immune modulation; kidney transplantation/nephrology; monitoring: immune; stem cells.
© 2020 The Authors. American Journal of Transplantation published by Wiley Periodicals Inc. on behalf of The American Society of Transplantation and the American Society of Transplant Surgeons.
Conflict of interest statement
The authors of this manuscript have no conflicts of interest to disclose as described by the
Figures
Similar articles
-
Safety of allogeneic bone marrow derived mesenchymal stromal cell therapy in renal transplant recipients: the neptune study.J Transl Med. 2015 Nov 4;13:344. doi: 10.1186/s12967-015-0700-0. J Transl Med. 2015. PMID: 26537851 Free PMC article. Clinical Trial.
-
Allogeneic mesenchymal stromal cell therapy in kidney transplantation: should repeated human leukocyte antigen mismatches be avoided?Front Genet. 2024 Sep 27;15:1436194. doi: 10.3389/fgene.2024.1436194. eCollection 2024. Front Genet. 2024. PMID: 39399215 Free PMC article.
-
Autologous bone marrow derived mesenchymal stromal cell therapy in combination with everolimus to preserve renal structure and function in renal transplant recipients.J Transl Med. 2014 Dec 10;12:331. doi: 10.1186/s12967-014-0331-x. J Transl Med. 2014. PMID: 25491391 Free PMC article. Clinical Trial.
-
The Importance of HLA Assessment in "Off-the-Shelf" Allogeneic Mesenchymal Stem Cells Based-Therapies.Int J Mol Sci. 2019 Nov 13;20(22):5680. doi: 10.3390/ijms20225680. Int J Mol Sci. 2019. PMID: 31766164 Free PMC article. Review.
-
Efficacy and safety of mesenchymal stem cells co-infusion in allogeneic hematopoietic stem cell transplantation: a systematic review and meta-analysis.Stem Cell Res Ther. 2021 Apr 20;12(1):246. doi: 10.1186/s13287-021-02304-x. Stem Cell Res Ther. 2021. PMID: 33879242 Free PMC article.
Cited by
-
Extracorporeal Photopheresis Improves Graft Survival in a Full-Mismatch Rat Model of Kidney Transplantation.Transpl Int. 2023 Jan 12;36:10840. doi: 10.3389/ti.2023.10840. eCollection 2023. Transpl Int. 2023. PMID: 36713113 Free PMC article.
-
Challenges and advances in clinical applications of mesenchymal stromal cells.J Hematol Oncol. 2021 Feb 12;14(1):24. doi: 10.1186/s13045-021-01037-x. J Hematol Oncol. 2021. PMID: 33579329 Free PMC article. Review.
-
cGAS-STING pathway in ischemia-reperfusion injury: a potential target to improve transplantation outcomes.Front Immunol. 2023 Sep 21;14:1231057. doi: 10.3389/fimmu.2023.1231057. eCollection 2023. Front Immunol. 2023. PMID: 37809088 Free PMC article. Review.
-
Immune modulation in transplant medicine: a comprehensive review of cell therapy applications and future directions.Front Immunol. 2024 Apr 8;15:1372862. doi: 10.3389/fimmu.2024.1372862. eCollection 2024. Front Immunol. 2024. PMID: 38650942 Free PMC article. Review.
-
Progress toward the Clinical Application of Mesenchymal Stromal Cells and Other Disease-Modulating Regenerative Therapies: Examples from the Field of Nephrology.Kidney360. 2021 Mar;2(3):542-557. doi: 10.34067/KID.0005692020. Kidney360. 2021. PMID: 34316720 Free PMC article. Review.
References
-
- Coemans M, Süsal C, Döhler B, et al. Analyses of the short‐ and long‐term graft survival after kidney transplantation in Europe between 1986 and 2015. Kidney Int. 2018;94(5):964‐973. - PubMed
-
- El‐Zoghby ZM, Stegall MD, Lager DJ, et al. Identifying specific causes of kidney allograft loss. Am J Transplant. 2009;9(3):527‐535. - PubMed
-
- Wekerle T, Segev D, Lechler R, Oberbauer R. Strategies for long‐term preservation of kidney graft function. Lancet. 2017;389(10084):2152‐2162. - PubMed
-
- Süsal C, Aykut G, Morath C, et al. Relevance of donor‐specific antibody monitoring after kidney transplantation: findings from the collaborative transplant study and the Heidelberg transplant center. HLA. 2019;94:11‐15. - PubMed
-
- Reinders ME, de Fijter JW, Rabelink TJ. Mesenchymal stromal cells to prevent fibrosis in kidney transplantation. Curr Opin Organ Transplant. 2014;19(1):54‐59. - PubMed
Publication types
MeSH terms
Substances
LinkOut - more resources
Full Text Sources
Medical
Research Materials
