

Mathematical model of infection kinetics and its analysis for COVID-19, SARS and MERS
- PMID: 32278147
- PMCID: PMC7141629
- DOI: 10.1016/j.meegid.2020.104306
Mathematical model of infection kinetics and its analysis for COVID-19, SARS and MERS
Abstract
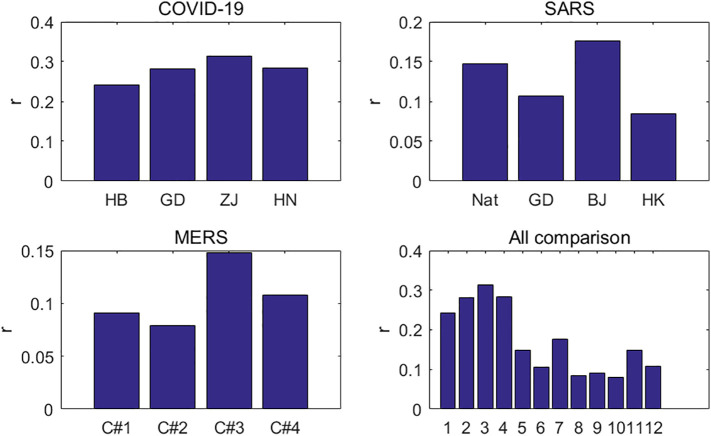
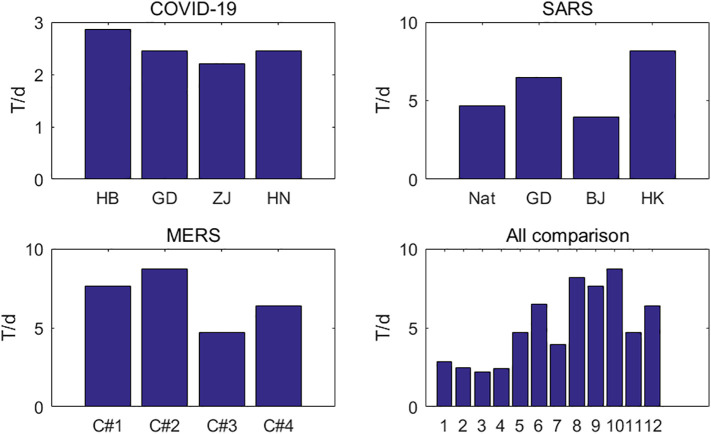
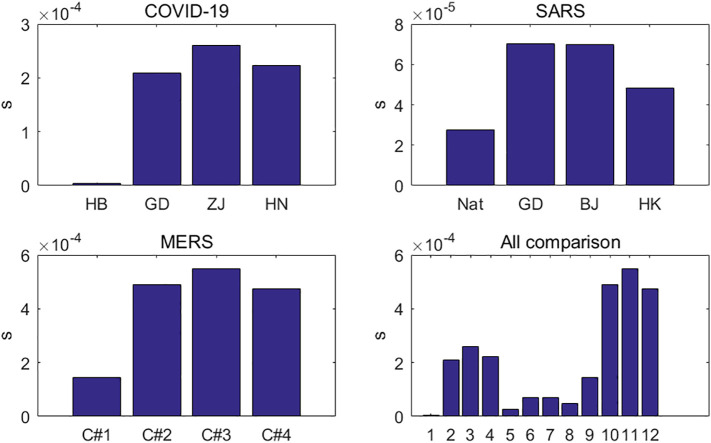
The purpose of this paper is to reveal the spread rules of the three pneumonia: COVID-19, SARS and MERS. We compare the new spread characteristics of COVID-19 with those of SARS and MERS. By considering the growth rate and inhibition constant of infectious diseases, their propagation growth model is established. The parameters of the three coronavirus transmission growth models are obtained by nonlinear fitting. Parametric analysis shows that the growth rate of COVID-19 is about twice that of the SARS and MERS, and the COVID-19 doubling cycle is two to three days, suggesting that the number of COVID-19 patients would double in two to three days without human intervention. The infection inhibition constant in Hubei is two orders of magnitude lower than in other regions, which reasonably explains the situation of the COVID-19 outbreak in Hubei.
Keywords: 2008 MSC: R181.2; COVID-19; Coronavirus; Infectious kinetics; MERS; SARS.
Copyright © 2020 Elsevier B.V. All rights reserved.
Conflict of interest statement
Declaration of Competing Interest The authors declared that they have no conflicts of interest to this work.
Figures
References
-
- Bi N., Liang K.H. Iteratively reweighted algorithm for signals recovery with coherent tight frame. Math. Meth. Appl. Sci. 2018;41:5481–5492.
-
- Chen X., Tan M., Zhao J. Identifying influential nodes in complex networks based on a spreading influence related centrality. Phy. A: Stat. Mech. Appl. 2019;22(5):536–557.
-
- Ding Q., Li W., Hu X. The SIS diffusion process in complex networks with independent spreaders. Phy. A: Stat. Mech. Appl. 2019;16(5):1102–1136.
-
- Fan R., Wang Y., Luo M. SEIR-based novel pneumonia transmission model and inflection point prediction analysis. J. Univ. Elec. Sci. Tech. China. 2020;2:1–6.
Publication types
MeSH terms
LinkOut - more resources
Full Text Sources
Miscellaneous
