

Mild behavioral impairment in Parkinson's disease is associated with altered corticostriatal connectivity
- PMID: 32279019
- PMCID: PMC7152681
- DOI: 10.1016/j.nicl.2020.102252
Mild behavioral impairment in Parkinson's disease is associated with altered corticostriatal connectivity
Abstract
Background: Mild behavioral impairment (MBI) is a syndrome characterized by later life onset, sustained neuropsychiatric symptoms as a marker of dementia risk. In Parkinson's disease (PD), MBI has been associated with worse cognitive abilities and increased cortical atrophy. However, the circuit level correlates of MBI have not been investigated in this population. Our objective was to investigate the relationship between MBI and corticostriatal connectivity in PD patients. This emphasis on corticostriatal connectivity was due to the significant role of these circuits in neuropsychiatric and cognitive symptoms across disease conditions.
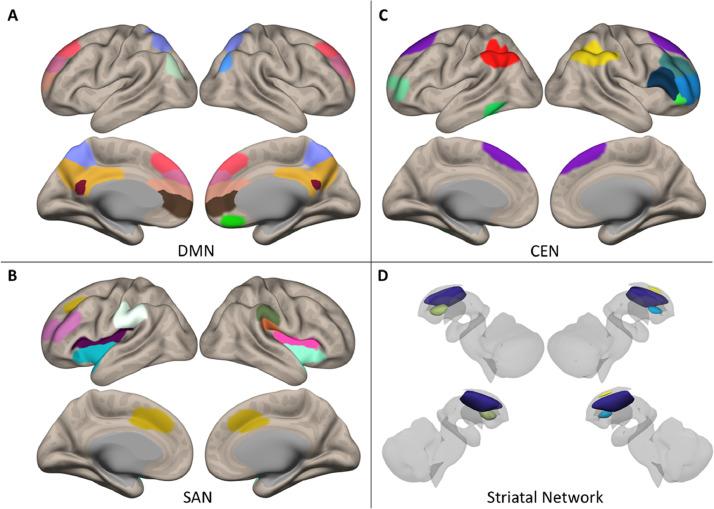
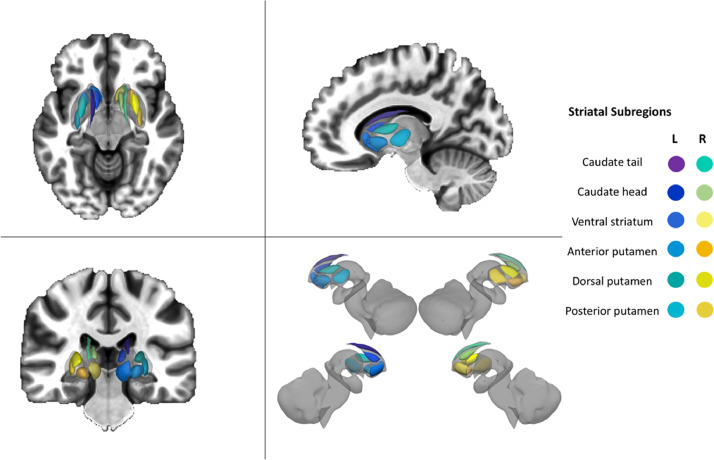
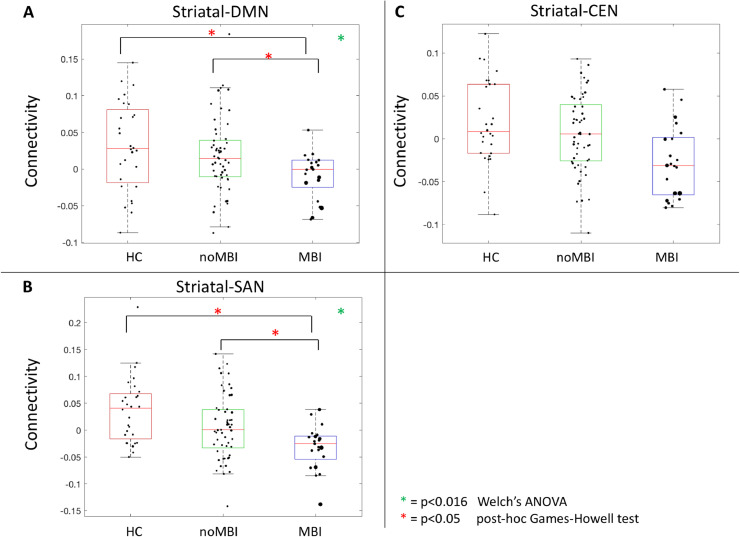
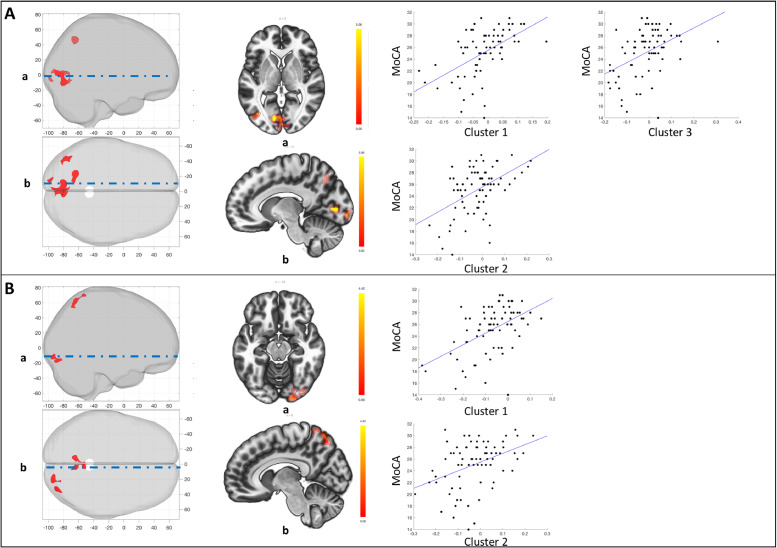
Methods: Seventy-four non-demented patients with PD were administered the MBI-checklist, and classified as having high MBI (PD-MBI; n = 21) or low MBI scores (PD-noMBI; n = 53). Corticostriatal connectivity was assessed with both an atlas and seed-based analysis. The atlas analysis consisted of calculating the average connectivity between the striatal network and the default mode (DMN), central executive (CEN), and saliency networks (SAN). Structural measurements of cortical thickness and volume were also assessed. PD-MBI and PD-noMBI patients were compared, along with a group of age matched healthy control subjects (HC; n = 28). Subsequently, a seed analysis assessed the relationship of MBI scores with the connectivity of twelve seeds within the striatum while controlling for cognitive ability. A complementary analysis assessed the relationship between striatal connectivity and cognition, while controlling for MBI-C.
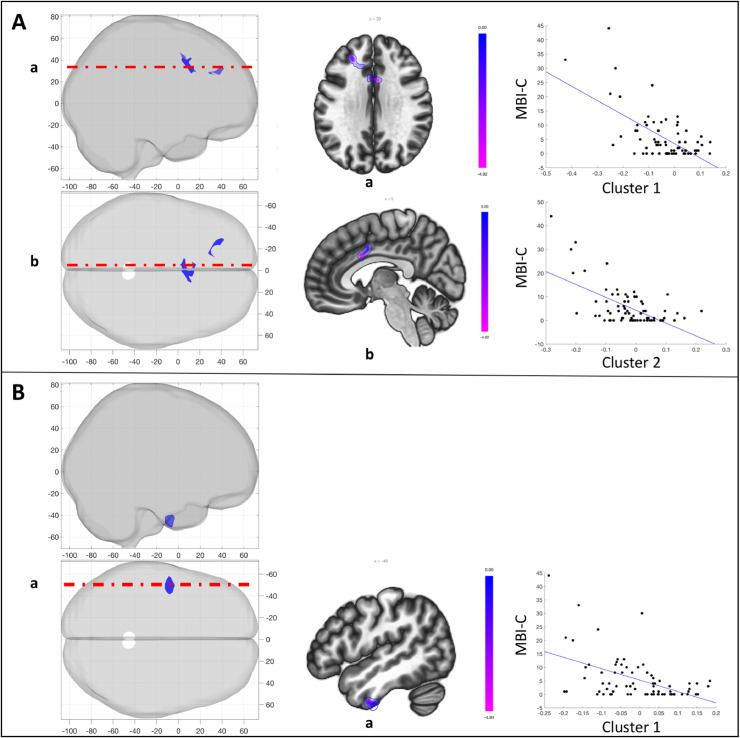
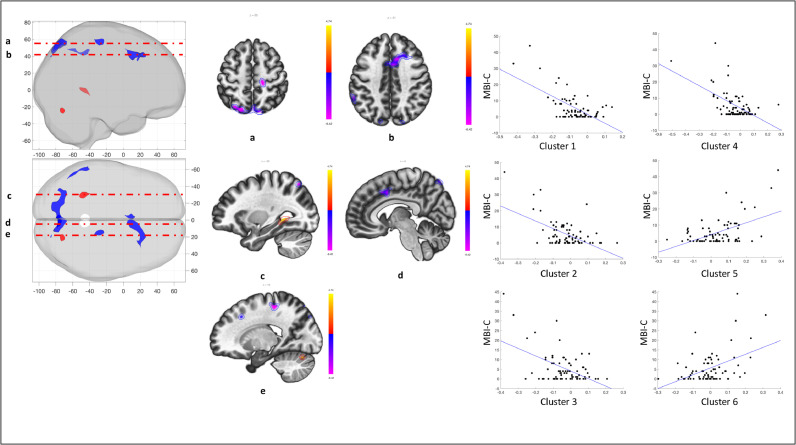
Results: PD-MBI demonstrated decreased connectivity between the striatum and both the DMN and SAN compared to PD-noMBI and HC. The decreased connectivity between the striatum and the SAN was explained partly by increased atrophy within the SAN in PD-MBI. The seed analysis revealed a relationship between higher MBI scores and lower connectivity of the left caudate head to the dorsal anterior cingulate cortex and left middle frontal gyrus. Higher MBI-C scores were also related to decreased connectivity of the right caudate head with the anterior cingulate cortex, precuneus, and left supramarginal gyrus, as well as increased connectivity to the left hippocampus and right cerebellar hemisphere. Caudate-precuneus connectivity was independently associated with both global behavioural and cognitive scores.
Conclusion: These results suggest PD-MBI is associated with altered corticostriatal connectivity, particularly between the head of the caudate and cortical regions associated with the DMN and SAN. In particular, caudate-precuneus connectivity is associated with both global behavioral and cognitive symptoms in PD.
Keywords: Basal ganglia; Cognition; Corticostriatal connectivity; Default mode network; Mild behavioral impairment; Parkinson's disease; Resting state.
Copyright © 2020 The Author(s). Published by Elsevier Inc. All rights reserved.
Conflict of interest statement
Declaration of Competing Interest There are no conflicts of interest to declare for any author.
Figures
References
-
- Alexander G.E., DeLong M.R., Strick P.L. Parallel organization of functionally segregated circuits linking basal ganglia and cortex. Annu. Rev. Neurosci. 1986;9:357–381. - PubMed
-
- Anderkova L., Barton M., Rektorova I. Striato-cortical connections in Parkinson's and Alzheimer's diseases: relation to cognition. Mov. Disord. 2017;32:917–922. - PubMed
-
- Baggio H.C., Segura B., Garrido-Millan J.L., Marti M.J., Compta Y., Valldeoriola F., Tolosa E., Junque C. Resting-state frontostriatal functional connectivity in Prkinson's disease-related apathy. Mov. Disord. 2015;30:671–679. - PubMed
Publication types
MeSH terms
Grants and funding
LinkOut - more resources
Full Text Sources
Medical
