

Use of Google Trends to investigate loss-of-smell-related searches during the COVID-19 outbreak
- PMID: 32279437
- PMCID: PMC7262261
- DOI: 10.1002/alr.22580
Use of Google Trends to investigate loss-of-smell-related searches during the COVID-19 outbreak
Abstract
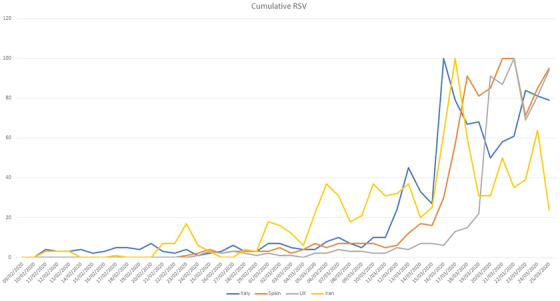
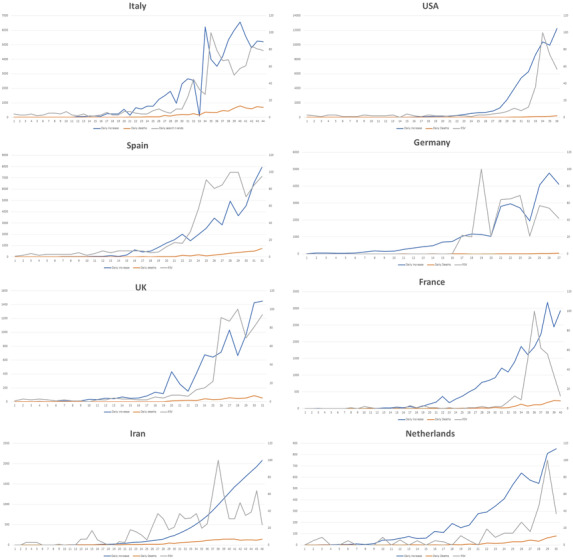
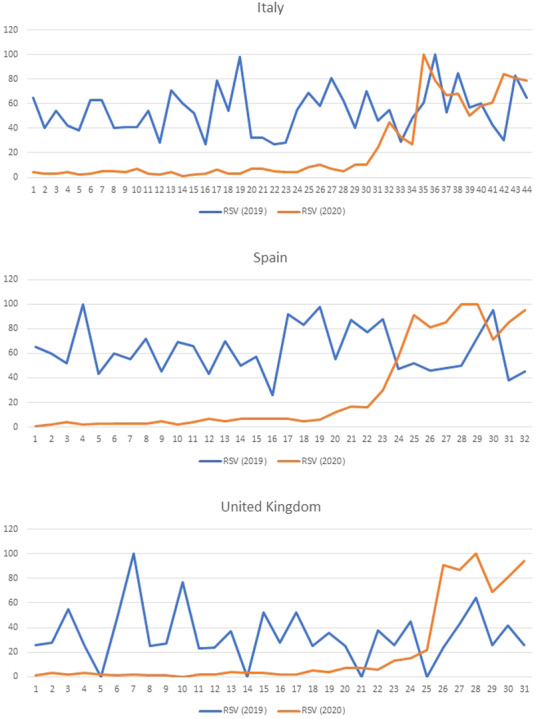
Background: Initial reports describing coronavirus 2019 (COVID-19) were dominated by the presence of cough, breathlessness, and fever; anecdotal reports suggested anosmia may also be a manifestation. We used Google Trends (GT) to investigate whether there was a surge in individuals searching for information related to smell loss during the COVID-19 epidemic in Italy, Spain, the United Kingdom, the United States, Germany, France, Iran, and The Netherlands.
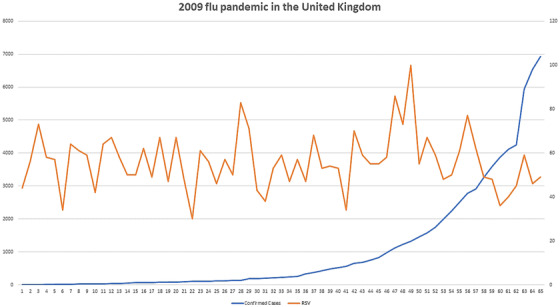
Methods: GT was used to explore internet activity related to loss of smell in the 8 aforementioned countries. Spearman rank analysis was performed to correlate loss-of-smell-relative search volumes (RSVs), with the increases of daily confirmed cases of COVID-19 and deaths attributed to disease. As a control event, we also performed analysis of smell-related searches during the last UK influenza epidemic of 2009.
Results: In all 8 countries, we observed strong correlations between daily RSVs related to loss of smell, increases of daily COVID-19+ cases and deaths ranging from 0.633 to 0.952. All correlations were statistically significant (p < 0.05).
Conclusion: There is a strong correlation between the frequency of searches for smell-related information and the onset of COVID-19 infection in Italy, Spain, UK, USA, Germany, France, Iran, and The Netherlands. We hypothesize this may relate to a previously underrecognized symptom.
Keywords: COVID-19; Google Trends; coronavirus; loss of smell; symptom variation.
© 2020 ARS-AAOA, LLC.
Figures
Comment in
-
Use of Google Trends to investigate anosmia: power and pitfalls of infodemiology.Int Forum Allergy Rhinol. 2021 May;11(5):957-960. doi: 10.1002/alr.22725. Epub 2020 Nov 2. Int Forum Allergy Rhinol. 2021. PMID: 33078575 No abstract available.
References
-
- NHS UK . https://www.nhs.uk/conditions/coronavirus-covid-19/symptoms-and-what-to-do/. Accessed March 25, 2020.
-
- Carneiro HA, Mylonakis E. Google Trends: a web‐based tool for real‐time surveillance of disease outbreaks. Clin Infect Dis. 2009;49:1557‐1564. - PubMed
-
- Bousquet J, Agache I, Anto JM, et al. Google Trends terms reporting rhinitis and related topics differ in European countries. Allergy. 2017;72:1261‐1266. - PubMed
-
- Google China . 2020. https://en.wikipedia.org/wiki/Google_China. Accessed March 25, 2020.
MeSH terms
LinkOut - more resources
Full Text Sources
Medical
Research Materials
Miscellaneous
