. 2020 Jun;130(2):153-160.
doi: 10.1016/j.ymgme.2020.03.008. Epub 2020 Apr 2.

Development of a neurologic severity scale for Aicardi Goutières Syndrome

Affiliations

Development of a neurologic severity scale for Aicardi Goutières Syndrome

Laura A Adang et al. Mol Genet Metab. 2020 Jun.

Erratum in

Abstract

Background and purpose: Aicardi Goutières Syndrome (AGS) is a severe, autoinflammatory leukodystrophy characterized by global neurologic dysfunction. Our goal was to create an easy-to-apply scale relevant to the unique developmental challenges associated with AGS.

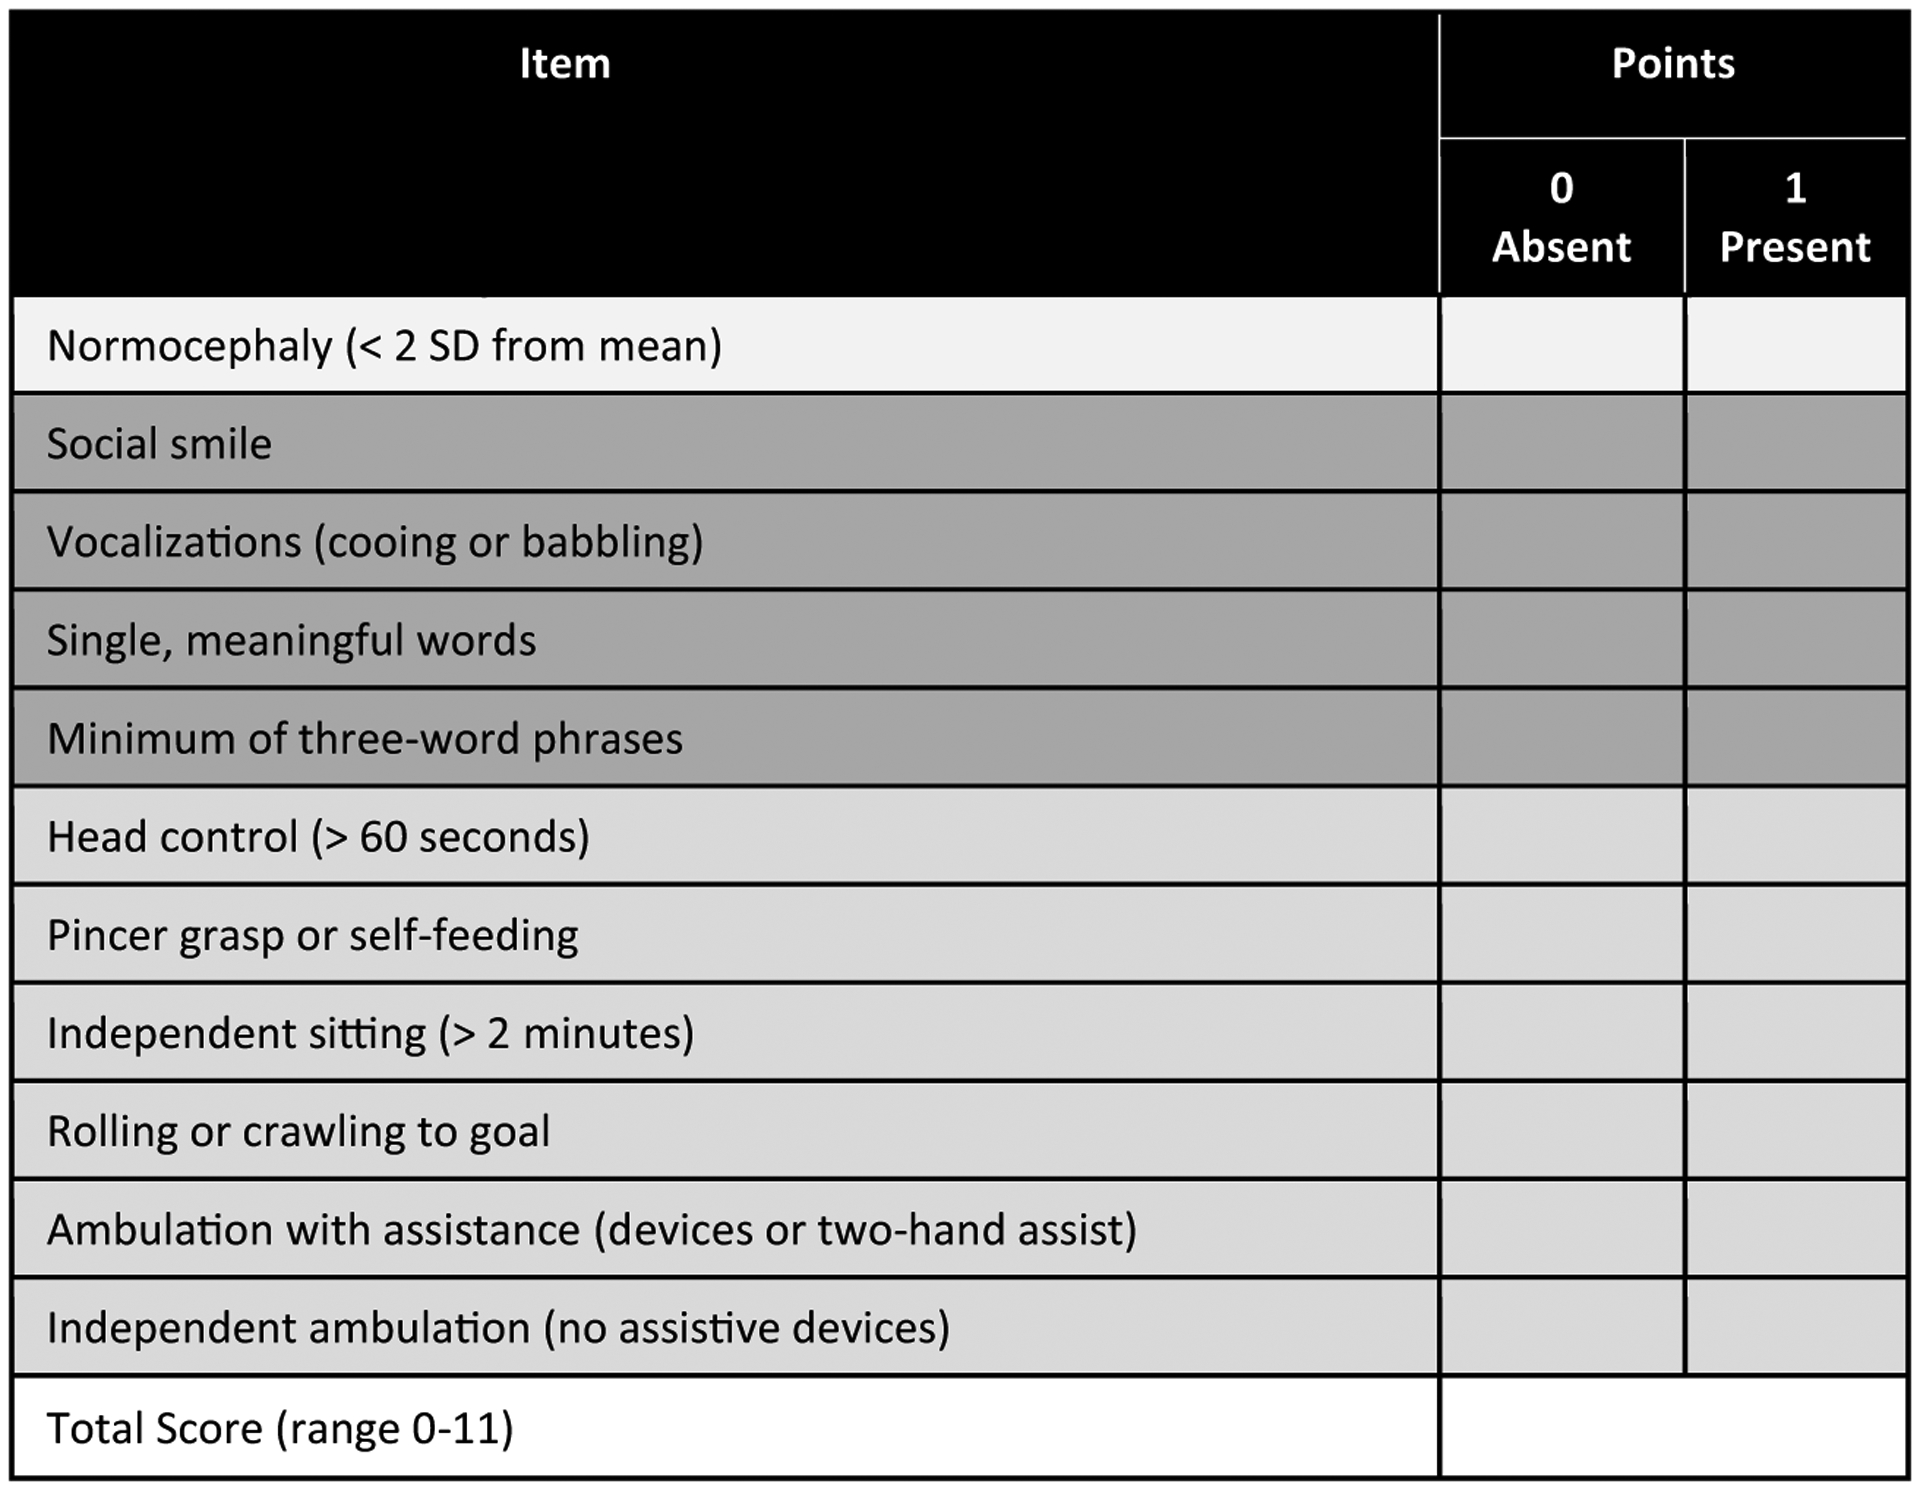
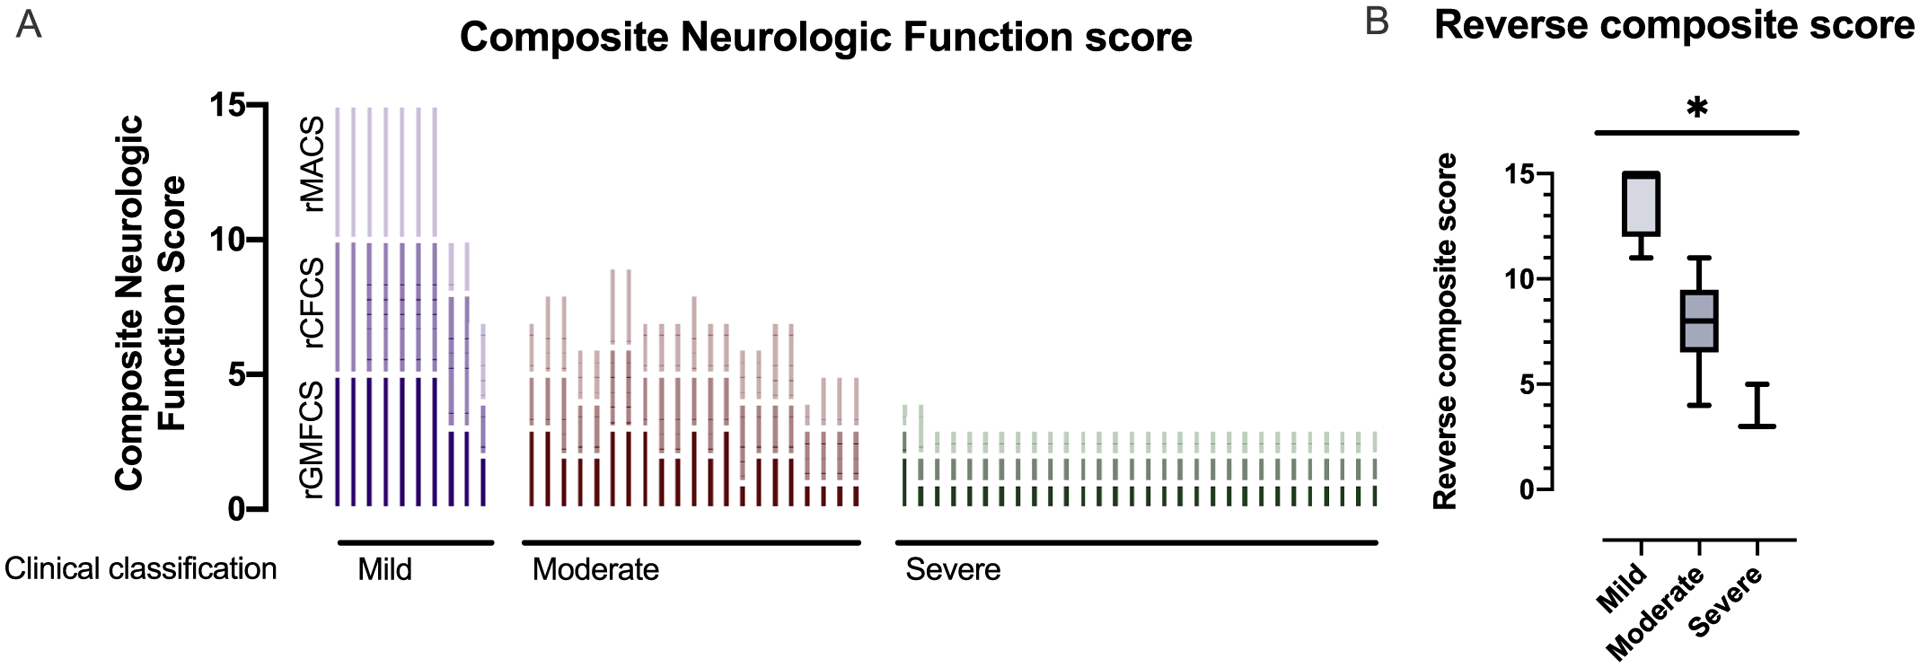
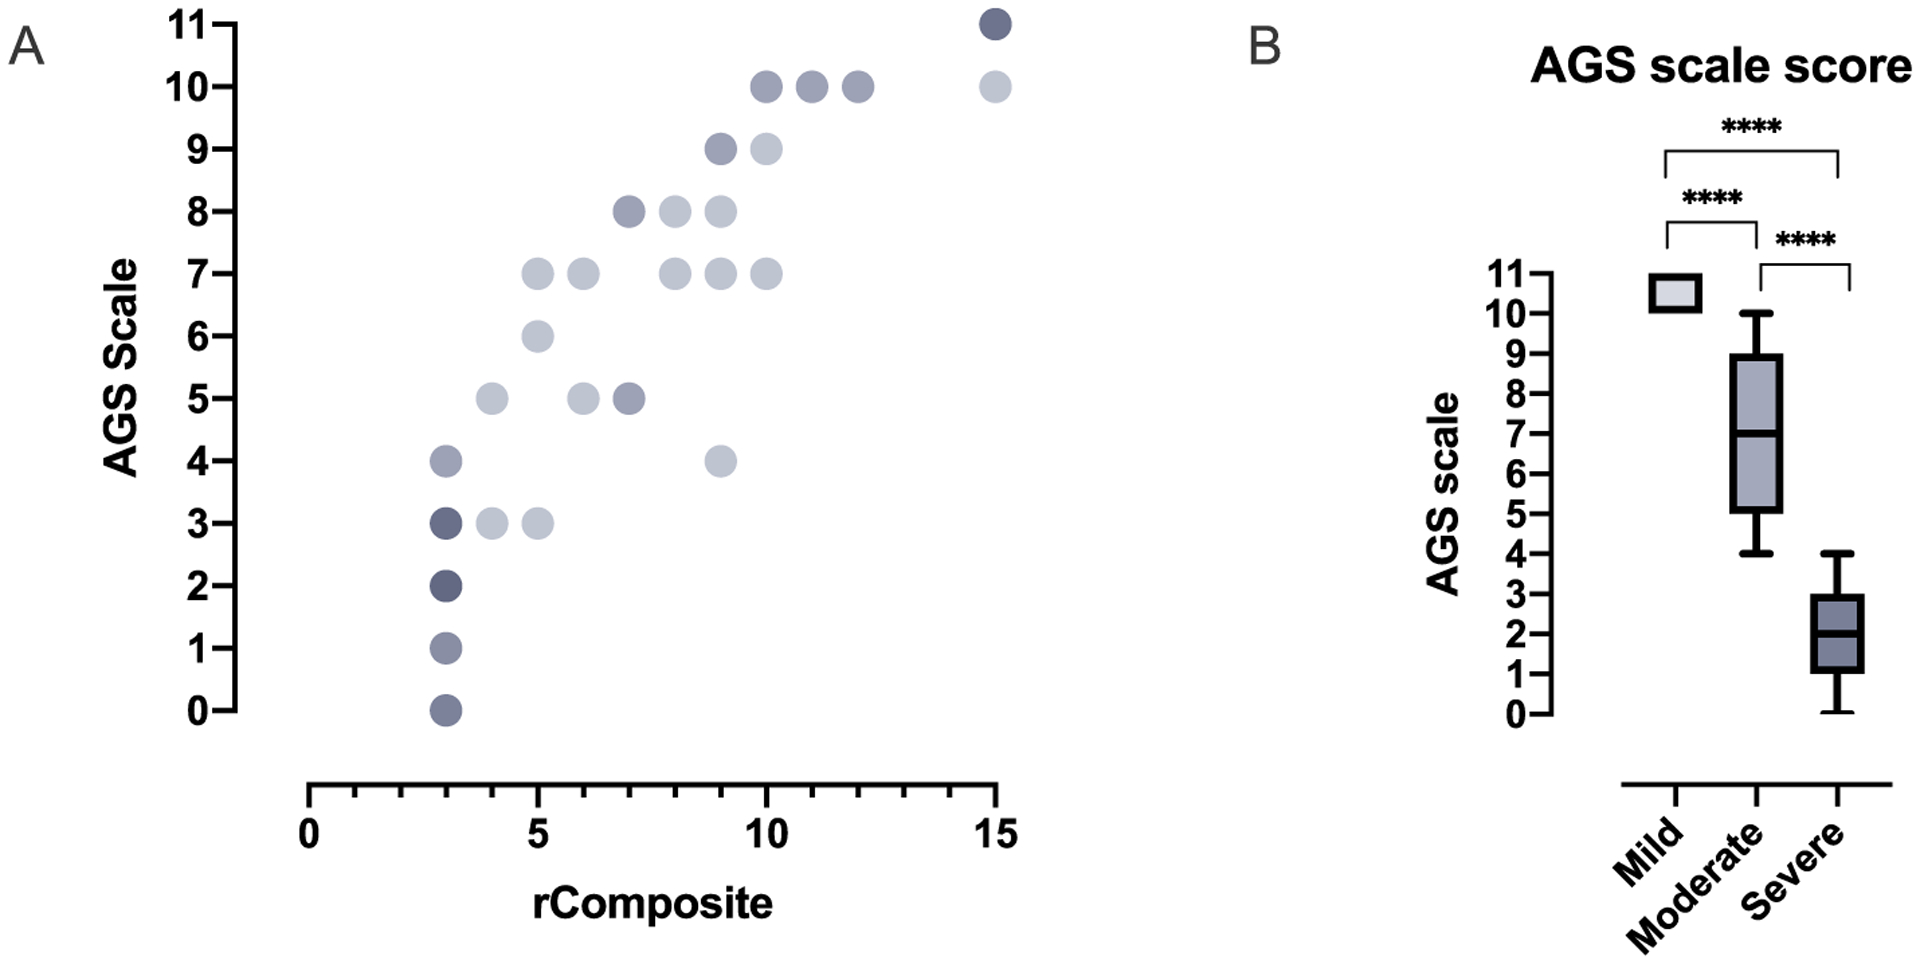
Methods: All individuals were recruited through our natural history study. Individuals were classified by AGS severity as mild, moderate, or severe, and clinical encounters were assigned a composite score for neurologic function calculated from the sum of three functional classification scales. Through expert consensus, we identified 11 key items to reflect the severity of AGS across gross motor, fine motor, and cognitive skills to create the AGS Scale. There was strong interrater reliability. The AGS scale was applied across available medical records to evaluate neurologic function over time. The AGS scale was compared to performance on a standard measure of gross motor function (Gross Motor Function Measure-88, GMFM-88) and a putative diagnostic biomarker of disease, the interferon signaling gene expression score (ISG).

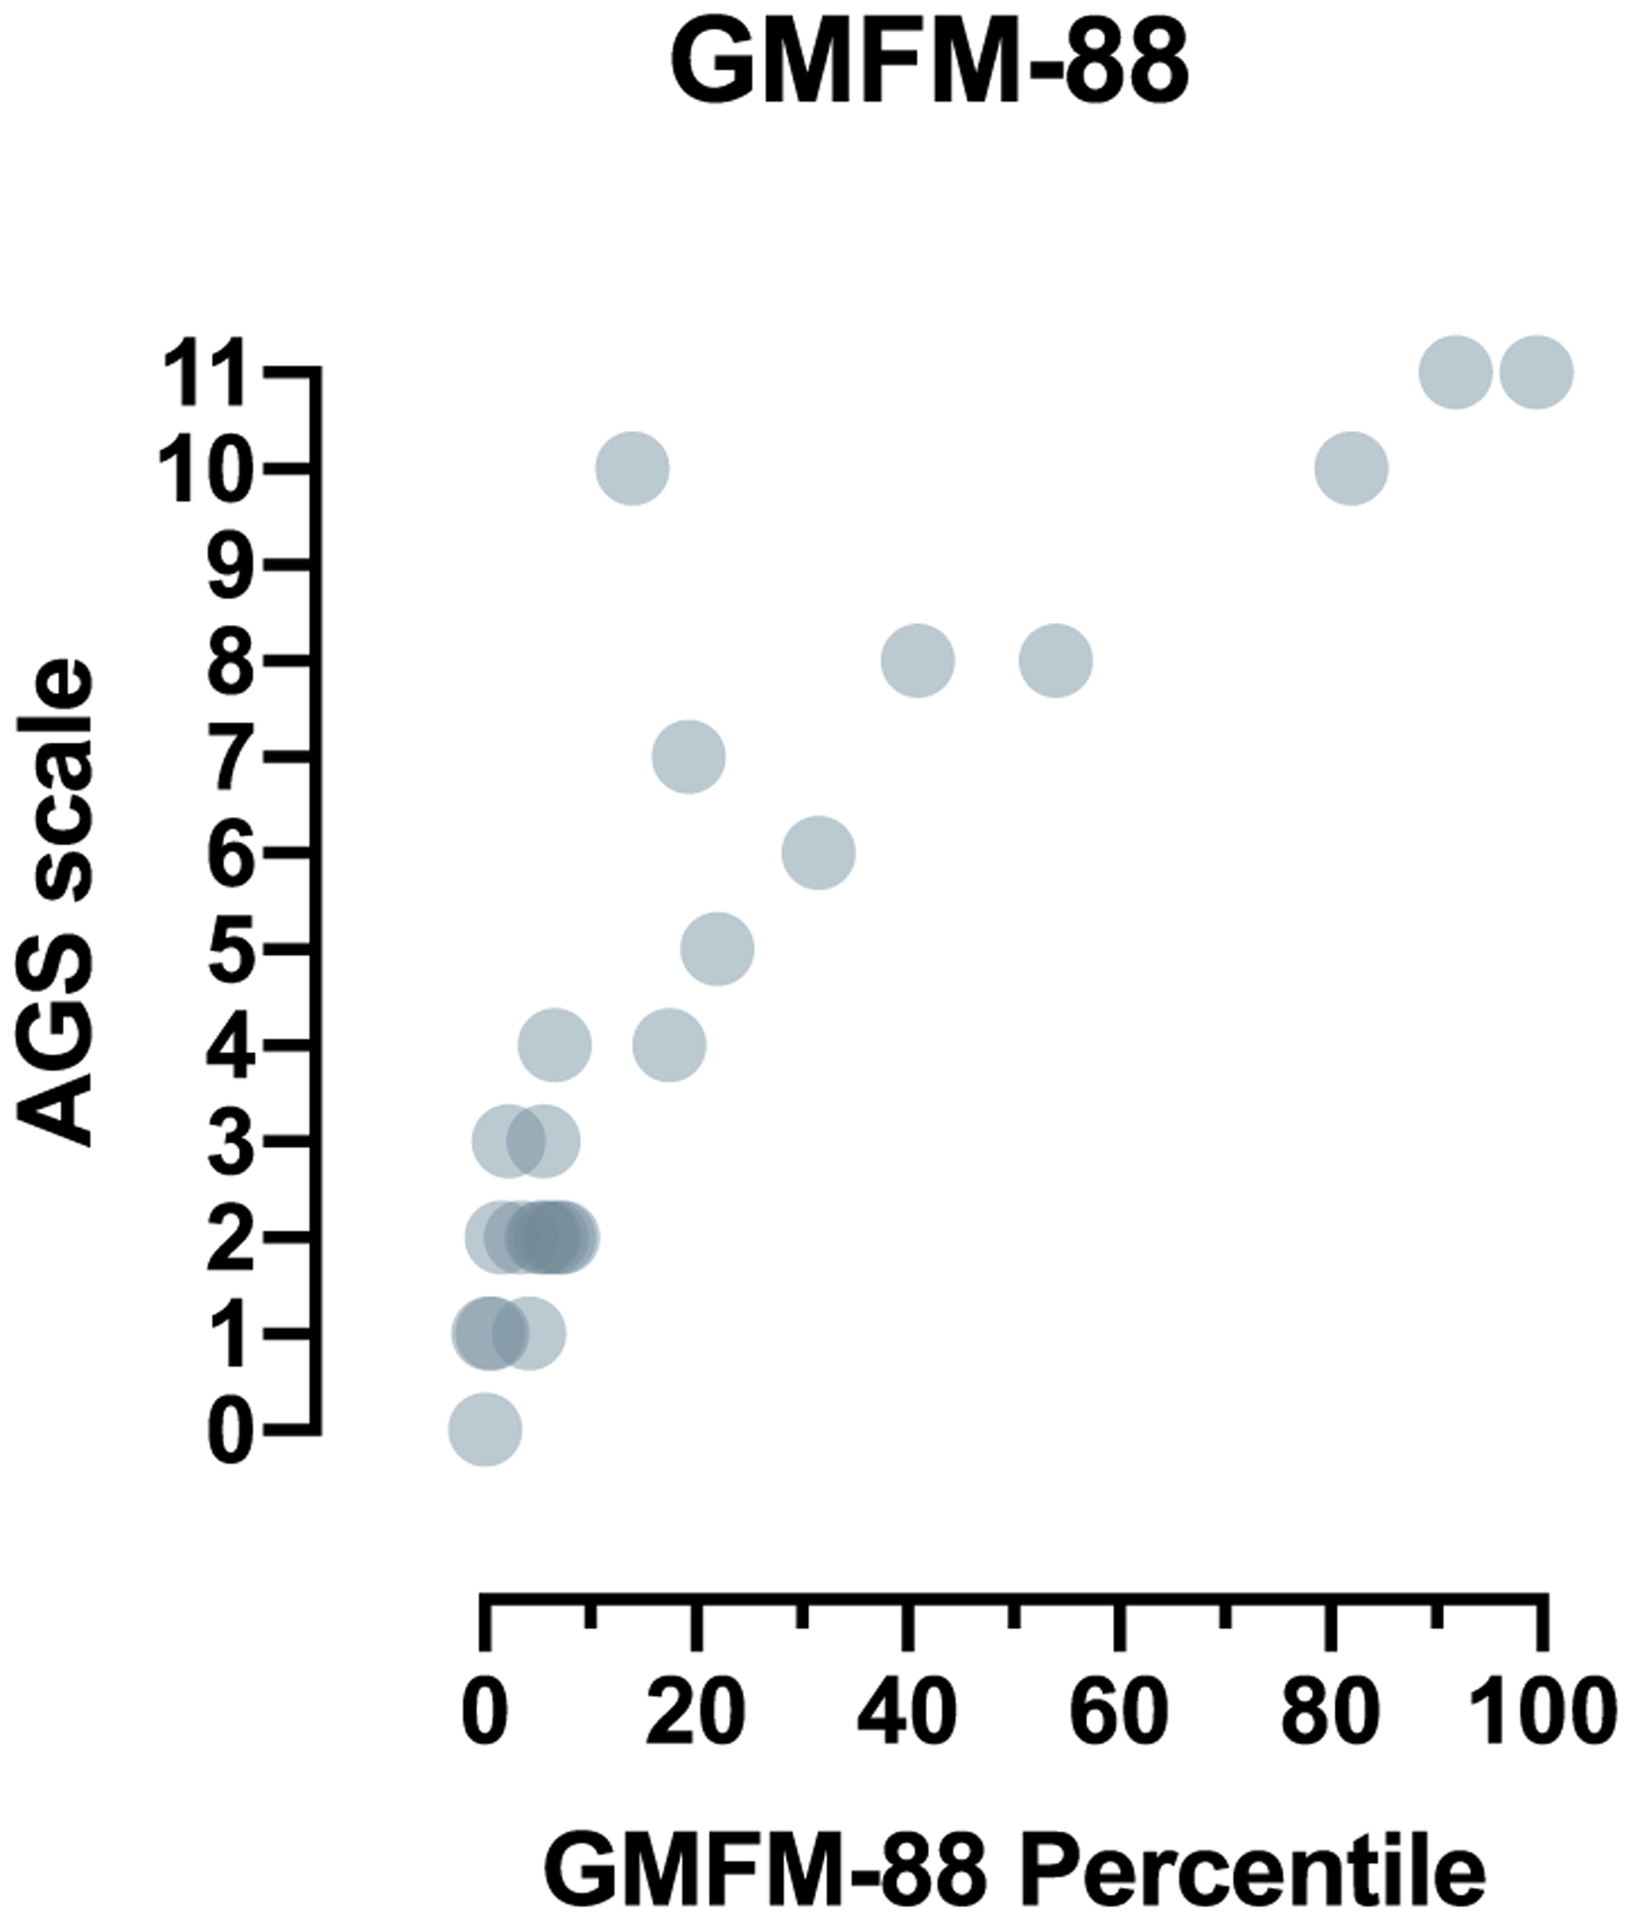
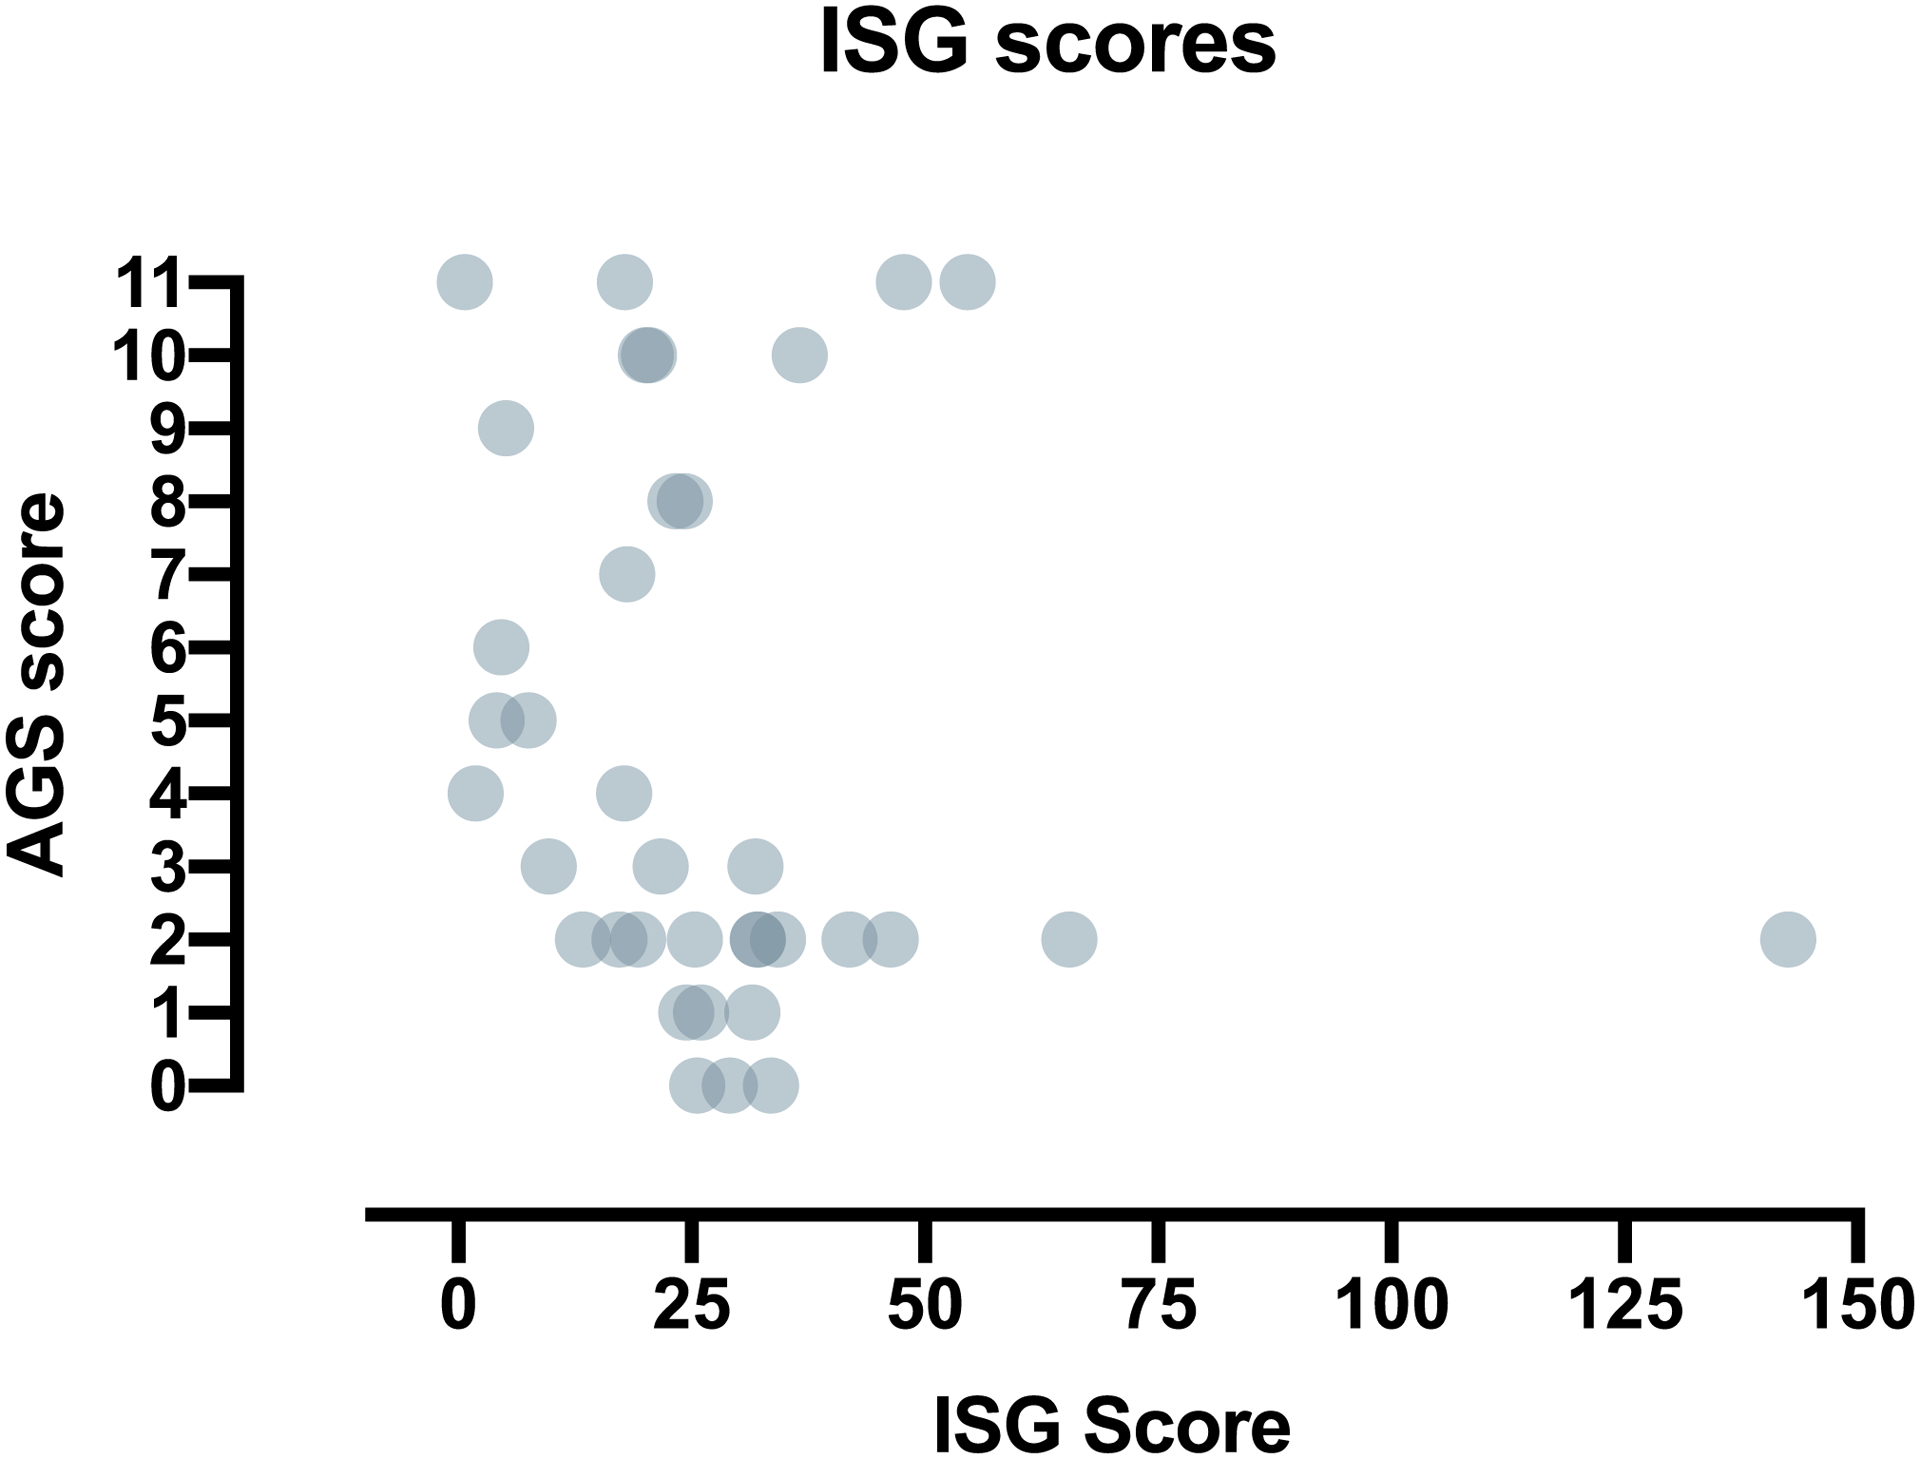
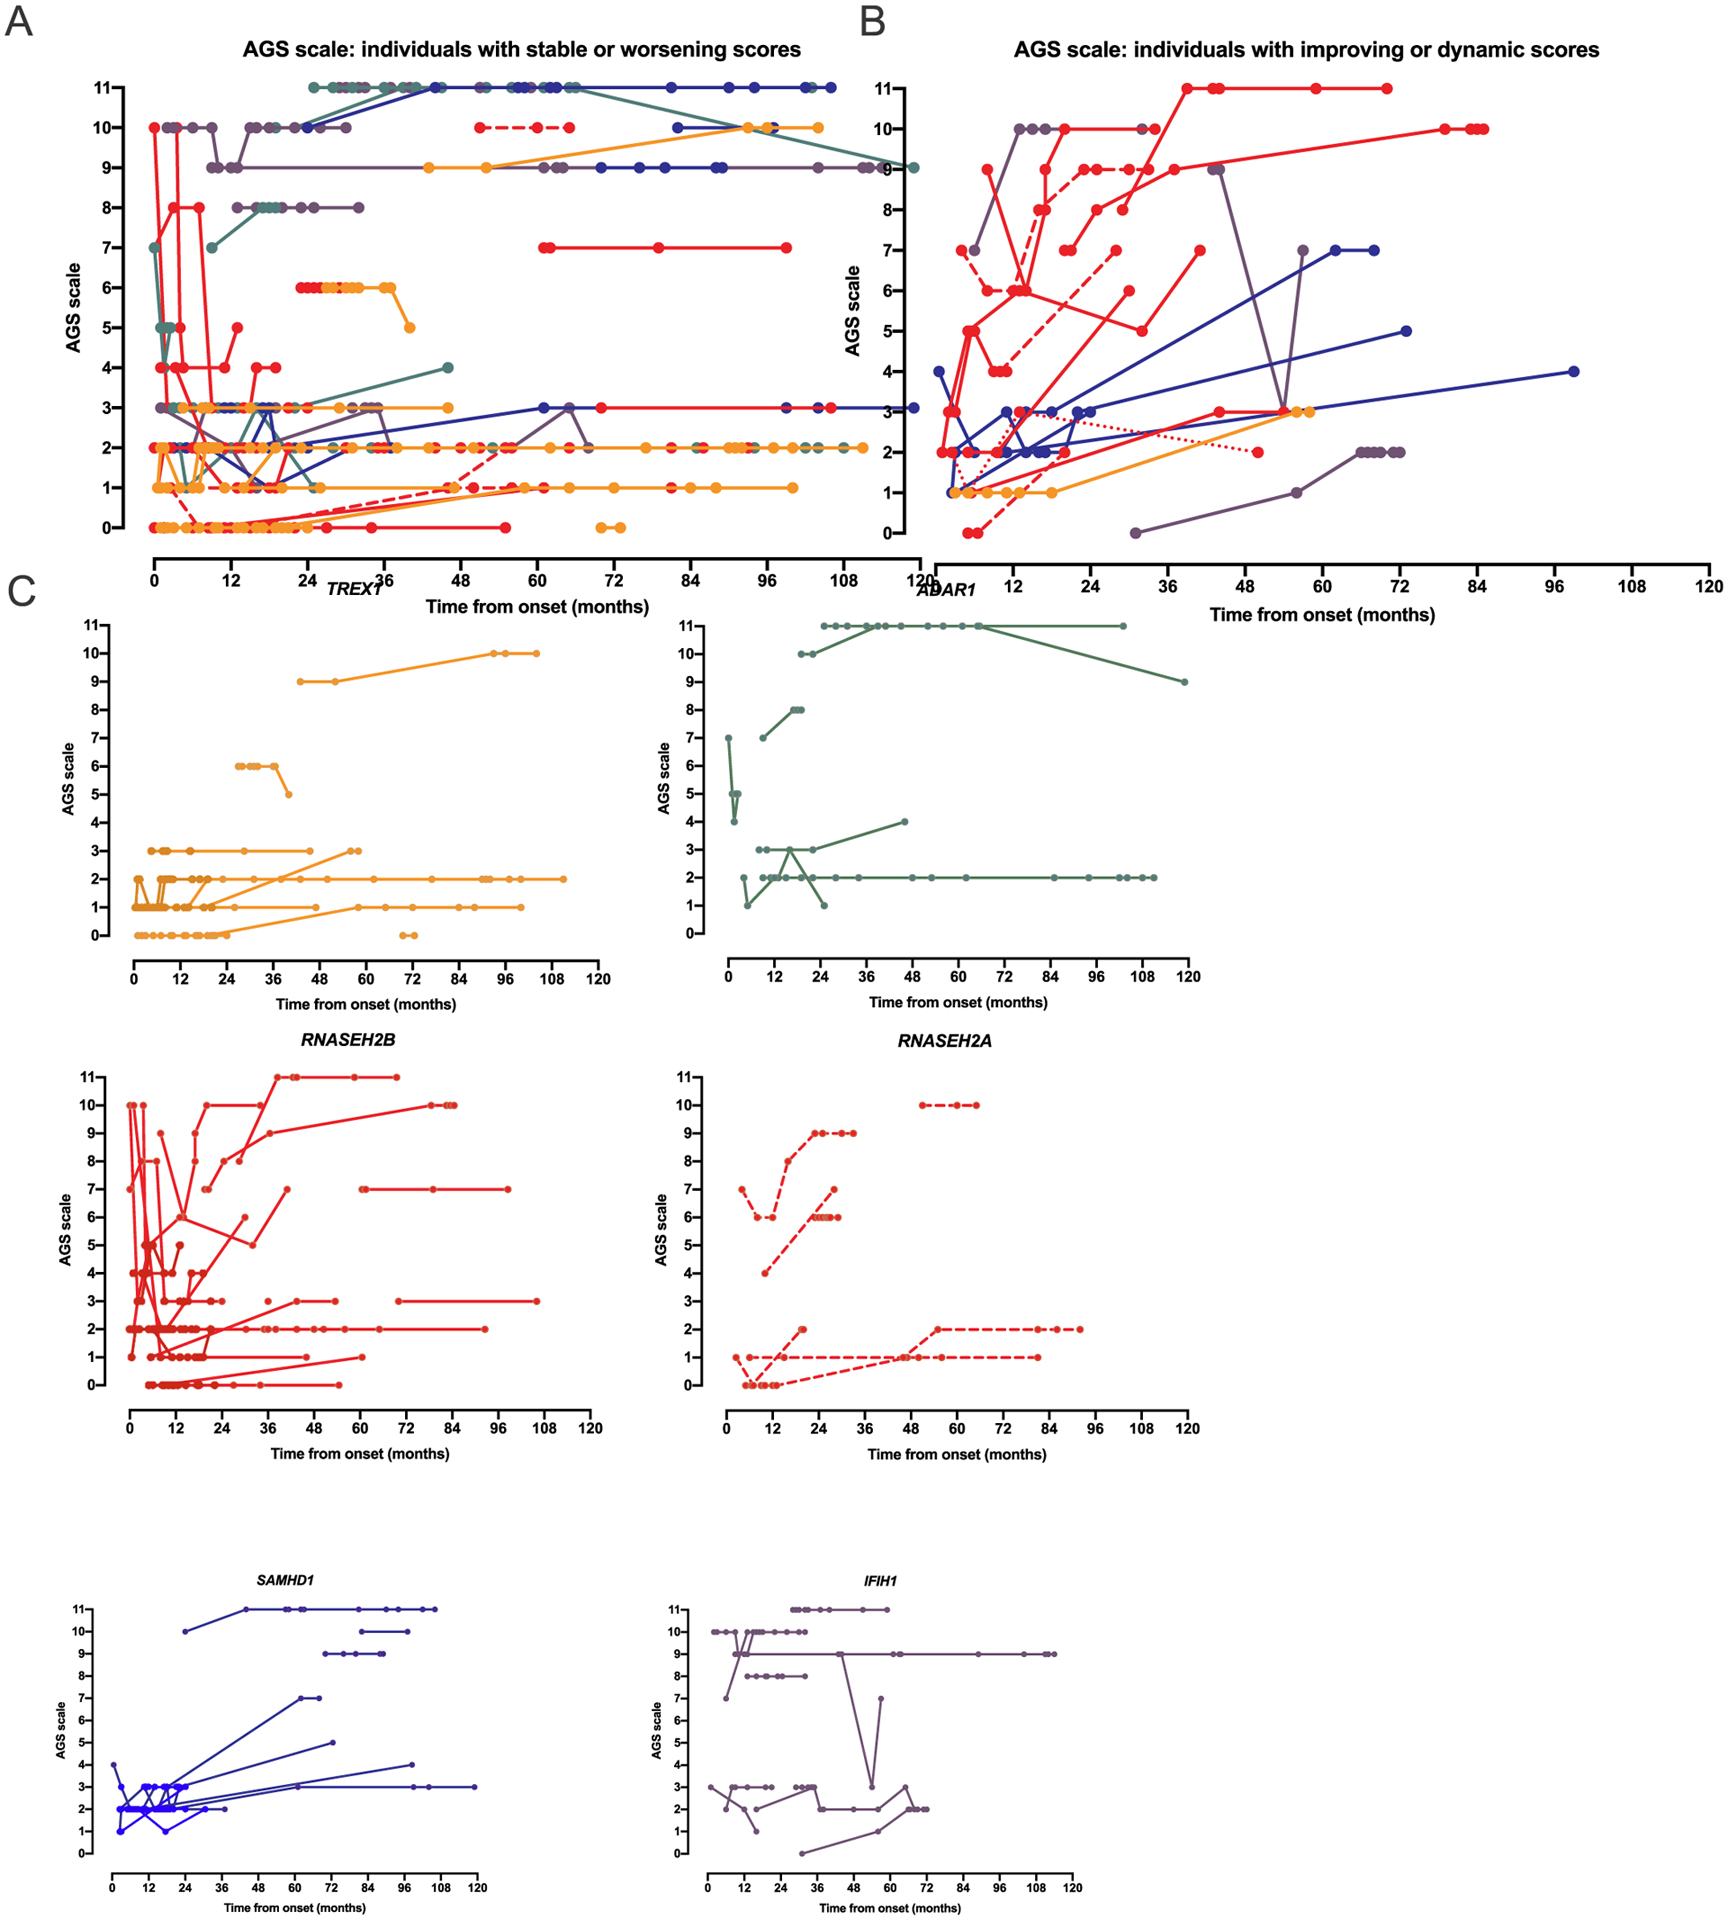
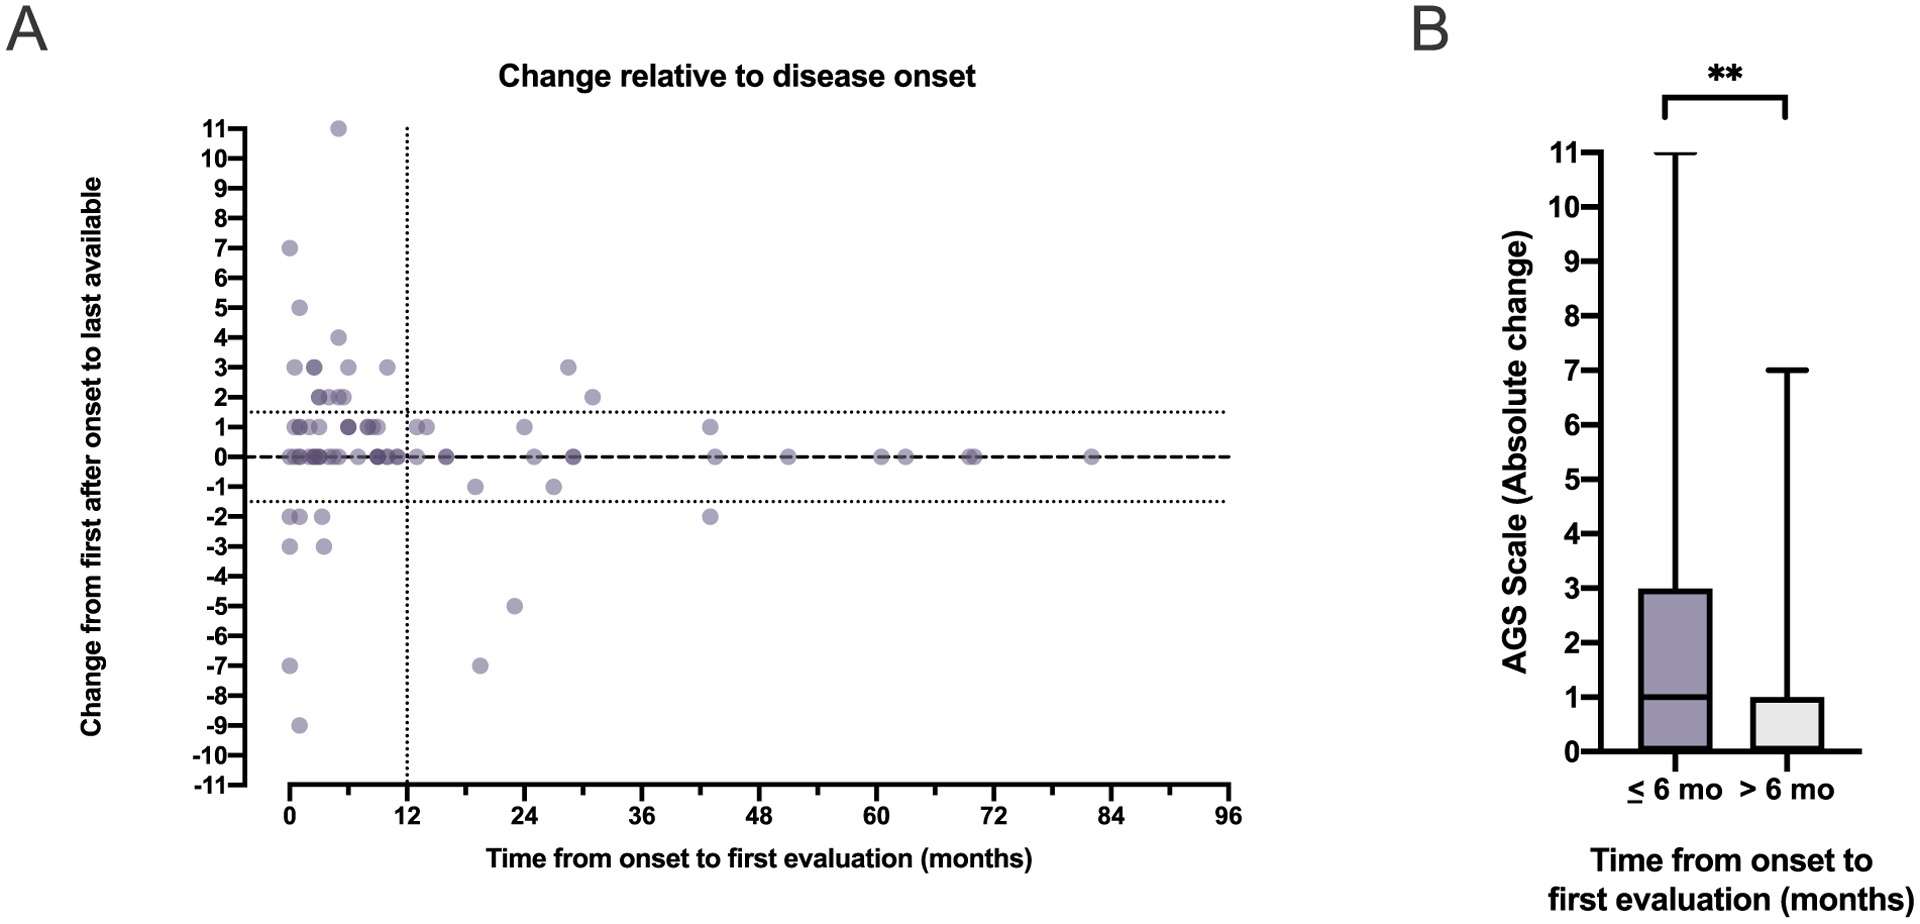
Results: The AGS scale score correlated with severity classifications and the composite neurologic function scores. When retrospectively applied across our natural history study, the majority of individuals demonstrated an initial decline in function followed by stable scores. Within the first 6 months of disease, the AGS score was the most dynamic. The AGS scale correlated with performance by the GMFM-88, but did not correlate with ISG levels.

Conclusions: This study demonstrates the utility of the AGS scale as a multimodal tool for the assessment of neurologic function in AGS. The AGS scale correlates with clinical severity and with a more labor-intensive tool, GMFM-88. This study underscores the limitations of the ISG score as a marker of disease severity. With the AGS scale, we found that AGS neurologic severity is the most dynamic early in disease. This novel AGS scale is a promising tool to longitudinally follow neurologic function in this unique population.

Keywords: Genetic; Interferonopathy; Leukodystrophy; Neurodegenerative; Outcome measure.


Figures

Fig. 1.
Fig. 1.
AGS Scale. © 2020, The Children’s Hospital of Philadelphia. All Rights Reserved.
Fig. 2.
Fig. 2.
Neurologic severity in AGS. (A) Three classification scales (GMFCS, MACS, and CFCS) were applied to the most recent available clinical encounter retrospectively in 61 children with molecularly confirmed AGS and are presented as reverse composite (rComposite) scores. Individuals are clustered by severity classifications. Higher rComposite scores indicate less impairment. (B) Clinical severity was assigned to each clinical encounter as mild-moderate-severe. The rComposite scores were compared across the severity classifications: mild (n = 10, mean 14.00 ± 1.63 standard deviation [SD], range 11–15), moderate (n = 21, mean 7.91 ± 1.95 SD, range 4–11), and severe (n = 30, mean 3.10 ± 0.40 SD, range 3–5) categories (Kruskal-Wallis test p value < .0001 for all comparisons).
Fig. 3.
Fig. 3.
AGS Scale scores correlate with neurologic severity. (A) The AGS scale was compared to disease severity using the rComposite scores (Spearman r 0.9273, 95% confidence interval 0.8795–0.9565, 2 tailed p value < .0001). Overlapping values are indicated by increasing color density. (B) The AGS score was compared to clinical severity assessments: mild (n = 11, mean 10.55 ± 0.52 standard deviation [SD], range 10–11), moderate (n = 23, mean 7.13 ± 1.89 SD, range 4–10), and severe (n = 31, mean 2.00 ± 1.16 SD, range 0–4) (Kruskal-Wallis test p value < .0001 for all comparisons).
Fig. 4.
Fig. 4.
Comparison of the AGS Scale to genotype. The nadir AGS Scale was compared across genotypes (n = 90; mean with SD bars; Kruskal-Wall test: TREX1 vs SAMHD1 p value 0.0053; TREX1 vs ADAR1 p value 0.0022; TREX1 vs IFIH1 p value 0.0032).
Fig. 5.
Fig. 5.
The correlation of the AGS scale to a standardized tool for gross motor function, GMFM-88. Formal testing of gross motor function was available in a subset of individuals (n = 24). The GMFM-88 overall percentile was compared to retrospective assignment of the AGS scale (Spearman r 0.8931, 95% confidence interval 0.76–0.95, 2-tailed p value < .0001).
Fig. 6.
Fig. 6.
Correlation of the AGS scale to a potential AGS biomarker. The AGS Scale was retrospectively applied to clinical encounters at which ISG measurements were obtained (n = 36). There was no correlation between ISG score and performance by the AGS scale.
Fig. 7.
Fig. 7.
The AGS scale captures longitudinal change in individuals affected by AGS. All plots represent time from disease onset (n = 92). A. The majority of individuals across all genotypes had stable or worsening AGS scale scores (n = 66). B. A subset of individuals had improvement in their AGS scale score (≥ 2 points increase from baseline at any time point) or were dynamic (both increasing and decreasing by ≥2 points). C. Genotype specific plots are provided for the 6 genotypes with more than 2 individuals.
Fig. 8.
Fig. 8.
AGS scale change correlates with proximity to disease onset. (A) The change in AGS scale between the first and last evaluations was compared to the duration between symptom onset and first evaluation in the 80 individuals for whom 2 evaluations within the first 10 years of disease were available. (B) Dynamic AGS scores (absolute change between the first and last evaluation) were more likely when the first evaluation occurred within the first 6 months of disease (Mann Whitney, two-tailed p = .0057).

References

    1. Adang L, Gavazzi F, De Simone M, Fazzi E, Galli J, Koh J, et al., Developmental outcomes of Aicardi Goutières Syndrome, J. Child Neurol 35 (1) (2020. January) 7–16, 10.1177/0883073819870944 [Epub 2019 Sep 27]. - DOI - PMC - PubMed
    1. Adang LA, Frank DB, Gilani A, Takanohashi A, Ulrick N, Collins A, et al., Aicardi goutieres syndrome is associated with pulmonary hypertension, Mol. Genet. Metab (2018), 10.1016/j.ymgme.2018.09.004. - DOI - PMC - PubMed
    1. Alotaibi M, Long T, Kennedy E, Bavishi S, The efficacy of GMFM-88 and GMFM-66 to detect changes in gross motor function in children with cerebral palsy (CP): a literature review, Disabil. Rehabil 36 (8) (2014) 617–627, 10.3109/09638288.2013.805820. - DOI - PubMed
    1. Armangue T, Orsini JJ, Takanohashi A, Gavazzi F, Conant A, Ulrick N, et al., Neonatal detection of Aicardi Goutieres Syndrome by increased C26:0 lysopho-sphatidylcholine and interferon signature on newborn screening blood spots, Mol. Genet. Metab (2017), 10.1016/j.ymgme.2017.07.006. - DOI - PMC - PubMed
    1. Augustine EF, Adams HR, Mink JW, Clinical trials in rare disease: challenges and opportunities, J. Child Neurol 28 (9) (2013) 1142–1150, 10.1177/0883073813495959. - DOI - PMC - PubMed

Publication types

MeSH terms

Supplementary concepts