. 2018:252:269-282.
doi: 10.1016/j.agrformet.2018.01.011.

Warmer temperatures reduce net carbon uptake, but do not affect water use, in a mature southern Appalachian forest

Affiliations

Warmer temperatures reduce net carbon uptake, but do not affect water use, in a mature southern Appalachian forest

A ChristopherOishi et al. Agric For Meteorol. 2018.

Abstract

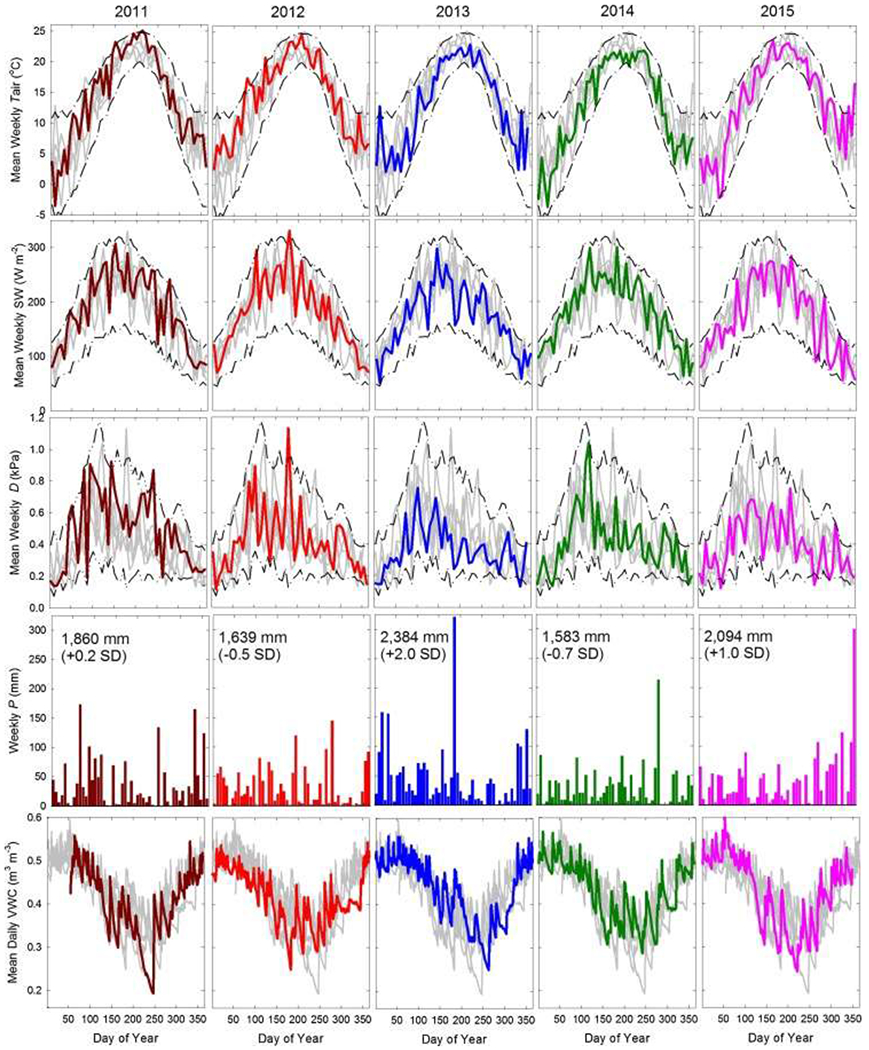
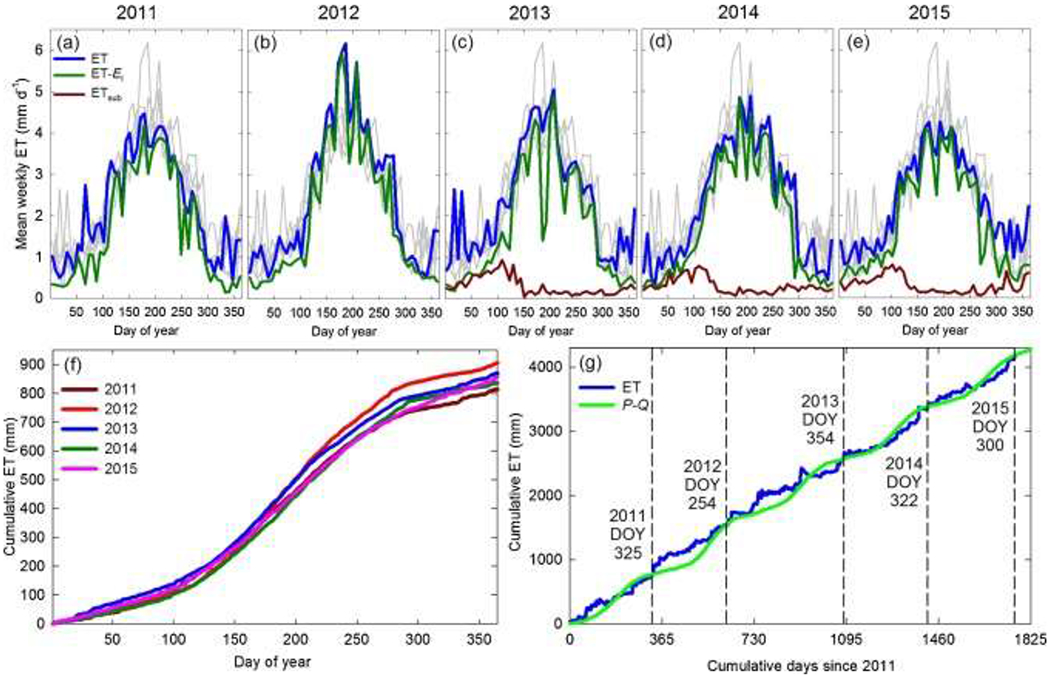
Increasing air temperature is expected to extend growing season length in temperate, broadleaf forests, leading to potential increases in evapotranspiration and net carbon uptake. However, other key processes affecting water and carbon cycles are also highly temperature-dependent. Warmer temperatures may result in higher ecosystem carbon loss through respiration and higher potential evapotranspiration through increased atmospheric demand for water. Thus, the net effects of a warming planet are uncertain and highly dependent on local climate and vegetation. We analyzed five years of data from the Coweeta eddy covariance tower in the southern Appalachian Mountains of western North Carolina, USA, a highly productive region that has historically been underrepresented in flux observation networks. We examined how leaf phenology and climate affect water and carbon cycling in a mature forest in one of the wettest biomes in North America. Warm temperatures in early 2012 caused leaf-out to occur two weeks earlier than in cooler years and led to higher seasonal carbon uptake. However, these warmer temperatures also drove higher winter ecosystem respiration, offsetting much of the springtime carbon gain. Interannual variability in net carbon uptake was high (147 to 364 g C m-2 y-1), but unrelated to growing season length. Instead, years with warmer growing seasons had 10% higher respiration and sequestered ~40% less carbon than cooler years. In contrast, annual evapotranspiration was relatively consistent among years (coefficient of variation = 4%) despite large differences in precipitation (17%, range = 800 mm). Transpiration by the evergreen understory likely helped to compensate for phenologically-driven differences in canopy transpiration. The increasing frequency of high summer temperatures is expected to have a greater effect on respiration than growing season length, reducing forest carbon storage.

Keywords: Complex terrain; Drought; Ecosystem respiration; Gross primary productivity; Net ecosystem exchange; Net ecosystem productivity.


Figures

Fig. 1.
Fig. 1.
Mean weekly air temperature (Tair), downwelling shortwave radiation (SW), vapor pressure deficit (D) (data represent weekly averages of daily means), total weekly precipitation (P), and daily volumetric soil water content (VWC). Colored lines represent individual years of the current study, gray lines represent data from the other four years of this study (not included for P), dashed lines represent +/−2 standard deviations from the long-term mean (1936–2015). Text associated with P indicates total annual P and number of standard deviations (SD) away from long-term mean (1,800 mm, SD = 298 mm).
Fig. 2.
Fig. 2.
Seasonal time series of estimated (a) spring and (b) fall canopy leaf area index (L). Dashed horizontal lines represent 25%, 50%, and 75% of maximum canopy leaf area (L25, L50, and L75, respectively). Inset in (a) shows relationship between date of year (DOY) of spring L50 and cumulative heating degree days >0 °C (HDD0) between day of year 17–83 (y = −0.0619x + 146.0; r2 = 0.99; p < 0.0001) and (b) shows relationship between DOY of fall L50 and cooling degree days <20 °C (CDD20) between day of year 210–290 (y = 0.1754x = 326.7; r2 = 0.91; p < 0.01).
Fig. 3.
Fig. 3.
Time series of (a–e) mean weekly ecosystem evapotranspiration (ET; current year is blue line, other years are gray lines), ET minus evaporation from precipitation intercepted by the canopy (EI), and subcanopy ET (ETsub) presented as weekly means of daily totals; (f) cumulative ET; (g) total cumulative ET since 2011 and ET estimated as precipitation minus watershed outflow (PQ); vertical lines represent dates when cumulative ET and PQ estimates are equal, based on day of current year. (For interpretation of the references to colour in this figure legend, the reader is referred to the web version of this article).
Fig. 4.
Fig. 4.
Daily evapotranspiration (ET) minus evaporation from interception as a function of mean daily vapor pressure deficit (D). Open symbols represent days with volumetric soil water content <0.30 m3 m−3.
Fig. 5.
Fig. 5.
Carbon fluxes. (a–e) Time series of net ecosystem exchange of carbon (NEE; black lines), ecosystem respiration (RE; brown lines), gross ecosystem productivity (GEP = NEE – RE; green lines), and subcanopy NEE (NEEsub; pink lines) presented as weekly means of daily totals (gray lines show data from other years of study); (f) cumulative annual NEE; (g) cumulative annual GEP; (h) estimated potential maximum daily GEP. Negative values represent flux of carbon into the ecosystem, except in (g) where carbon uptake is in positive units. (For interpretation of the references to colour in this figure legend, the reader is referred to the web version of this article).
Fig. 6.
Fig. 6.
Components of ecosystem respiration. Daily mean air temperature (Tair) versus (a) net ecosystem exchange of carbon from the subcanopy eddy covariance system (NEEsub) and soil CO2 efflux (Fsoil) estimated from transect measurements, inset shows comparison of daily NEEsub and Fsoilwith 1:1 line; (b) nighttime NEE from the tower eddy covariance system and ecosystem respiration (RE) estimated as the sum of Fsoil and leaf respiration, inset shows comparison of nighttime NEE and RE with 1:1 line; (c) exponential fits to data for data in (a) and (b).
Fig. 7.
Fig. 7.
Temporal trends from long term data at Coweeta Hydrologic Laboratory. (a) heating degree days above 0 °C between day of year 17–83 (HDD0); slope of linear regression was a non-significant 0.53 HDD0 y−1(r2 = 0.01, p = 0.24); (b) cooling degree days below 20 °C between day of year 210–290 (CDD20), piecewise linear regression determined significant breakpoint at year 1987 (r2 = 0.19, p = 0.0008) with slopes −0.26 and 2.62 CDD20 y−1 before and after breakpoint, respectively (slope of linear regression 0.57 CDD20 y−1; r2 = 0.08, p = 0.007); (c) growing season length based on estimated dates of canopy leaf area above 50% of maximum (L50), slope of linear regression 0.10 days y−1 (r2 = 0.07, p = 0.016).
Fig. 8.
Fig. 8.
Temporal trends from long term data at Coweeta Hydrologic Laboratory. (a) mean annual air temperature (Tair), slope of regression 0.016 °C y−1 (r2 = 0.27, p < 0.0001); (b) number of days during the peak of the growing season (June–August) exceeding specified temperatures; (c) estimated long-term ecosystem respiration (RE), breakpoint of piecewise linear regression at year 1974 (r2 = 0.59, p < 0.0001).

References

    1. Baldocchi et al., 2017 Baldocchi D, Chu H, Reichstein M Inter-annual variability of net and gross ecosystem carbon fluxes: a review Agric. For. Meteorol, 249 (2017), pp. 520–533, 10.1016/j.agrformet.2017.05.015 - DOI
    1. Ballantyne et al., 2017 Ballantyne A, Smith W, Andregg W, Kauppi P, Sarmiento J, Tans P, Shevliakova E, Pan Y, Poulter B, Anav A, Friedlingstein P, Houghton R, Running S Accelerating net terrestrial carbon uptake during the warming hiatus due to reduced respiration Nat. Clim. Change, 7 (2017), pp. 148–152
    1. Bolstad et al., 1999 Bolstad PV, Mitchell K, Vose JM Foliar temperature-respiration response functions for broad-leaved tree species in the southern Appalachians Tree Physiol, 19 (1999), pp. 871–878 - PubMed
    1. Brzostek et al., 2014 Brzostek ER, Dragoni D, Schmid HP, Rahman AF, Sims D, Wayson CA, Johnson DJ, Phillips RP Chronic water stress reduces tree growth and the carbon sink of deciduous hardwood forests Global Change Biol, 20 (2014), pp. 2531–2539, 10.1111/gcb.12528 - DOI - PubMed
    1. Burt et al., 2017 Burt T, Miniat CF, Laseter SH, Swank WT Changing patterns of daily precipitation totals at the Coweeta Hydrologic Laboratory, North Carolina, USA Int. J. Climatol, 38 (2017), pp. 94–104, 10.1002/joc.S163 - DOI

LinkOut - more resources