Comparative Study
. 2020 Jun 1;318(6):F1341-F1356.
doi: 10.1152/ajprenal.00527.2019. Epub 2020 Apr 13.

Effects of extreme potassium stress on blood pressure and renal tubular sodium transport

Affiliations
Comparative Study

Effects of extreme potassium stress on blood pressure and renal tubular sodium transport

Cary R Boyd-Shiwarski et al. Am J Physiol Renal Physiol. .

Abstract

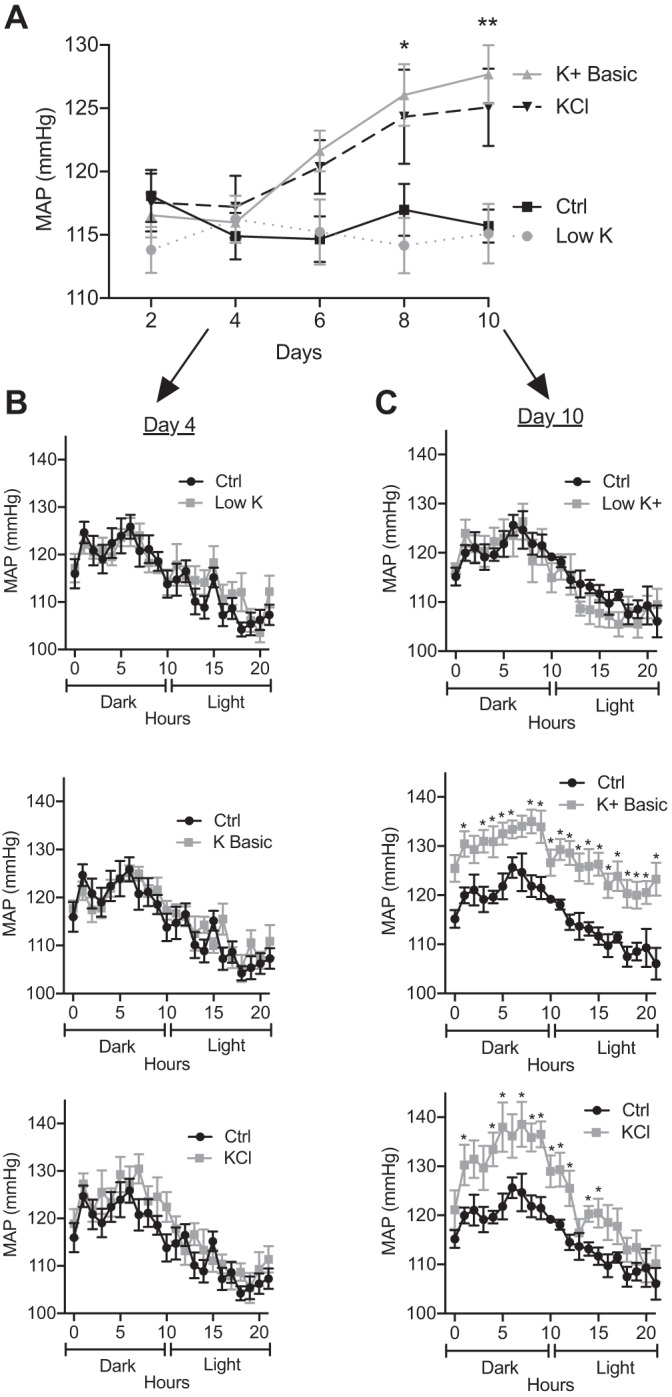
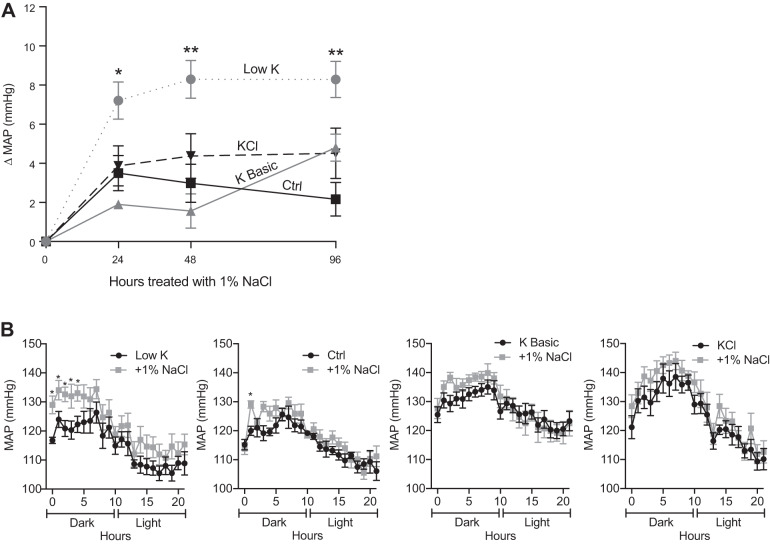
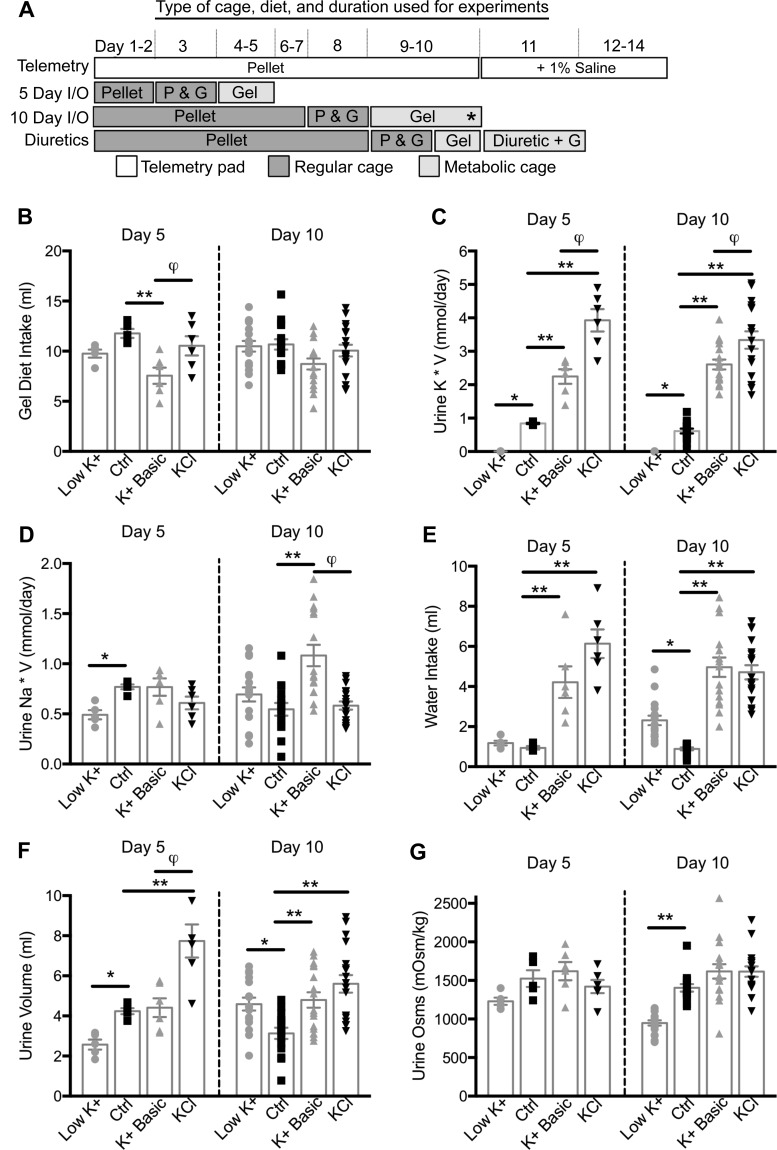
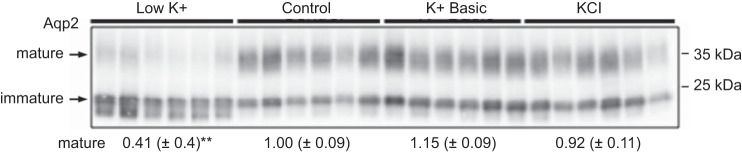
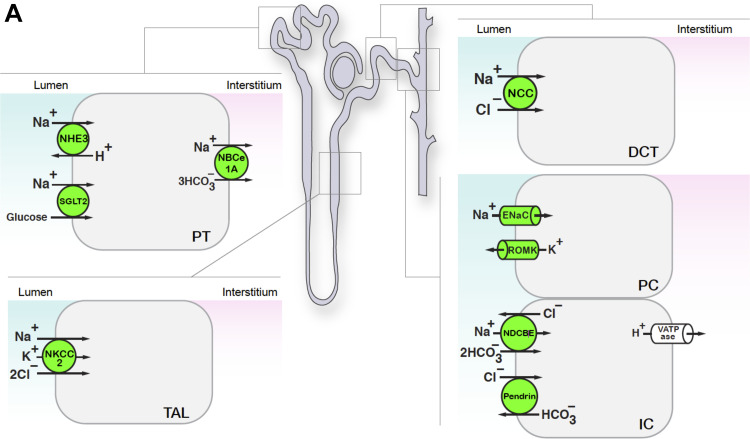
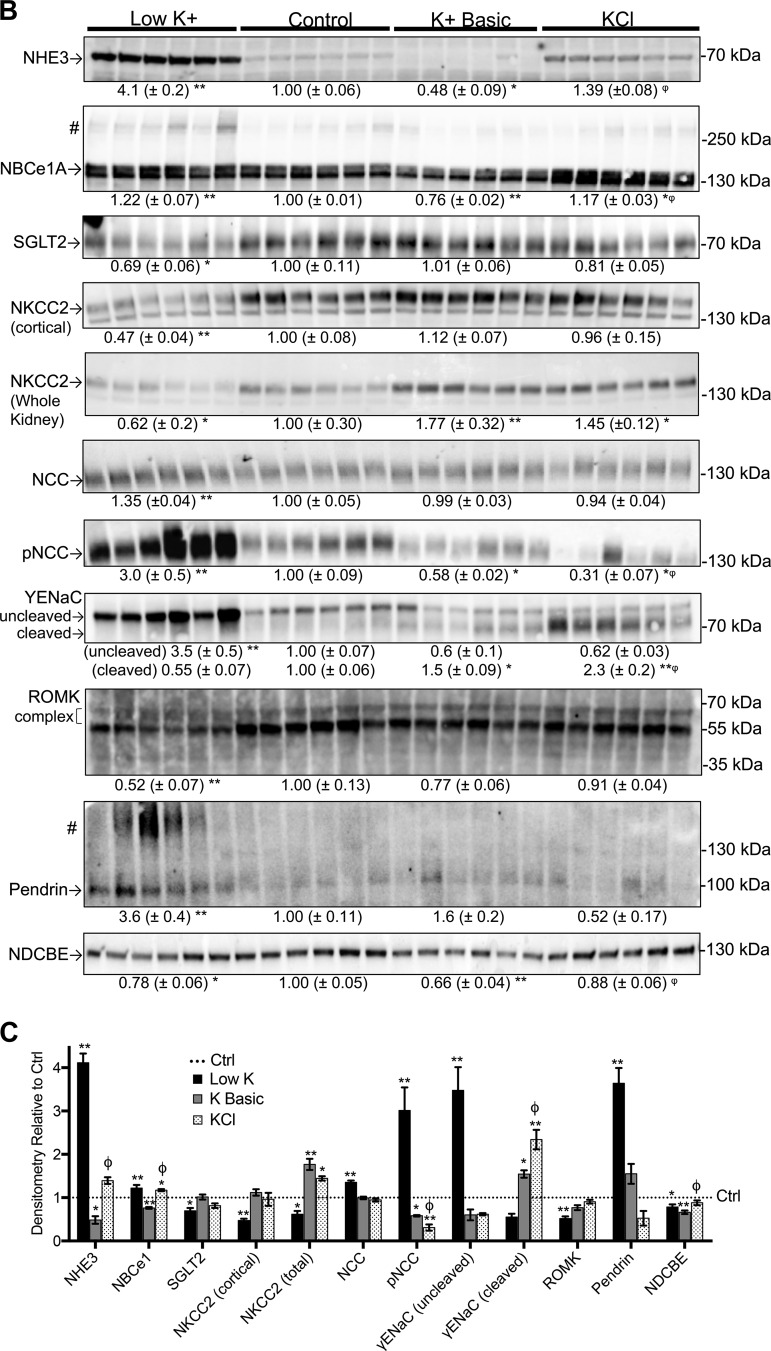
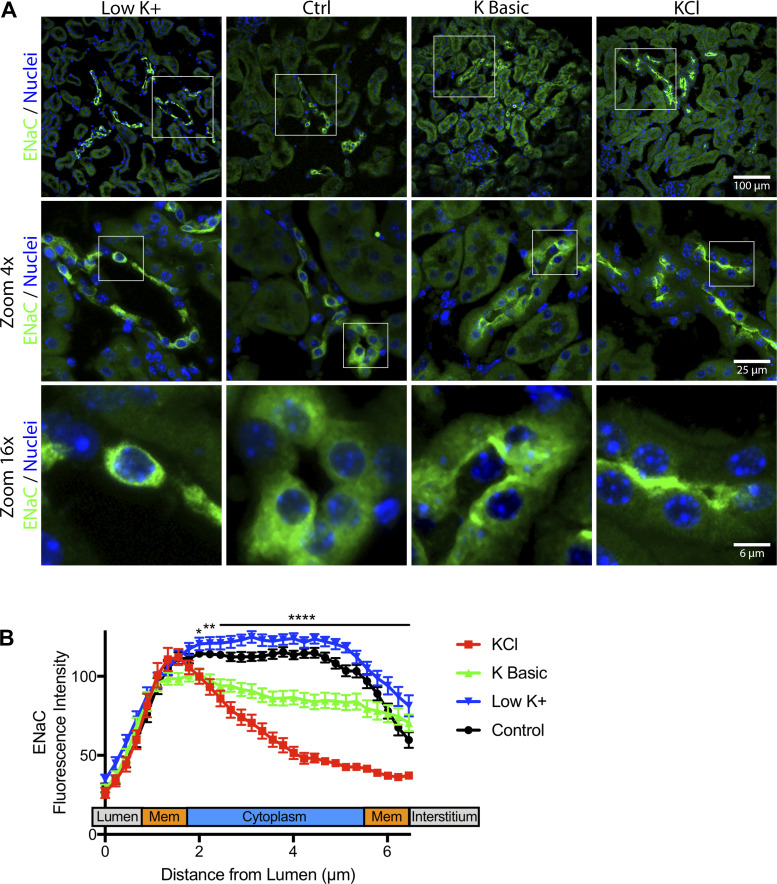
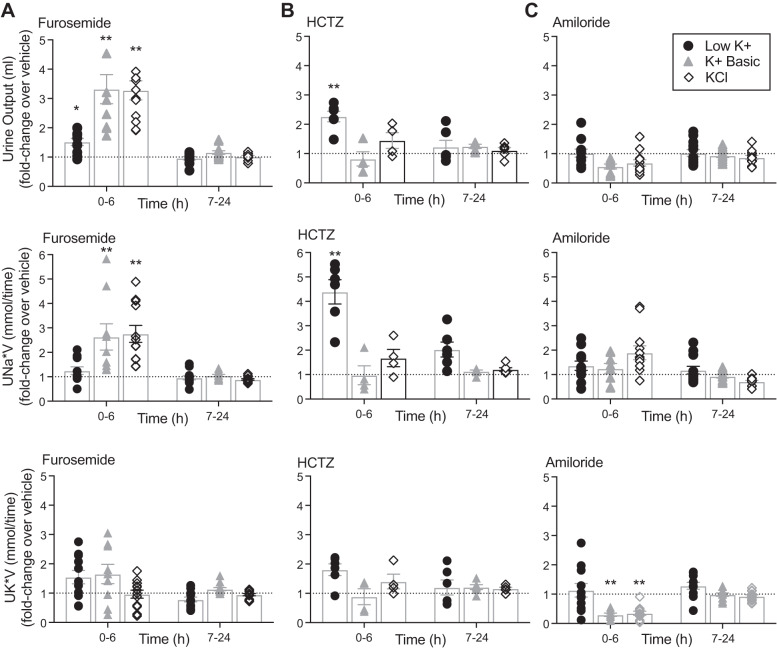
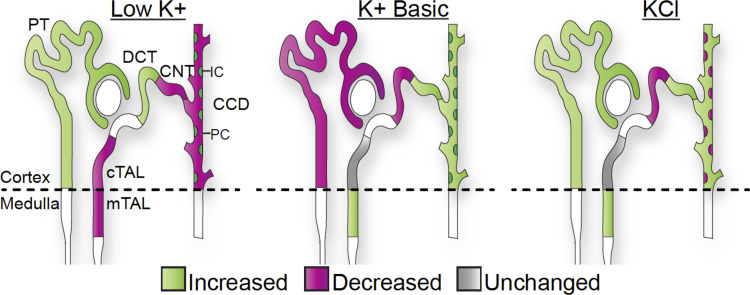
We characterized mouse blood pressure and ion transport in the setting of commonly used rodent diets that drive K+ intake to the extremes of deficiency and excess. Male 129S2/Sv mice were fed either K+-deficient, control, high-K+ basic, or high-KCl diets for 10 days. Mice maintained on a K+-deficient diet exhibited no change in blood pressure, whereas K+-loaded mice developed an ~10-mmHg blood pressure increase. Following challenge with NaCl, K+-deficient mice developed a salt-sensitive 8 mmHg increase in blood pressure, whereas blood pressure was unchanged in mice fed high-K+ diets. Notably, 10 days of K+ depletion induced diabetes insipidus and upregulation of phosphorylated NaCl cotransporter, proximal Na+ transporters, and pendrin, likely contributing to the K+-deficient NaCl sensitivity. While the anionic content with high-K+ diets had distinct effects on transporter expression along the nephron, both K+ basic and KCl diets had a similar increase in blood pressure. The blood pressure elevation on high-K+ diets correlated with increased Na+-K+-2Cl- cotransporter and γ-epithelial Na+ channel expression and increased urinary response to furosemide and amiloride. We conclude that the dietary K+ maneuvers used here did not recapitulate the inverse effects of K+ on blood pressure observed in human epidemiological studies. This may be due to the extreme degree of K+ stress, the low-Na+-to-K+ ratio, the duration of treatment, and the development of other coinciding events, such as diabetes insipidus. These factors must be taken into consideration when studying the physiological effects of dietary K+ loading and depletion.

Keywords: blood pressure; kidney; potassium; sodium transport.


Conflict of interest statement

No conflicts of interest, financial or otherwise, are declared by the authors.

Figures

Fig. 1.
Fig. 1.
Mean arterial pressure (MAP) was significantly elevated in mice on high-K+ diets. Mice were treated with K+ control (Ctrl), low-K+, K+ basic, and KCl diets for 10 days. A: the time course of MAP (means ± SE) was significantly elevated within 8 days for mice on the K+ basic diet and within 10 days for the KCl diet compared with the control diet. The low-K+ diet had no effect on MAP (two-way ANOVA with Dunnett’s post hoc analysis, *P ≤ 0.05 and **P ≤ 0.01). n = 6 mice per diet. B: 4 days of varying dietary K+ had no effect on blood pressure. The graph shows the 22-h diurnal pattern of MAP (means ± SE) with varying K+ diets (multiple t tests). n = 6 mice per diet. C: 10 days of low-K+ diet had no effect on MAP, whereas 10 days of K+ basic diet significantly elevated blood pressure during both the dark/active and light/resting phases. The KCl diet significantly elevated MAP predominantly during the dark phase. The graph shows the 22-h diurnal pattern of MAP (means ± SE, multiple t tests, *P ≤ 0.05). n = 6 mice per diet.
Fig. 2.
Fig. 2.
Low-K+ diet induces salt sensitivity. A: mice were treated with various K+ diets as indicated for 10 days and then challenged with 1% NaCl (supplemented to drinking water) for 96 h. The graph shows the change in mean arterial pressure (MAP; means ± SE). Mice on the low-K+ diet developed a significant change in MAP compared with the control (Ctrl) diet, whereas mice fed high-K+ basic or KCl diets had no significant change compared with the control diet (two-way ANOVA with Dunnett’s post hoc analysis, *P ≤ 0.05 and **P ≤ 0.01). n = 6 mice per diet. B: graph of the 22-h diurnal pattern showing MAP after 10 days on K+ diets and after 24 h of saline challenge. Mice maintained on the low-K+ diet had a significant elevation in MAP during the dark/active phase in response to saline challenge; however, there was no significant elevation during the light/resting phase (multiple t tests, *P ≤ 0.05). n = 6 mice per diet.
Fig. 3.
Fig. 3.
Dietary K+ maneuvers induce polyuria. A: diagram indicating the type of cage and diet for each maneuver. Throughout the telemetry experiment, mice were maintained in telemetry cages and fed pellet diet (P) ad libitum. On days 11–14, their drinking water was switched from free water to 1% saline. For the 5- and 10-day urine and whole blood experiments, mice were maintained on the pellet diet. Then, 24 h before placement in metabolic cages, mice were introduced to the gel diet [access to both pellet and gel diets (P&G)] and next placed in metabolic cages exclusively on the gel diet (G) and acclimatized for 24 h, and urine was collected for 24 h. *Time point when mice were euthanized and whole blood was collected. For the diuretic experiments, mice were placed in the metabolic cages and on exclusive gel diets on day 10. B: mice were maintained on varying K+ diets, and 24-h intakes and outputs (I/O) were obtained on days 5 and 10. Mice maintained on the K+ basic diet had decreased consumption at day 5 compared with mice on the other diets, but by day 10 this difference was attenuated. C: 24-h urine trends were similar on both days 5 and 10. Urinary K+ (mmol/day) was appropriately decreased with the low-K+ diet. The KCl diet had more urinary K+ excretion than the K+ basic diet; both were appropriately increased compared with the control (Ctrl) diet. D: urinary Na+ (mmol/day) was significantly decreased on day 5 with the low-K+ diet compared with control diet-fed mice. On day 10 only the K+ basic diet significantly increased urine Na+ (mmol/day) compared with control. Mice maintained on K+ basic and KCl diets had significant differences in daily Na+ excretion. E: on day 5, mice fed the high-K+ diets had increased water intake compared with control; by day 10, mice fed the low-K+ diet also began to have increased water intake. F: on day 5, mice fed the low-K+ diet had a decrease in urine volume, whereas mice fed the KCl diet had an increase in urine volume. On day 10, urine volume was significantly increased by low-K+ and high-K+ diets compared with the control diet. G: on day 10, only the low-K+ diet significantly decreased urine osmolality (osms) compared with the control diet. Day 5: n = 5–6 mice per diet; day 10: n = 16–18 mice per diet. One-way ANOVA with Sidak’s post hoc analysis, *P ≤ 0.05 and **P ≤ 0.01, significant difference from the control diet and φsignificant difference between the K+ basic and KCl diets.
Fig. 4.
Fig. 4.
Dietary K+ depletion decreases aquaporin 2 (Aqp2) abundance. The Western blot of the mouse kidney cortex demonstrates a significant reduction in the mature form (35 kDa) of Aqp2 during the low-K+ diet (one-way ANOVA with Sidak’s post hoc analysis, **P ≤ 0.01). n = 6 mice per diet.
Fig. 5.
Fig. 5.
Dietary K+ maneuvers affect the abundance of transporters and channels along the nephron. Kidney lysates from mice subjected to various dietary K+ maneuvers for 10 days were assessed by Western blot analysis. Equivalent protein loading was determined by BCA Protein Assay and Coomassie staining. Results are shown as means ± SE; n = 6 mice per diet. One-way ANOVA with Sidak’s post hoc analysis, *P ≤ 0.05 and **P ≤ 0.01 compared with control; φsignificant difference between K+ basic and KCl diets. A: we probed for a variety of channels and transporters expressed from the proximal tubule to the collecting duct, as indicated. B: Western blots of kidney homogenates from mice subjected to various K+ diets. All samples were of the kidney cortex unless noted [Na+-K+-2Cl cotransporter (NKCC2) in the whole kidney]. #Multimerization of Na+-bicarbonate cotransporter 1A (NBCe1A) (39) and pendrin (62). C: graphical summary of the results. The dotted line depicts control values normalized to 1.0. DCT, distal convoluted tubule; γ-ENaC, γ-subunit of the epithelial Na+ channel; IC, intercalated cells; NCC, NaCl cotransporter; NHE3, Na+/H+ exchanger 3; ROMK, renal outer medullary K+ channel; NDCBE, Na+-driven Cl/bicarbonate exchanger; PC, principal cells; PCT, proximal convoluted tubule; SGLT2, Na+-glucose transporter 2; TAL, thick ascending limb.
Fig. 5.
Fig. 5.
Dietary K+ maneuvers affect the abundance of transporters and channels along the nephron. Kidney lysates from mice subjected to various dietary K+ maneuvers for 10 days were assessed by Western blot analysis. Equivalent protein loading was determined by BCA Protein Assay and Coomassie staining. Results are shown as means ± SE; n = 6 mice per diet. One-way ANOVA with Sidak’s post hoc analysis, *P ≤ 0.05 and **P ≤ 0.01 compared with control; φsignificant difference between K+ basic and KCl diets. A: we probed for a variety of channels and transporters expressed from the proximal tubule to the collecting duct, as indicated. B: Western blots of kidney homogenates from mice subjected to various K+ diets. All samples were of the kidney cortex unless noted [Na+-K+-2Cl cotransporter (NKCC2) in the whole kidney]. #Multimerization of Na+-bicarbonate cotransporter 1A (NBCe1A) (39) and pendrin (62). C: graphical summary of the results. The dotted line depicts control values normalized to 1.0. DCT, distal convoluted tubule; γ-ENaC, γ-subunit of the epithelial Na+ channel; IC, intercalated cells; NCC, NaCl cotransporter; NHE3, Na+/H+ exchanger 3; ROMK, renal outer medullary K+ channel; NDCBE, Na+-driven Cl/bicarbonate exchanger; PC, principal cells; PCT, proximal convoluted tubule; SGLT2, Na+-glucose transporter 2; TAL, thick ascending limb.
Fig. 6.
Fig. 6.
Dietary K+ maneuvers affect epithelial Na+ channel (ENaC) localization. Kidney tissue from mice maintained on varying K+ diets for 10 days was fixed and immunostained for γ-ENaC (green). A: dietary K+ loading shifted γ-ENaC localization from diffuse to apical staining, which was more prominent for the KCl diet than for the K+ basic diet. Three-dimensional z-stacks were acquired and maximum intensity projected to visualize apical versus diffuse ENaC localization. B: quantification of γ-ENaC localization was performed using a fluorescence intensity line profile plot from 30 representative cells over different 3 experiments. Results were averaged and plotted to compare the fluorescence intensity distribution between groups. All statistics and analysis were performed using two-way ANOVA with Dunnett’s post hoc analysis to evaluate for significant changes between varying K+ diets and the control (Ctrl) diet. KCl- and K+ basic diet-fed mice displayed significantly different γ-ENaC distributions compared with control mice (P ≤ 0.0001), while low-K+ fed mice had a similar distribution to control. Specifically, KCl-fed mice exhibited γ-ENaC localization preference for the luminal membrane and decreased γ-ENaC within the cytoplasmic region. Compared with control mice, KCl diet-fed mice had γ-ENaC distribution that was significantly different from 2.0–6.4 µm from the lumen (*P ≤ 0.05, **P ≤ 0.01, and ****P ≤ 0.0001). K+ basic diet-fed mice displayed a slightly reduced cytoplasmic γ-ENaC distribution that was significantly different from control mice between 2.2–6.4 µm from the lumen. Low-K+ diet-fed mice had a similar γ-ENaC distribution compared with control mice, with a few significant points from 5.1–6.4 µm from the lumen.
Fig. 7.
Fig. 7.
Dietary K+ influences diuretic sensitivity. Mice were maintained on either low-K+, K+ basic, or KCl diets for 10 days. Mice were placed in metabolic cages 24 h before diuretic challenge. Mice were intraperitoneally injected with the diuretic furosemide (30 mg/kg), hydrochlorothiazide (HCTZ; 25 mg/kg), or amiloride (5 mg/kg), and urine was collected from 0–6 h and 7–24 h. Values are shown as fold changes in urine output after diuretic compared with sham saline injection given to the same mouse on a different day (two-way ANOVA with Sidak’s post hoc analysis, *P ≤ 0.05 and **P ≤ 0.01 compared with sham). A: mice fed a high-K+ diet exhibited increased sensitivity to furosemide compared with mice on the low-K+ diet with increased urine output and increased 6 h urinary Na+ excretion (UNa*V). Dietary K+ had no significant effect on urine K+ excretion (UK*V) in response to furosemide. n = 9–12 mice per diet. B: K+-restricted mice were more sensitive to HCTZ, with significantly increased urine output and 6-h urinary Na+. n = 4–6 mice per diet. C: mice fed a high-K+ diet had increased sensitivity to the K+-sparing effect of amiloride with a decrease in kaliuresis when treated with amiloride. n = 10–12 mice per diet.
Fig. 8.
Fig. 8.
Summary of the effects of extreme dietary K+ maneuvers on Na+ transport. The effect of dietary K+ depletion and loading are summarized based on transporter abundance and activity obtained from immunoblot and diuretic experiments. Extreme K+ depletion had a significant effect on all Na+ transporters and channels studied due to the combined effects of volume loss and K+ deficiency. K+ loading had similar stimulatory effects on Na+-K+-2Cl cotransporter (NKCC2) and epithelial Na+ channel (ENaC) and inhibitory effects on NaCl cotransporter (NCC). The K+ anion (basic vs. Cl) had opposing effects in the proximal tubule and intercalated cells. CCD, cortical collecting duct; CNT, connecting tubule; cTAL, cortical thick ascending limb; DCT, distal convoluted tubule; IC, intercalated cells; mTAL, medullary thick ascending limb; PC, principal cells; PT, proximal tubule.

References

    1. Abbrecht PH. Cardiovascular effects of chronic potassium deficiency in the dog. Am J Physiol 223: 555–560, 1972. doi:10.1152/ajplegacy.1972.223.3.555. - DOI - PubMed
    1. Amlal H, Wang Z, Soleimani M. Potassium depletion downregulates chloride-absorbing transporters in rat kidney. J Clin Invest 101: 1045–1054, 1998. doi:10.1172/JCI686. - DOI - PMC - PubMed
    1. Anderson DE, Kearns WD, Worden TJ. Potassium infusion attenuates avoidance-saline hypertension in dogs. Hypertension 5: 415–420, 1983. doi:10.1161/01.HYP.5.4.415. - DOI - PubMed
    1. Bernabe-Ortiz A, Sal Y Rosas VG, Ponce-Lucero V, Cárdenas MK, Carrillo-Larco RM, Diez-Canseco F, Pesantes MA, Sacksteder KA, Gilman RH, Miranda JJ. Effect of salt substitution on community-wide blood pressure and hypertension incidence. Nat Med 26: 374–378, 2020. doi:10.1038/s41591-020-0754-2. - DOI - PMC - PubMed
    1. Blass G, Klemens CA, Brands MW, Palygin O, Staruschenko A. Postprandial effects on ENaC-mediated sodium absorption. Sci Rep 9: 4296, 2019. doi:10.1038/s41598-019-40639-x. - DOI - PMC - PubMed

Publication types

MeSH terms