. 2021 Jul;15(4):865-873.
doi: 10.1177/1932296820913874. Epub 2020 Apr 13.

Quality Assurance of Commercial Insulin Formulations: Novel Assay Using Infrared Spectroscopy

Affiliations

Quality Assurance of Commercial Insulin Formulations: Novel Assay Using Infrared Spectroscopy

Sven Delbeck et al. J Diabetes Sci Technol. 2021 Jul.

Abstract

Background: For insulins in commercial formulations, degradation can be observed within the certified shelf life when not stored at recommended conditions. Elevated temperatures and exposure to shear forces can cause changes in the secondary structure of the hormone, leading to a decrease in pharmaceutical potency. International pharmacopoeia recommendations for insulin quality monitoring assays mainly rely on liquid chromatography methods. These methods are unable to distinguish between active and inactive forms, both of which may exist in pharmaceutical insulins exposed to stress conditions.

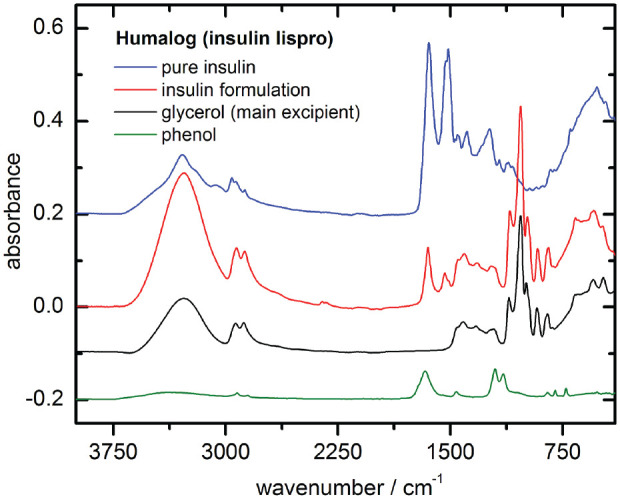
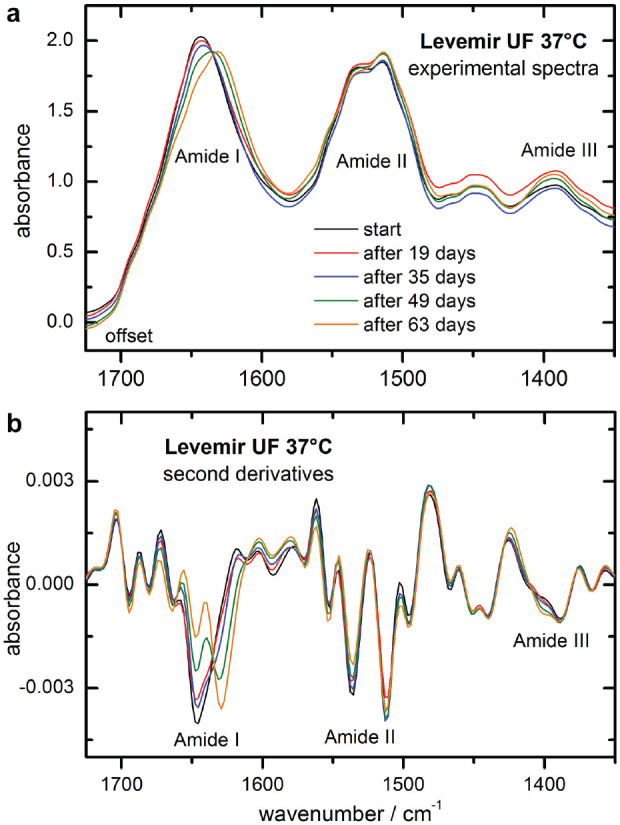
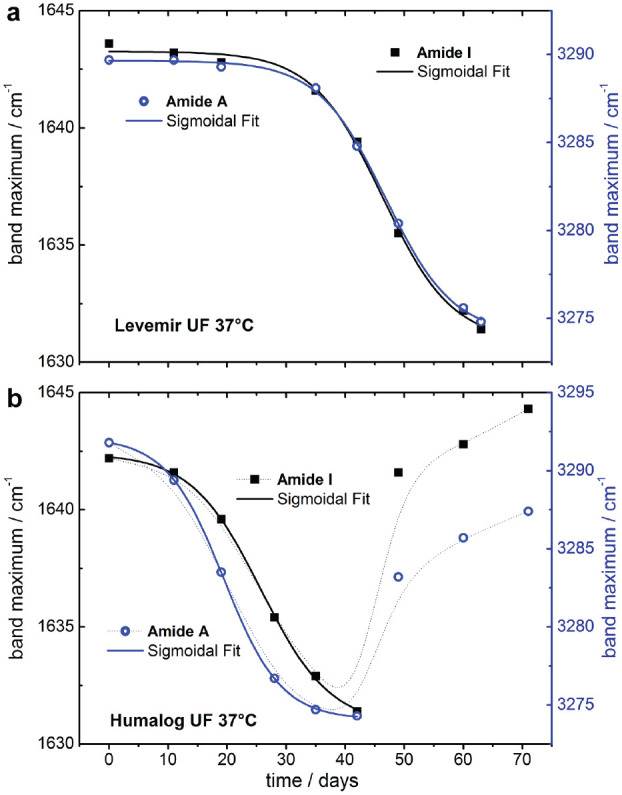
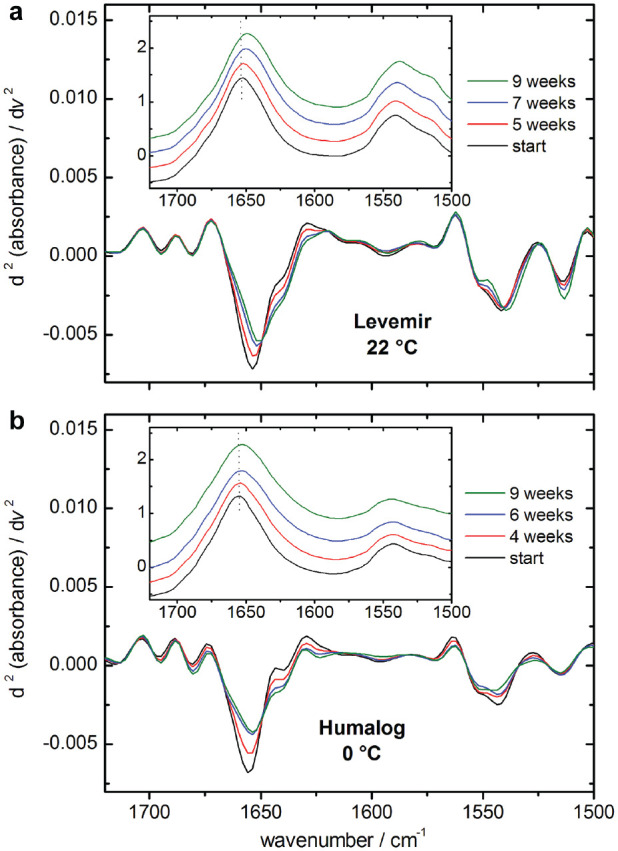
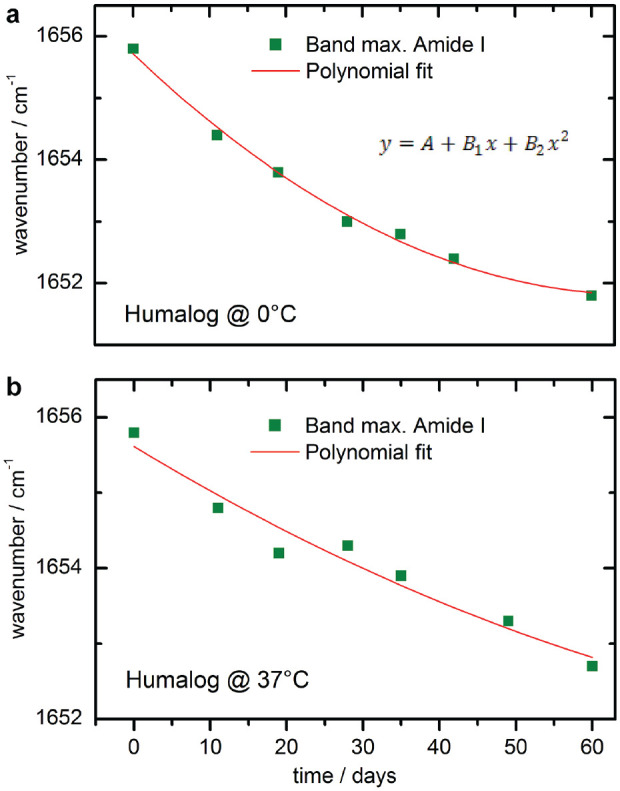
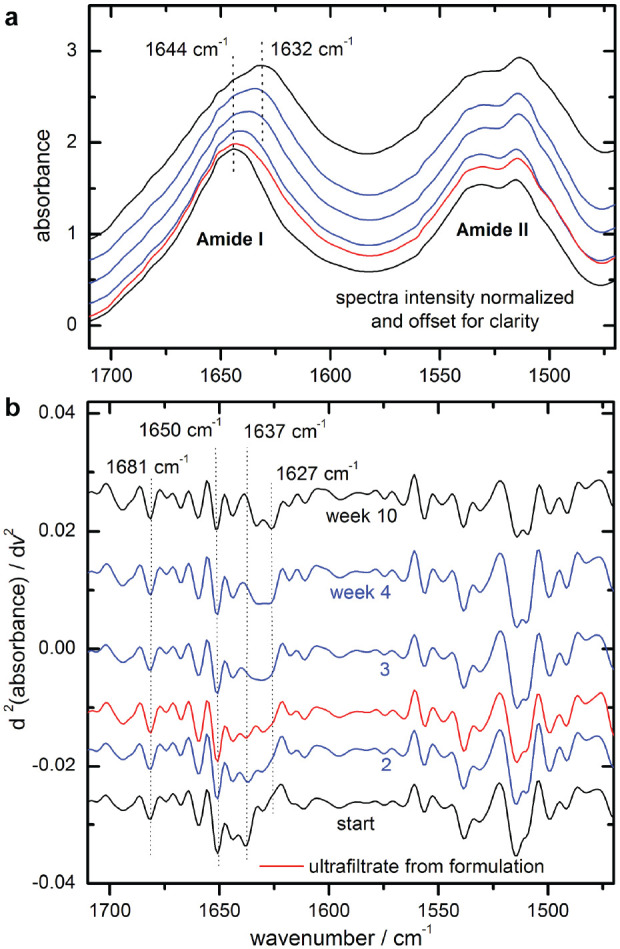
Method: Infrared attenuated total reflection spectroscopy has been used for the analysis of insulin dry film preparations using affordable instrumentation. This method can be applied to either formulated insulin specimens or pure insulins obtained by ultrafiltration. Such samples have been stored under different temperatures (0°C, 20°C, and 37°C), and degradation processes have been monitored up to a period of a few months.

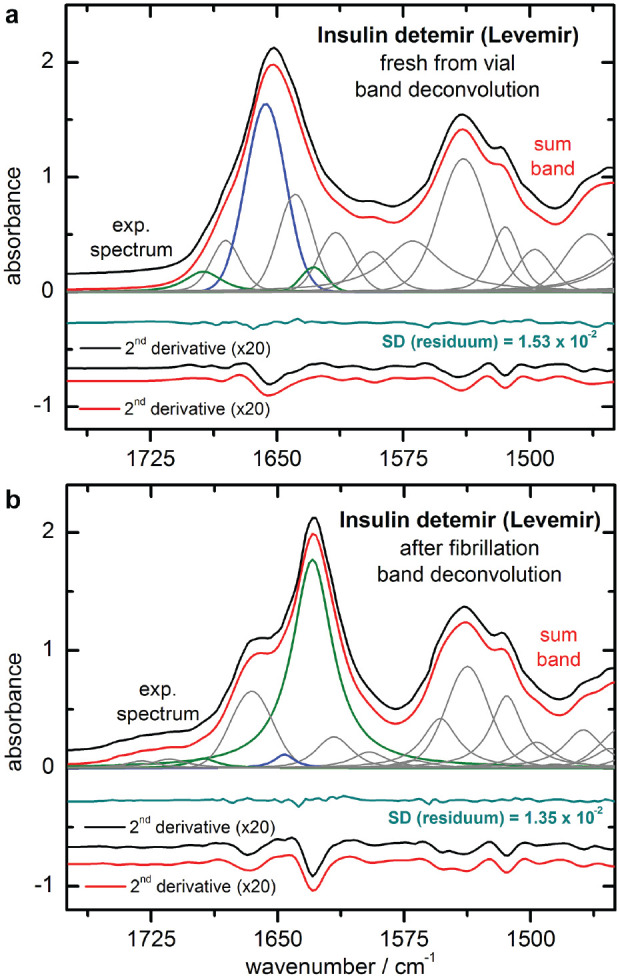
Results: By analyzing specific shifts of absorption bands in the infrared spectra, which are sensitive to the protein secondary structure, even small structural changes in the hormone become evident. Another option is amide I band deconvolution into individual bands, which can be attributed to secondary structure subunits that are part of the insulin tertiary structure.

Conclusion: A novel and innovative method based on infrared attenuated total reflection spectroscopy of insulin dry films is a promising analytical tool for quantifying the degree of insulin degradation, as it provides information on indicating a decrease in biological potency. The established methods for insulin potency assays require animal testing or clamp experiments on people with diabetes.

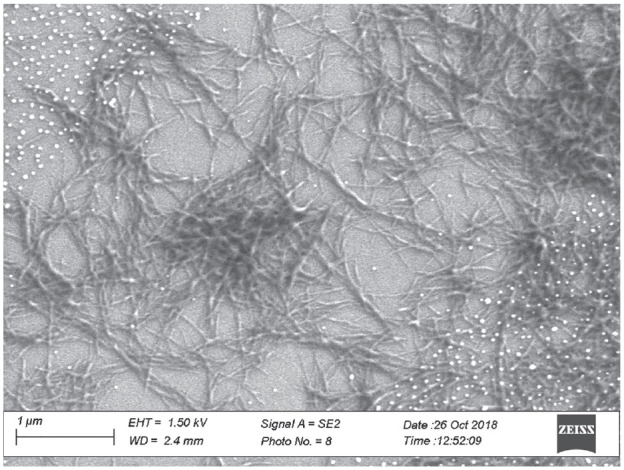
Keywords: FTIR-ATR spectroscopy; band deconvolution; insulin fibrils; insulin stability; quality control; secondary structure analysis.


Conflict of interest statement

Declaration of Conflicting Interests: The author(s) declared no potential conflicts of interest with respect to the research, authorship, and/or publication of this article.

Figures

Figure 1.
Figure 1.
3D model showing the structure of the human insulin (3I40) with its peptide A and B chains. The secondary structure is composed of 47% alpha helices and 4% beta sheets (chain A), as well as of 46% alpha helices and 3% beta sheets (chain B).
Figure 2.
Figure 2.
Fourier transform infrared attenuated total reflection (FT-IR ATR) spectra from insulin lispro, prepared as dry-films (1 µl sample volumes): pure insulin from ultrafiltration and insulin formulation samples with excipient compounds such as glycerol and phenol (the latter dry-film had been prepared from 2 % aqueous solution).
Figure 3.
Figure 3.
Scanning electron microscopic image of an insulin fibril network measured with a ZEISS Scanning Electron Micro-scope (Sigma 300 VP, Oberkochen, Germany). The white dots are gold nanoparticles from the sputtering process.
Figure 4.
Figure 4.
Experimental and fitted sum band spectra, calculated from least squares band deconvolution of the freshly taken (a) and forced fibrillated (b) samples of insulin detemir formulations, are shown as upper traces. Also shown are the fitted band components and the difference spectra, obtained after curve fitting (shifted from zero for clarity). For individual band localization, second derivative spectra were successfully used (lowest traces).
Figure 5.
Figure 5.
Experimental infrared attenuated total reflection spectra of insulin detemir samples from an ultrafiltrated intact formulation, as stored at 37 °C over a time period of nine weeks (spectral resolution of 8 cm-1, min-max-normalized to the amide I band), and presented with a small offset each (a) and corresponding second derivative spectra (b).
Figure 6.
Figure 6.
Plot of the amide I (left scale) and A (right scale) maximum band positions of the long term measurements of a pure insulin detemir sample as obtained from ultrafiltration of an intact formulation when stored at 37°C - both curves are from a least-squares fit with a sigmoidal Boltzmann function (a); plot of the amide I and A maximum band positions obtained during the long term monitoring of an ultrafiltrated insulin lispro sample stored at 37°C (b).
Figure 7.
Figure 7.
Maximum amide I band positions and corresponding second derivative spectra of exemplary insulin samples (insulin detemir [a] and insulin lispro [b]), stored at room temperature and at 0° C, respectively. Changes within the intensity normalized amide I bands are clearly detectable by comparing either the maximum band positions in the absorbance or the second derivative spectra against the reference (experiment start).
Figure 8.
Figure 8.
Maximum amide I band positions of two different insulin lispro (Humalog) samples, stored at 0 °C (a) and at 37 °C (b), plotted against the storage time and fitted with a polynomial function.
Figure 9.
Figure 9.
Normalized dry-film attenuated total reflection spectra of ultrafiltrated insulin lispro samples, stored at 37 °C over a time period of ten weeks (week assignments, see b), as well as the spectrum of an ultrafiltrated sample of an insulin lispro formulation after approximately four months (second from below; a); corresponding second derivative spectra with characteristic secondary structure band positions (ultrafiltrated sample third trace from below; b).

References

    1. Sarroukh R, Goormaghtigh E, Ruysschart JM, Raussens V. ATR-FTIR: a rejuvenated tool to investigate amyloid proteins. Biochim Biophys Acta. 2013;1828(10):2328-2338. - PubMed
    1. Nielsen L, Khtana R, Coats A, et al.. Effect of environmental factors on the kinetics of insulin fibril formation: elucidation of the molecular mechanism. Biochemistry. 2001;40(20):6036-6046. - PubMed
    1. Beals JM, DeFelippis MR, Kovach PM, Jackson JA. Insulin. In: Crommelin DJA, Sindelar RD, Meibohm B. (eds). Pharmaceutical Biotechnology – Fundamentals and Applications. 4th ed. New York: Springer; 2013:255-275.
    1. Kabsch W, Sander C. Dictionary of protein secondary structure: pattern recognition of hydrogen-bonded and geometrical features, PDB ID: 3I40. Biopolymers. 1983;22(12):2577-2637. - PubMed
    1. Rose AS, Bradley AR, Valasatava Y, Duarte JM, Prlic A, Rose PW. NGL viewer: web-based molecular graphics for large complexes. Bioinformatics. 2018;34(21):3755-2758. - PMC - PubMed