. 2020 May 21;48(9):5147-5156.
doi: 10.1093/nar/gkaa207.

Determinants of cyclization-decyclization kinetics of short DNA with sticky ends

Affiliations

Determinants of cyclization-decyclization kinetics of short DNA with sticky ends

Jiyoun Jeong et al. Nucleic Acids Res. .

Abstract

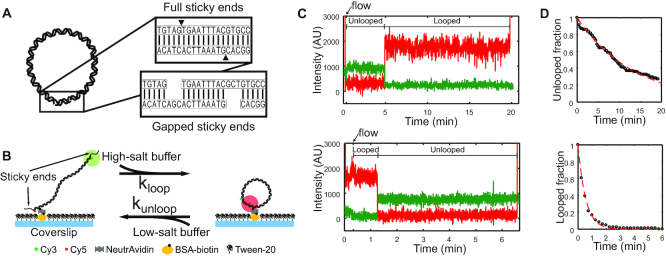
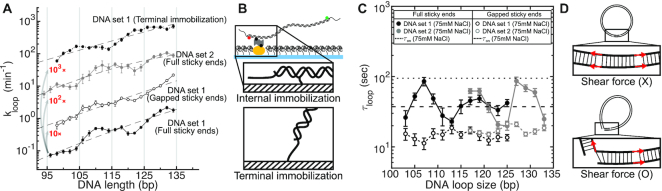
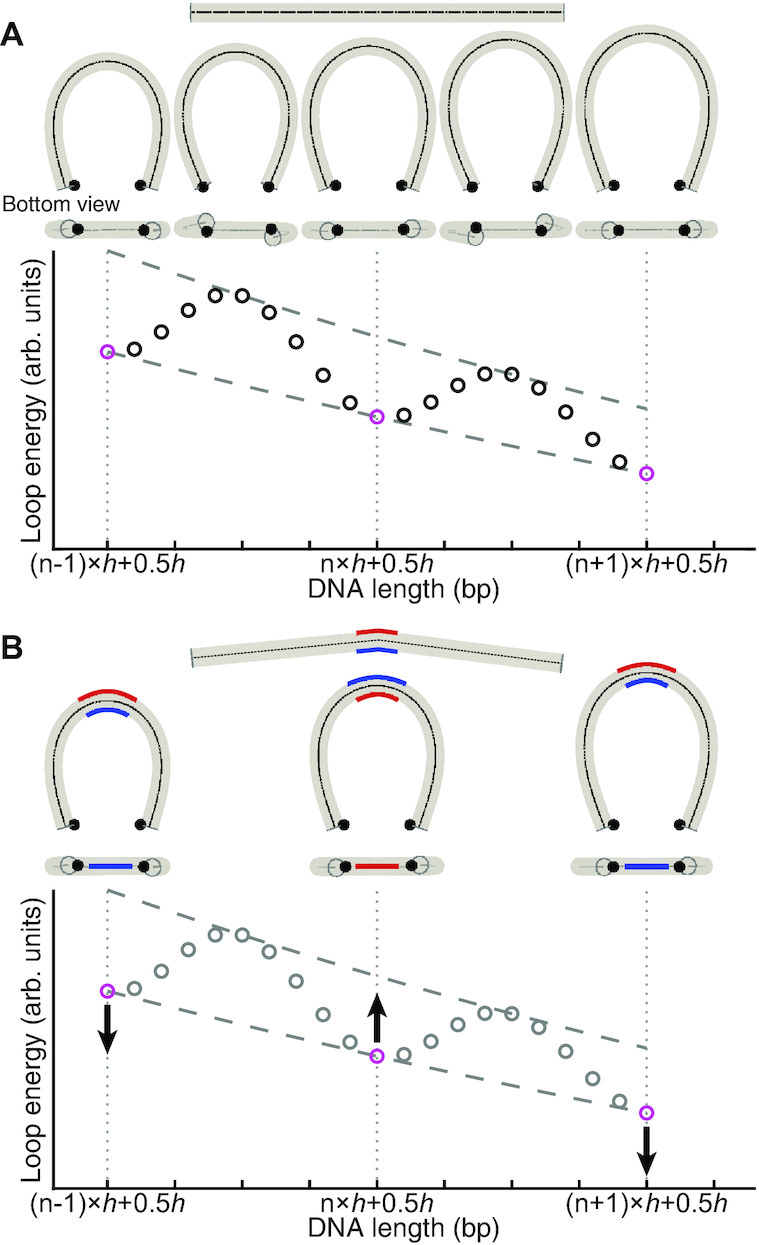
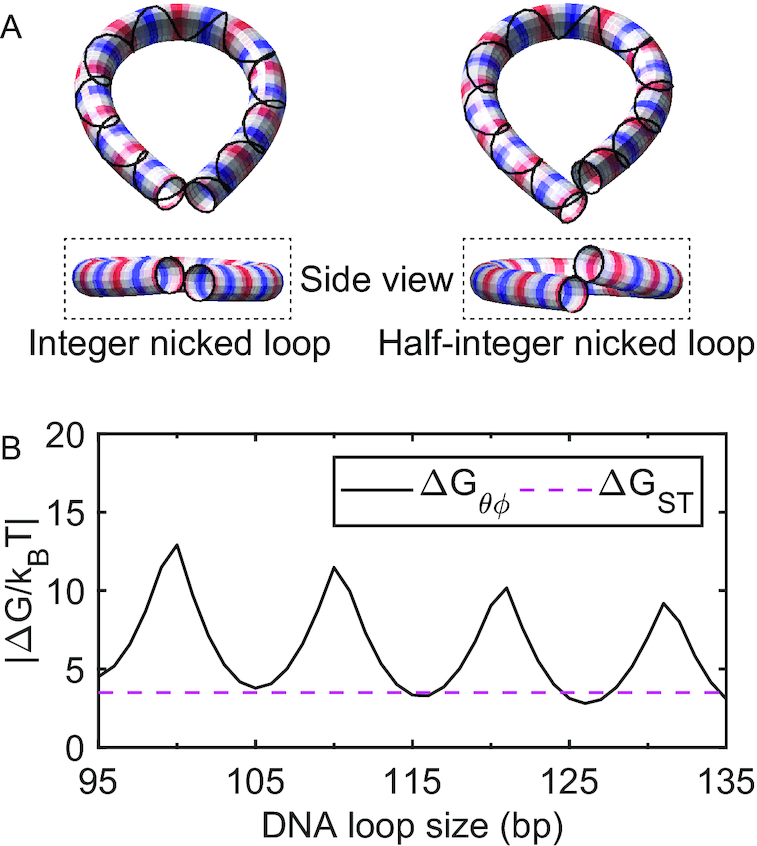
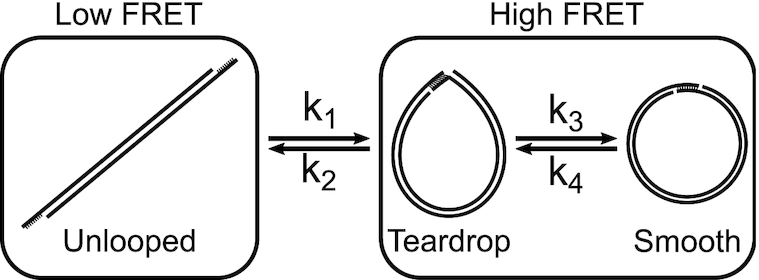
Cyclization of DNA with sticky ends is commonly used to measure DNA bendability as a function of length and sequence, but how its kinetics depend on the rotational positioning of the sticky ends around the helical axis is less clear. Here, we measured cyclization (looping) and decyclization (unlooping) rates (kloop and kunloop) of DNA with sticky ends over three helical periods (100-130 bp) using single-molecule fluorescence resonance energy transfer (FRET). kloop showed a nontrivial undulation as a function of DNA length whereas kunloop showed a clear oscillation with a period close to the helical turn of DNA (∼10.5 bp). The oscillation of kunloop was almost completely suppressed in the presence of gaps around the sticky ends. We explain these findings by modeling double-helical DNA as a twisted wormlike chain with a finite width, intrinsic curvature, and stacking interaction between the end base pairs. We also discuss technical issues for converting the FRET-based cyclization/decyclization rates to an equilibrium quantity known as the J factor that is widely used to characterize DNA bending mechanics.


Figures

Figure 1.
Figure 1.
(A) Schematic representation of a looped DNA molecule with annealed sticky ends. Close-up views show duplexed sticky ends, which we refer to as a linker duplex, without (top) and with (bottom) gaps. (B) Experimental setup in the FRET-based cyclization (looping) and decyclization (unlooping) assays. Fluorescently labeled DNA molecules with sticky ends are immobilized on a passivated coverslip and continuously excited by the evanescent wave of a 532-nm laser. The cation concentration of the surrounding imaging buffer is exchanged to promote either looping or unlooping of the DNA molecules. (C) Examples of typical fluorescence trajectories of a single DNA molecule on the surface transitioning from the unlooped state to the looped state (top) and from the looped state to the unlooped state (bottom) upon sudden salt-exchange at time = 20 s (marked by an arrow). The green and red lines represent the donor (Cy3) and acceptor (Cy5) intensities, respectively. The molecules are briefly excited by a 640-nm laser in the beginning and the end for co-localization of Cy3 and Cy5 as well as to confirm the presence of Cy5. (D) Examples of decay curves of the unlooped (top) and looped (bottom) fractions of molecules. The rates are extracted by fitting the data (black) with an exponential function (red).
Figure 2.
Figure 2.
(A) Looping rates (kloop) of DNA molecules in DNA sets 1 and 2. For easy visualization, different data sets are vertically shifted by factors indicated in red. The closed and open circles represent data measured with the full and gapped sticky pairs, respectively. The dotted line represents data from DNA set 1 immobilized through the terminal phosphate. The dashed lines are quadratic fits to the data. Error bars represent the standard errors of the mean. (B) Different surface immobilization schemes. For most experiments, the DNA molecules were immobilized through a biotin linked to an internal thymine base (internal immobilization, top panel). This immobilization scheme can potentially hinder axial rotation of DNA, thus limiting the range of bending directions. In comparison, the terminal immobilization scheme (bottom panel) where DNA is attached to the surface through a terminal phosphate allows all bending directions to be explored for loop formation. (C) Mean lifetimes of DNA molecules in DNA sets 1 and 2 in the looped state. The DNA molecules with the full and gapped sticky ends are measured at 75 mM [NaCl] and shown as closed and open circles, respectively. The dotted and dashed horizontal lines represent the lifetimes of the full and gapped linker duplex, respectively. The DNA loop size includes the length of the annealed sticky ends (9 bp). Error bars represent the standard errors of the mean. (D) Schematic of how nick closing (terminal base stacking) can alter the stress geometry of the linker duplex. A fully stacked linker duplex (top) does not experience a shear force and therefore is more stable. In comparison, an unstacked linear duplex (bottom) experiences a shear force and therefore is less stable.
Figure 3.
Figure 3.
Illustration of the length-dependence of looping rate (kloop). (A) Looping of a straight DNA molecule. Shown below the straight DNA molecule (top) are the minimum energy loop conformations at integer (n-1,n, n+1) and half-integer (n-0.5,n+0.5,n+1.5) multiples of the helical turn (h). In this minimization, the constraint is imposed on the distance between the two sticky end positions (black dots). As shown in the bottom plot, the loop energy exhibits local minima (magenta circles) at half-integer multiples of h because the sticky ends can be on the near sides of a planar loop. At integer multiples of h, however, the minimum energy conformation is nonplanar, and the loop energy exhibits local maxima. (B) Looping of a curved DNA molecule. For illustrative purposes, nonzero intrinsic curvature is added to the center of the molecule (top), and the three conformations at half-integer multiples of h from (A) are shown. Due to the intrinsic curvature, the loop energy is lowered when the sticky ends are on the same side as the blue side, but increases when they are on the opposite (red) side. Hence, the intrinsic curvature can modulate the loop energy as a function of length with a period of 2h.
Figure 4.
Figure 4.
(A) Minimum-energy shapes of a cylindrical DNA model with a single nick (left: 105 bp and right: 100 bp). The strand without a nick is represented as a solid line around the cylindrical shapes. Here, the two ends (the first and last 10 bp) of the cylinder are volume-excluded from each other during the energy minimization procedure. (49). The alternating red and blue colors indicate one helical turn (e.g. the spacing between neighboring reds (or blue) is about one helical turn). (B) Comparison of free energy costs. ΔGθϕ is the free energy cost to axially and torsionally align the ends of the helix at the tip of a small teardrop loop (solid line), and ΔGST is the average base pair stacking energy of all 16 dinucleotides taken from Ref. (50) (dashed line). The extrapolation method in the same reference is applied to extrapolate the stacking energy for 20°C and [NaCl] = 0.1 M.
Figure 5.
Figure 5.
Three-state DNA cyclization model. A sticky-ended short DNA molecule undergoes a transition between the low FRET (unlooped) state and the high FRET (looped) state. The transition rates between these two FRET states (k1 and k2) are governed by the bending energy of DNA. Two different macrostates, teardrop and smooth, can exist within the high FRET state since the looped molecule contains nicks that can spontaneously close and open. Transitions between the teardrop and smooth states occur with rates of k3 and k4, and are associated with local transitions of nick closing and opening. For the transition from the teardrop state to the smooth state, integer loops need axial alignment only while half-integer loops need both axial and torsional alignment. Therefore, integer loops can transition to the smooth state more readily than half-integer loops.
Figure 6.
Figure 6.
(A) Jexp as a function of DNA length. The measured values of Jexp from DNA sets 1 and 2 with full sticky ends are plotted in black and gray circles, respectively. Jexp is compared with Jth (dashed lines) calculated based on (52). In this calculation, we assumed the loop capture distance is equal to 7 nm. The shared area between the dashed lines represent the prediction made with a range of persistence lengths from 40 to 50 nm. The size of error bars (not shown) is similar to the size of the data points. (B) Joint probability distributions (P1, θ2)) of coarse-grained DNA chains. The schematic at the bottom shows a DNA chain constrained with a short end-to-end distance, |r|. θ1 and θ2 are the angles between the chain ends and the end-to-end vector. The left and right density plots represent the joint distributions of θ1 and θ2 for 100- and 500-bp loops, respectively. The projected probability distributions of θ1 and θ2 are individually plotted along the x- and y-axis of each density plot, respectively. The magenta line represents the unconstrained P1, θ2), which is equal to the sine function.

References

    1. Tardin C. The mechanics of DNA loops bridged by proteins unveiled by single-molecule experiments. Biochimie. 2017; 142:80–92. - PubMed
    1. Brennan L.D., Forties R.A., Patel S.S., Wang M.D.. DNA looping mediates nucleosome transfer. Nat. Commun. 2016; 7:13337. - PMC - PubMed
    1. Becker N.A., Schwab T.L., Clark K.J., Maher L.J. III. Bacterial gene control by DNA looping using engineered dimeric transcription activator like effector (TALE) proteins. Nucleic Acids Res. 2018; 46:2690–2696. - PMC - PubMed
    1. Cournac A., Plumbridge J.. DNA looping in prokaryotes: experimental and theoretical approaches. J. Bacteriol. 2013; 195:1109–1119. - PMC - PubMed
    1. Gemmen G.J. DNA looping by two-site restriction endonucleases: heterogeneous probability distributions for loop size and unbinding force. Nucleic Acids Res. 2006; 34:2864–2877. - PMC - PubMed

Publication types