. 2020 May 21;48(9):4627-4642.
doi: 10.1093/nar/gkaa186.

Selective targeting of mutually exclusive DNA G-quadruplexes: HIV-1 LTR as paradigmatic model

Affiliations

Selective targeting of mutually exclusive DNA G-quadruplexes: HIV-1 LTR as paradigmatic model

Martina Tassinari et al. Nucleic Acids Res. .

Abstract

Targeting of G-quadruplexes, non-canonical conformations that form in G-rich regions of nucleic acids, has been proposed as a novel therapeutic strategy toward several diseases, including cancer and infections. The unavailability of highly selective molecules targeting a G-quadruplex of choice has hampered relevant applications. Herein, we describe a novel approach, based on naphthalene diimide (NDI)-peptide nucleic acid (PNA) conjugates, taking advantage of the cooperative interaction of the NDI with the G-quadruplex structure and hybridization of the PNA with the flanking region upstream or downstream the targeted G-quadruplex. By biophysical and biomolecular assays, we show that the NDI-PNA conjugates are able to specifically recognize the G-quadruplex of choice within the HIV-1 LTR region, consisting of overlapping and therefore mutually exclusive G-quadruplexes. Additionally, the conjugates can induce and stabilize the least populated G-quadruplex at the expenses of the more stable ones. The general and straightforward design and synthesis, which readily apply to any G4 target of choice, together with both the red-fluorescent emission and the possibility to introduce cellular localization signals, make the novel conjugates available to selectively control G-quadruplex folding over a wide range of applications.


Figures

Scheme 1.
Scheme 1.
Synthesis of the NDI moiety. (A) tert-Butyl 6-aminohexanoate, acetonitrile, 60°C, 4.5 h, N2; (B) N,N-dimethyl-1,3-propandiamine, 120°C, 5 min, MW; (C) dichloromethane, trifluoroacetic acid, triisopropylsilane, r.t., 6 h.
Figure 1.
Figure 1.
Schematic representation of the sequences that fold into LTR-II, LTR-III and LTR-IV G4s. Guanines involved in G4 structure formation are shown in bold.
Figure 2.
Figure 2.
Proposed recognition model for a general G4 structure, based on the cooperative binding of the PNA (in red) to a sequence flanking the G4 of interest (in blue) and contextual interaction of a red fluorescent NDI moiety (in yellow) with the G4 structure.
Figure 3.
Figure 3.
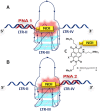
Conjugates NDI-PNA 1 and NDI-PNA 2 binding the full G-rich LTR sequence (here called LTR-II+III+IV), according to (A) anti-parallel and (B) parallel binding modes; (C) structures of both conjugated NDI 5 and control NDI 6.
Figure 4.
Figure 4.
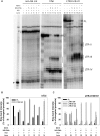
Taq polymerase stop assay on LTR-II+III+IV and control hTel templates. (A) LTR-II+III+IV and hTel templates were amplified by Taq polymerase at 42°C in the absence (lanes 8 and 15) and presence of 1 × 10⁻¹ M KCl, alone (lanes 9 and 16) or with 4 × 10⁻⁷ M of NDI-PNA 5 (lanes 10 and 17), NDI-PNA 4 (lanes 11 and 18), NDI-PNA 3 (lanes 12 and 19), NDI-PNA 1 (lanes 13 and 20), or NDI 6 (lanes 14 and 21). A template (non-G4 cnt) made of a scrambled sequence unable to fold into G4 was also used as negative control (lanes 1–7). Lane P: unreacted labeled primer. Lane M: ladder of markers obtained by the Maxam and Gilbert sequencing carried out on the amplified strand complementary to the template strand. Vertical bars indicate G4-specific Taq polymerase stop sites. The three gel portions derive from a single gel run. (B) Quantification of lanes 8–14 shown in panel A. Quantification of stop bands corresponding to hTel G4 and of the full-length amplification product (FL) is shown. (C) Quantification of lanes 15–21 shown in panel A. Quantification of stop bands corresponding to LTR-II, LTR-III, LTR-IV G4s and of the full-length amplification product (FL) is shown.
Figure 5.
Figure 5.
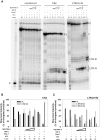
Taq polymerase stop assay on LTR-III+IV and control hTel templates. (A) LTR-III+IV and hTel templates were amplified by Taq polymerase at 42°C in the absence (lanes 8 and 15) and presence of 1 × 10⁻¹ M KCl, alone (lanes 9 and 16) or with increasing amounts (1 × 10⁻⁷, 2 × 10⁻⁷ and 4 × 10⁻⁷ M) of NDI-PNA 6 (lanes 10–12 and 17–19), 4 × 10⁻⁷ M of PNA 7 (lanes 13 and 20) or 4 × 10⁻⁷ M of NDI 6 (lanes 14 and 21). A template (non-G4 cnt) made of a scrambled sequence unable to fold into G4 was also used as negative control (lanes 1–7). Lane P: unreacted labeled primer. Lane M: ladder of markers obtained by the Maxam and Gilbert sequencing carried out on the amplified strand complementary to the template strand. Vertical bars indicate G4-specific Taq polymerase stop sites. * indicates the stop site corresponding to the binding of the PNA to its complementary sequence on the LTR-III+IV template. (B) Quantification of lanes 8–14 shown in panel A. Quantification of stop bands corresponding to hTel G4 and of the full-length amplification product (FL) is shown. (C) Quantification of lanes 15–21 shown in panel A. Quantification of stop bands corresponding to LTR-III, LTR-IV G4s and of the full-length amplification product (FL) is shown.
Figure 6.
Figure 6.
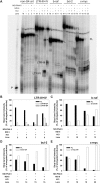
Taq polymerase stop assay on control G4-forming templates devoid of the PNA complementary sequence. (A) LTR-III+IV, b-raf, bcl-2 and c-myc templates were amplified by Taq polymerase at 60°C in the absence (lanes 5, 9, 13 and 17) and presence of 1 × 10⁻¹ M KCl, alone (lanes 6, 10, 14 and 18) or with 4 × 10⁻⁷ M of NDI-PNA 6 (lanes 7, 11, 15 and 19) or NDI 6 (lanes 8, 12, 16 and 20). A template (non-G4 cnt) made of a scrambled sequence unable to fold into G4 was also used as internal control (lanes 1–4). Lane P: unreacted labeled primer. Lane M: ladder of markers obtained by the Maxam and Gilbert sequencing carried out on the amplified strand complementary to the template strand. Vertical bars indicate G4-specific Taq polymerase stop sites. * indicates the stop site corresponding to the binding of the PNA moiety to its complementary sequence on the LTR-III+IV template. (B) Quantification of lanes 5–8 shown in panel A. Quantification of stop bands corresponding to LTR-III, LTR-IV G4s and of the full-length amplification product (FL) is shown. (C) Quantification of lanes 9–12 shown in panel A. Quantification of stop bands corresponding to b-raf G4 and of the full-length amplification product (FL) is shown. (D) Quantification of lanes 13–16 shown in panel A. Quantification of stop bands corresponding to bcl-2 G4 and of the full-length amplification product (FL) is shown. (E) Quantification of lanes 17–20 shown in panel A. Quantification of stop bands corresponding to c-myc G4 and of the full-length amplification product (FL) is shown.
Figure 7.
Figure 7.
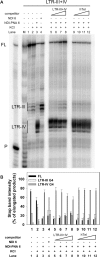
Competition Taq polymerase stop assay. (A) LTR-III+IV template was amplified by Taq polymerase at 42°C in the presence of 1 × 10⁻¹ M KCl combined with a constant amount (4 × 10⁻⁷ M) of NDI-PNA 6 and increasing concentrations (1–8-fold) of competitor, LTR-III+IV (lanes 5–8) or hTel (lanes 9–12). Lanes without competitor (lanes 1–4) were used as internal controls, in the absence (lane 1) and presence of 1 × 10⁻¹ M KCl, alone (lane 2), or combined with 4 × 10⁻⁷ M of NDI-PNA 6 (lane 3) or NDI 6 (lane 4). Lane P: unreacted labeled primer. Lane M: ladder of markers obtained by the Maxam and Gilbert sequencing carried out on the amplified strand complementary to the template strand. Vertical bars indicate G4-specific Taq polymerase stop sites. (B) Quantification of lanes 1–12 shown in panel A. Quantification of stop bands corresponding to LTR-III, LTR-IV G4s and of the full-length amplification product (FL) is shown.
Figure 8.
Figure 8.
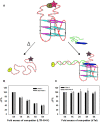
Isothermal FRET assay. (A) Schematics of the experiment: classic FRET melting assay is carried out monitoring the donor fluorescence (F) upon heating of the NA that disrupts the fluorescence donor (F)/quencher (Q) interaction (top). In our modified isothermal assay, the disruption of the F/Q interaction occurs at r.t., upon hybridization with the conjugate (bottom). (A, B) Isothermal FRET assay results obtained for 5′-FAM and 3′-TAMRA labeled LTR-III+IV (2.5 × 10⁻⁷ M) mixed with increasing concentrations (1–8×) of unlabeled competitor, (B) LTR-III+IV or (C) hTel, and a constant amount (1 × 10⁻⁶ M) of NDI-PNA 6 or PNA 7. ΔF% is calculated as (ΔF1F2) × 100, where ΔF1 is the difference between the fluorescence of the labeled NA in the presence of both NDI-PNA 6 or PNA 7 and competitor, and the basal fluorescence of the NA alone, while ΔF2 is the difference in fluorescence measured without competitor.
Figure 9.
Figure 9.
Strand displacement analysis by EMSA. Labeled LTR-III+IV (LTR-III+IV*) was annealed to 1.1-fold excess of LTR-III+IV complementary sequences (Compl) of different lengths (13 or 17 nucleotides) and incubated with increasing fold excess (0.5-4X) of NDI-PNA 6 or PNA 7 (PNA), as indicated, at 37°C, overnight. Reaction solutions were loaded onto 16% native polyacrylamide gel in 1X TBE buffer and KCl (1 × 10⁻¹ M). The gel was run overnight at 60 V and DNA molecules were visualized by phosphorimaging. Lane M: markers of 33 and 55 nt-long oligonucleotides. ‘Ss’ indicates the folded LTR-III+IV* oligonucleotide; ‘ss + compl’ indicates the LTR-III+IV* oligonucleotide complemented to the 13- or 17-nt long oligonucleotides; ‘ss + PNA’ indicates the complex between the LTR-III+IV* oligonucleotide and the indicated PNA derivative.
Figure 10.
Figure 10.
Evaluation of cell entry by confocal microscopy. Images of (A) untreated TZM-bl cells, TZM-Bl cells treated with 5 × 10⁻⁵ M of (B) NDI-PNA 6, (C) NDI 6 or (D–F) NDI-PNA 8. The –compounds were incubated with the cells for 2 h before cell fixation in 2% PFA. Nuclear staining was obtained with Nuclear Green LCS1. For NDI/conjugates (red channel) images (A-D) were visualized at 561 nm excitation wavelength and 570–620 nm emission range; for cell nuclei (green channel) (E) 488 nm excitation wavelength and 500–550 nm emission range were applied. (F) Overlap of panels (D) and (E).
Figure 11.
Figure 11.
Evaluation of cell entry by confocal microscopy. Images of (A) untreated TZM-bl cells, TZM-Bl cells treated with 1 × 10⁻⁵ M of (B) NDI-PNA 9 or (C) NDI 6. The compounds were incubated with the cells for 1 h before cell fixation in 2% PFA. For NDI/conjugates images were visualized at 561 nm excitation wavelength and 570–620 nm emission range.

Similar articles

Cited by

References

    1. Huppert J.L. Structure, location and interactions of G-quadruplexes. FEBS J. 2010; 277:3452–3458. - PubMed
    1. Burge S., Parkinson G.N., Hazel P., Todd A.K., Neidle S.. Quadruplex DNA: sequence, topology and structure. Nucleic Acids Res. 2006; 34:5402–5415. - PMC - PubMed
    1. Rhodes D., Lipps H.J.. G-quadruplexes and their regulatory roles in biology. Nucleic Acids Res. 2015; 43:8627–8637. - PMC - PubMed
    1. Lipps H.J., Rhodes D.. G-quadruplex structures: in vivo evidence and function. Trends Cell Biol. 2009; 19:414–422. - PubMed
    1. Huppert J.L., Balasubramanian S.. Prevalence of quadruplexes in the human genome. Nucleic Acids Res. 2005; 33:2908–2916. - PMC - PubMed

Publication types