

Bayesian analysis of survival data with missing censoring indicators
- PMID: 32282929
- PMCID: PMC7733523
- DOI: 10.1111/biom.13280
Bayesian analysis of survival data with missing censoring indicators
Abstract
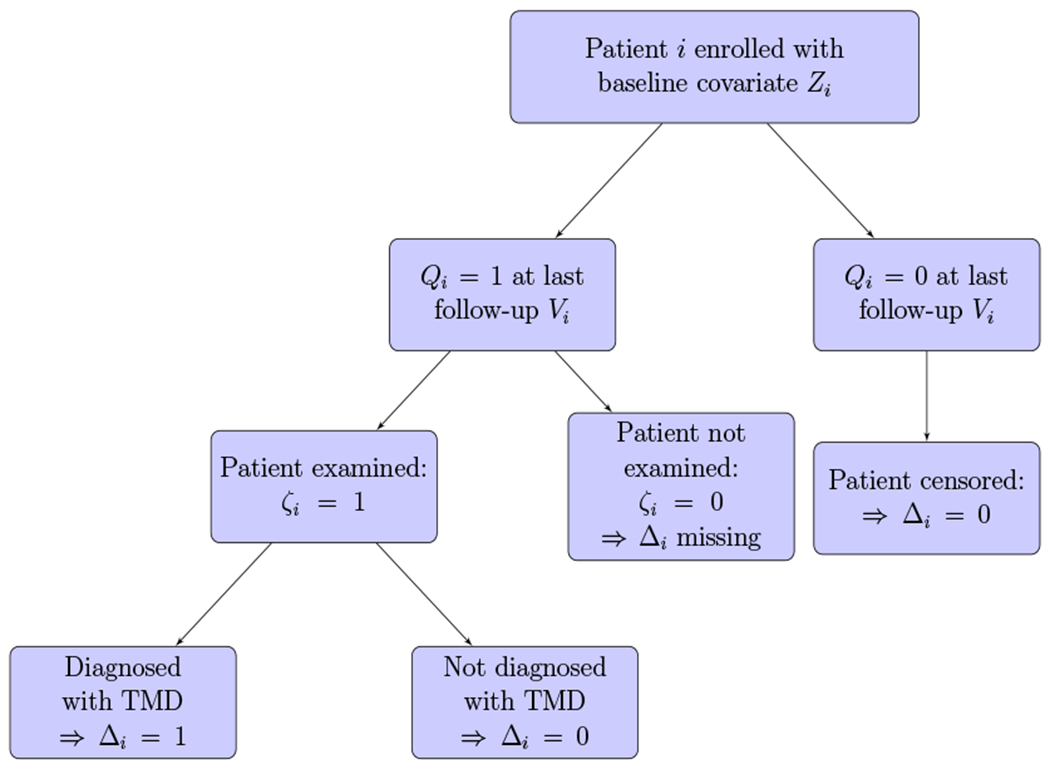
In some large clinical studies, it may be impractical to perform the physical examination to every subject at his/her last monitoring time in order to diagnose the occurrence of the event of interest. This gives rise to survival data with missing censoring indicators where the probability of missing may depend on time of last monitoring and some covariates. We present a fully Bayesian semi-parametric method for such survival data to estimate regression parameters of the proportional hazards model of Cox. Theoretical investigation and simulation studies show that our method performs better than competing methods. We apply the proposed method to analyze the survival data with missing censoring indicators from the Orofacial Pain: Prospective Evaluation and Risk Assessment study.
Keywords: interim event adjudication; missing data; proportional hazards; semiparametric Bayes; time-to-event.
© 2020 The International Biometric Society.
Figures

References
-
- Canty A and Ripley B (2016). boot: Bootstrap R (S-Plus) Functions. R package version 1.3-18.
-
- Cook TD and Kosorok MR (2004). Analysis of time-to-event data with incomplete event adjudication. Journal of the American Statistical Association 99, 1140–1152.
-
- Cox D (1972). Regression models and life-tables. Journal of the Royal Statistical Society. Series B (Methodological) 34, 187–220.
Publication types
MeSH terms
Grants and funding
LinkOut - more resources
Full Text Sources
