. 2020 Sep;20(9):2425-2436.
doi: 10.1111/ajt.15885. Epub 2020 Jun 15.

Organ-specific metabolic profiles of the liver and kidney during brain death and afterwards during normothermic machine perfusion of the kidney

Affiliations

Organ-specific metabolic profiles of the liver and kidney during brain death and afterwards during normothermic machine perfusion of the kidney

Anne C van Erp et al. Am J Transplant. 2020 Sep.

Abstract

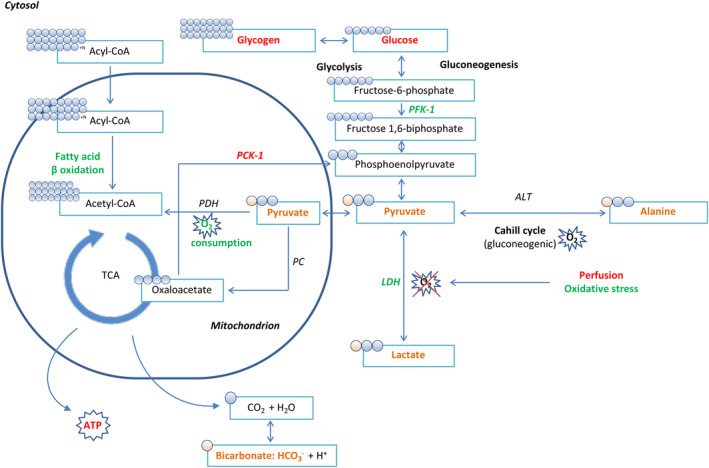
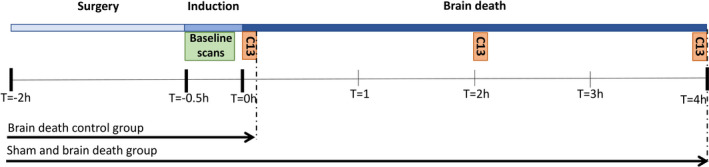
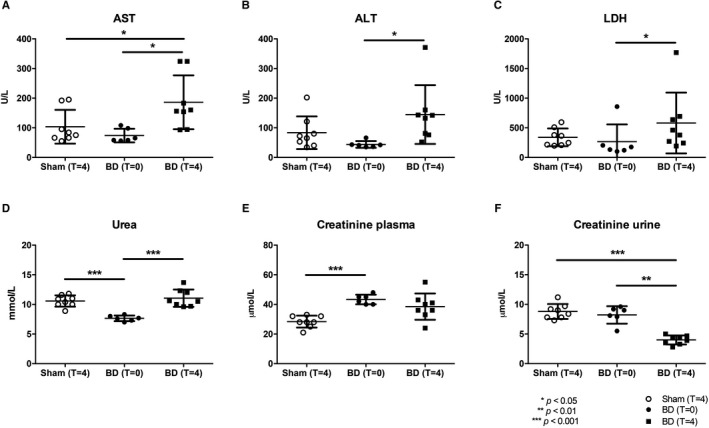
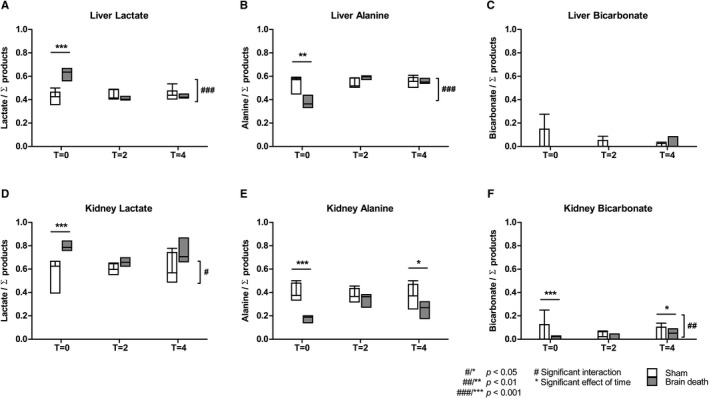
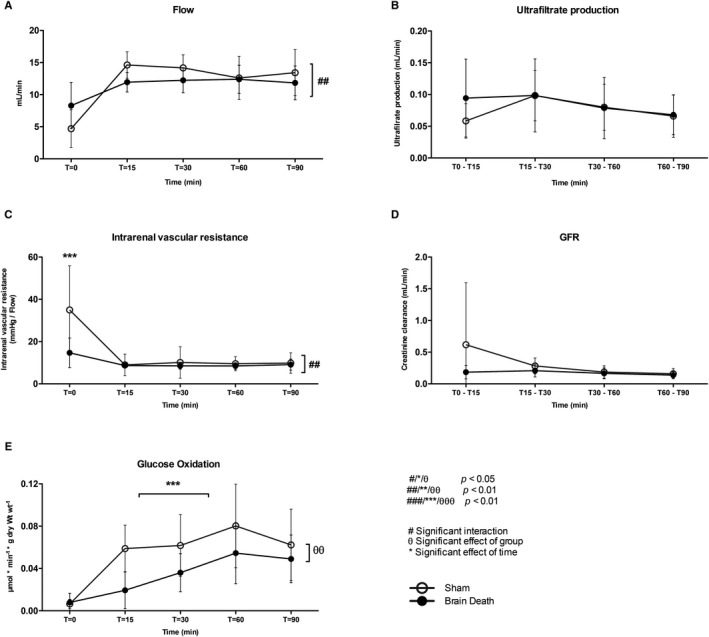
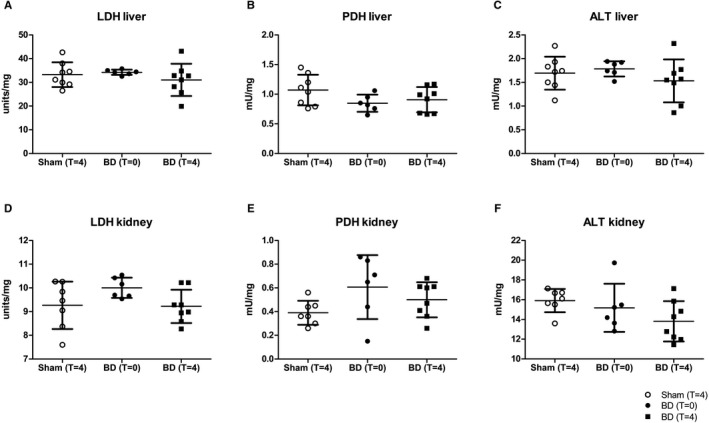
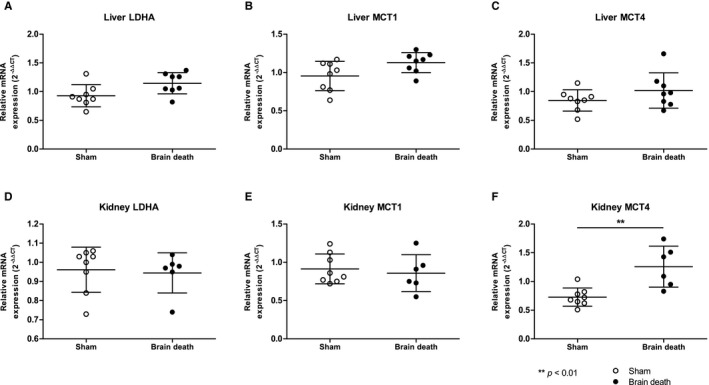
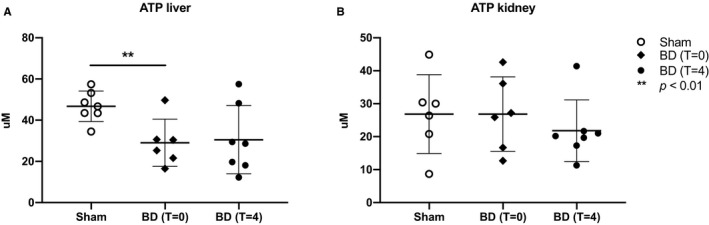
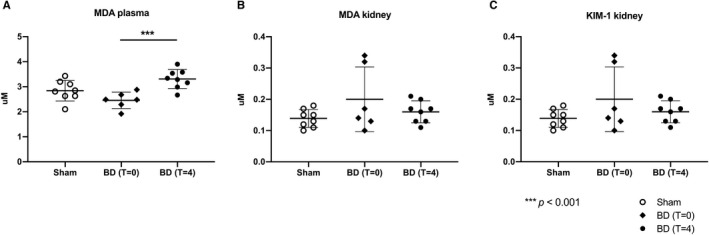
We investigated metabolic changes during brain death (BD) using hyperpolarized magnetic resonance (MR) spectroscopy and ex vivo graft glucose metabolism during normothermic isolated perfused kidney (IPK) machine perfusion. BD was induced in mechanically ventilated rats by inflation of an epidurally placed catheter; sham-operated rats served as controls. Hyperpolarized [1-13 C]pyruvate MR spectroscopy was performed to quantify pyruvate metabolism in the liver and kidneys at 3 time points during BD, preceded by injecting hyperpolarized[1-13 C]pyruvate. Following BD, glucose oxidation was measured using tritium-labeled glucose (d-6-3H-glucose) during IPK reperfusion. Quantitative polymerase chain reaction and biochemistry were performed on tissue/plasma. Immediately following BD induction, lactate increased in both organs (liver: eµd 0.21, 95% confidence interval [CI] [-0.27, -0.15]; kidney: eµd 0.26, 95% CI [-0.40, -0.12]. After 4 hours of BD, alanine production decreased in the kidney (eµd 0.14, 95% CI [0.03, 0.25], P < .05). Hepatic lactate and alanine profiles were significantly different throughout the experiment between groups (P < .01). During IPK perfusion, renal glucose oxidation was reduced following BD vs sham animals (eµd 0.012, 95% CI [0.004, 0.03], P < .001). No differences in enzyme activities were found. Renal gene expression of lactate-transporter MCT4 increased following BD (P < .01). In conclusion, metabolic processes during BD can be visualized in vivo using hyperpolarized magnetic resonance imaging and with glucose oxidation during ex vivo renal machine perfusion. These techniques can detect differences in the metabolic profiles of the liver and kidney following BD.

Keywords: animal models; basic (laboratory) research/science; donors and donation: donation after brain death (DBD); graft survival; kidney (allograft) function/dysfunction; kidney transplantation/nephrology; liver allograft function/dysfunction; liver transplantation/hepatology; organ procurement and allocation; translational research/science.


Figures

FIGURE 1
FIGURE 1
Overview of metabolic changes in the liver and kidney following brain death. All changes depicted in green represent an increase in activity or level, whereas all changes marked in red denote decreased activity or levels. 9 All compounds marked in orange are involved in the metabolization of pyruvate into its metabolites: the pyruvate‐alanine (or Cahill) cycle involving enzyme ALT, the pyruvate‐lactate cycle involving LDH as the last step of glycolysis in the absence of oxygen, pyruvate decarboxylation involving the transformation of pyruvate to acetyl‐CoA involving PDH, and finally the formation of bicarbonate (HCO3) from carbon dioxide (CO2) as an end‐product of the mitochondrial TCA cycle. ALT, alanine aminotransferase; LDH, lactate dehydrogenase; PDH, pyruvate dehydrogenase; TCA, tricarboxylic acid
FIGURE 2
FIGURE 2
Experimental overview, where = −2 marks the beginning of surgery, = −0.5 the beginning of BD induction, T = 0 the beginning of the BD period, and the subsequent hours of the total BD duration. At T = 0, T = 2, and T = 4, hyperpolarized [1‐13C]pyruvate MR spectroscopy was performed following an injection of [1‐13C]pyruvate at each time point. The BD control group was terminated following the first round of MR spectroscopy (shortly after T = 0). BD, brain death; MR, magnetic resonance
FIGURE 3
FIGURE 3
BD reduced hepatic and renal function. Plasma levels of (A) AST, (B) ALT, (C) LDH, (D) urea, and (E) plasma and (F) urine creatinine, determined after 4 h (at T = 4) of experimental time or immediately after BD induction (at T = 0). Results are presented as mean ± SD, n = 8 in the sham and BD (T = 4) group, and n = 6 in the BD (T = 0) group. ALT, alanine transaminase; AST, aspartate transaminase; BD, brain death; LDH, lactate dehydrogenase.
FIGURE 4
FIGURE 4
Pyruvate metabolites in the liver and kidneys of sham and BD animals. The signal of each metabolite—A,D, lactate; B,E, alanine; or C,F, bicarbonate—is represented as the fraction of the sum of the metabolites (lactate + alanine +bicarbonate). Results are presented as the minimum, first quartile, median, third quartile, for each group at each of the different time points, where T = 0 represents the start of the BD period, and T = 2 and T = 4 2 and 4 hours later, n = 8 per group. BD, brain‐dead
FIGURE 5
FIGURE 5
Reduced glucose oxidation following brain death in the isolated perfused kidney. A, Perfusate flow. B, Ultrafiltrate production. C, Intrarenal vascular resistance. D, GFR (creatinine clearance). E, Glucose oxidation rates in the kidney of brain‐dead and sham animals. Results are presented as mean ± SD, n = 6 per group
FIGURE 6
FIGURE 6
No difference in LDH, PDH, and ALT enzyme activities following brain death. Enzyme activities of A,B, LDH; C,D, PDH; and E,F, alanine transaminase (ALT) in the liver and kidney of sham and BD animals, determined after 4 h (in the case of sham and BD animals at T = 4) of experimental time or immediately after BD induction (BD animals at T = 0). Results are presented as mean ± SD, n = 8 in the sham and BD (T = 4) group, and n = 6 in the BD (T = 0) group. ALT, alanine transaminase; BD, brain‐dead; LDH, lactate dehydrogenase; PDH, pyruvate dehydrogenase
FIGURE 7
FIGURE 7
No difference in LDHA, MCT1, and hepatic MCT4 gene expression following BD, yet increased MCT4 expression in the kidney. Gene expression of A,D LDHA; B,E MCT1; and C,F MCT4 in the liver and kidney of sham and brain‐dead animals, determined after 4 h (in the case of sham and brain‐dead animals at T = 4) of experimental time or immediately after BD induction (brain‐dead animals at T = 0). Results are presented as mean ± SD, n = 8. BD, brain death; LDHA, lactate dehydrogenase‐A; MCT1, monocarboxylate transport 1
FIGURE 8
FIGURE 8
Decreased ATP levels in the liver but not the kidneys following BD. A, ATP content in liver and B, kidney tissue determined after 4 h (in the case of sham and brain‐dead animals at T = 4) of experimental time or immediately after BD induction (brain‐dead animals at T = 0). Results are presented as mean ± SD, n = 7 in the sham and BD (T = 4) group, and n = 6 in the BD (T = 0) group. ATP, adenosine triphosphate; BD, brain death
FIGURE 9
FIGURE 9
Increased oxidative stress in plasma but not the kidney following BD. (MDA) in (A) plasma, (B) the kidney determined after 4 h (in the case of sham and brain‐dead animals at T = 4) of experimental time or immediately after BD induction (brain‐dead animals at T = 0), and (C) refers to the gene expression of KIM‐1. Results are presented as mean ± SD, n = 8 in the sham and BD (T = 4) group, and n = 6 in the BD (T = 0) group. BD, brain death; MDA, malondialdehyde

References

    1. Organ Procurement and Transplantation Network . https://optn.transplant.hrsa.gov/. Accessed July 6, 2017.
    1. Eurotransplant . https://www.eurotransplant.org/cms/. Accessed February 20, 2018.
    1. Rudge C, Matesanz R, Delmonico FL, Chapman J. International practices of organ donation. Br J Anaesth. 2012;108(Suppl 1):i48‐i55. - PubMed
    1. Mascia L, Bosma K, Pasero D, et al. Ventilatory and hemodynamic management of potential organ donors: an observational survey. Crit Care Med. 2006;34(2):321‐327. - PubMed
    1. Fitzgerald RD, Hieber C, Schweitzer E, et al. Intraoperative catecholamine release in brain‐dead organ donors is not suppressed by administration of fentanyl. Eur J Anaesthesiol. 2003;20:952‐956. - PubMed

Publication types