. 2020 Jun 1;204(11):2984-2994.
doi: 10.4049/jimmunol.1901091. Epub 2020 Apr 13.

Retinoic Acid Modulates Hyperactive T Cell Responses and Protects Vitamin A-Deficient Mice against Persistent Lymphocytic Choriomeningitis Virus Infection

Affiliations

Retinoic Acid Modulates Hyperactive T Cell Responses and Protects Vitamin A-Deficient Mice against Persistent Lymphocytic Choriomeningitis Virus Infection

Yuejin Liang et al. J Immunol. .

Abstract

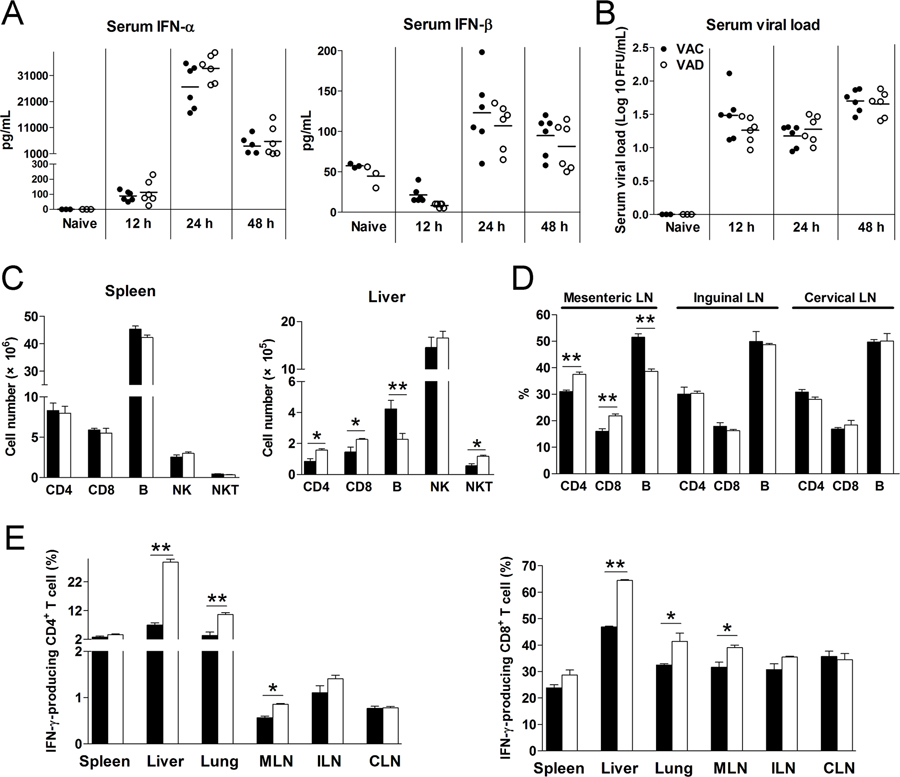
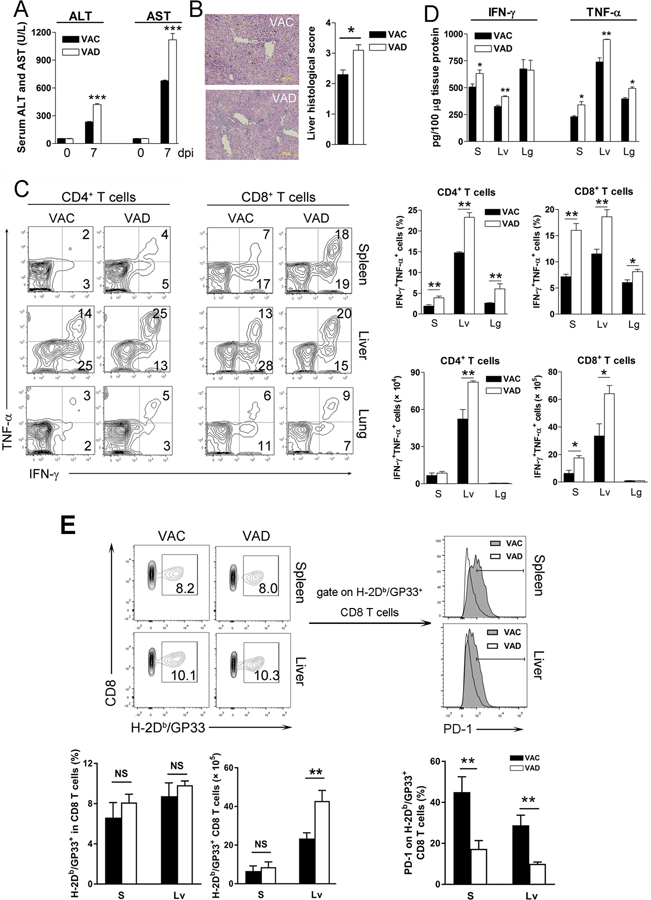
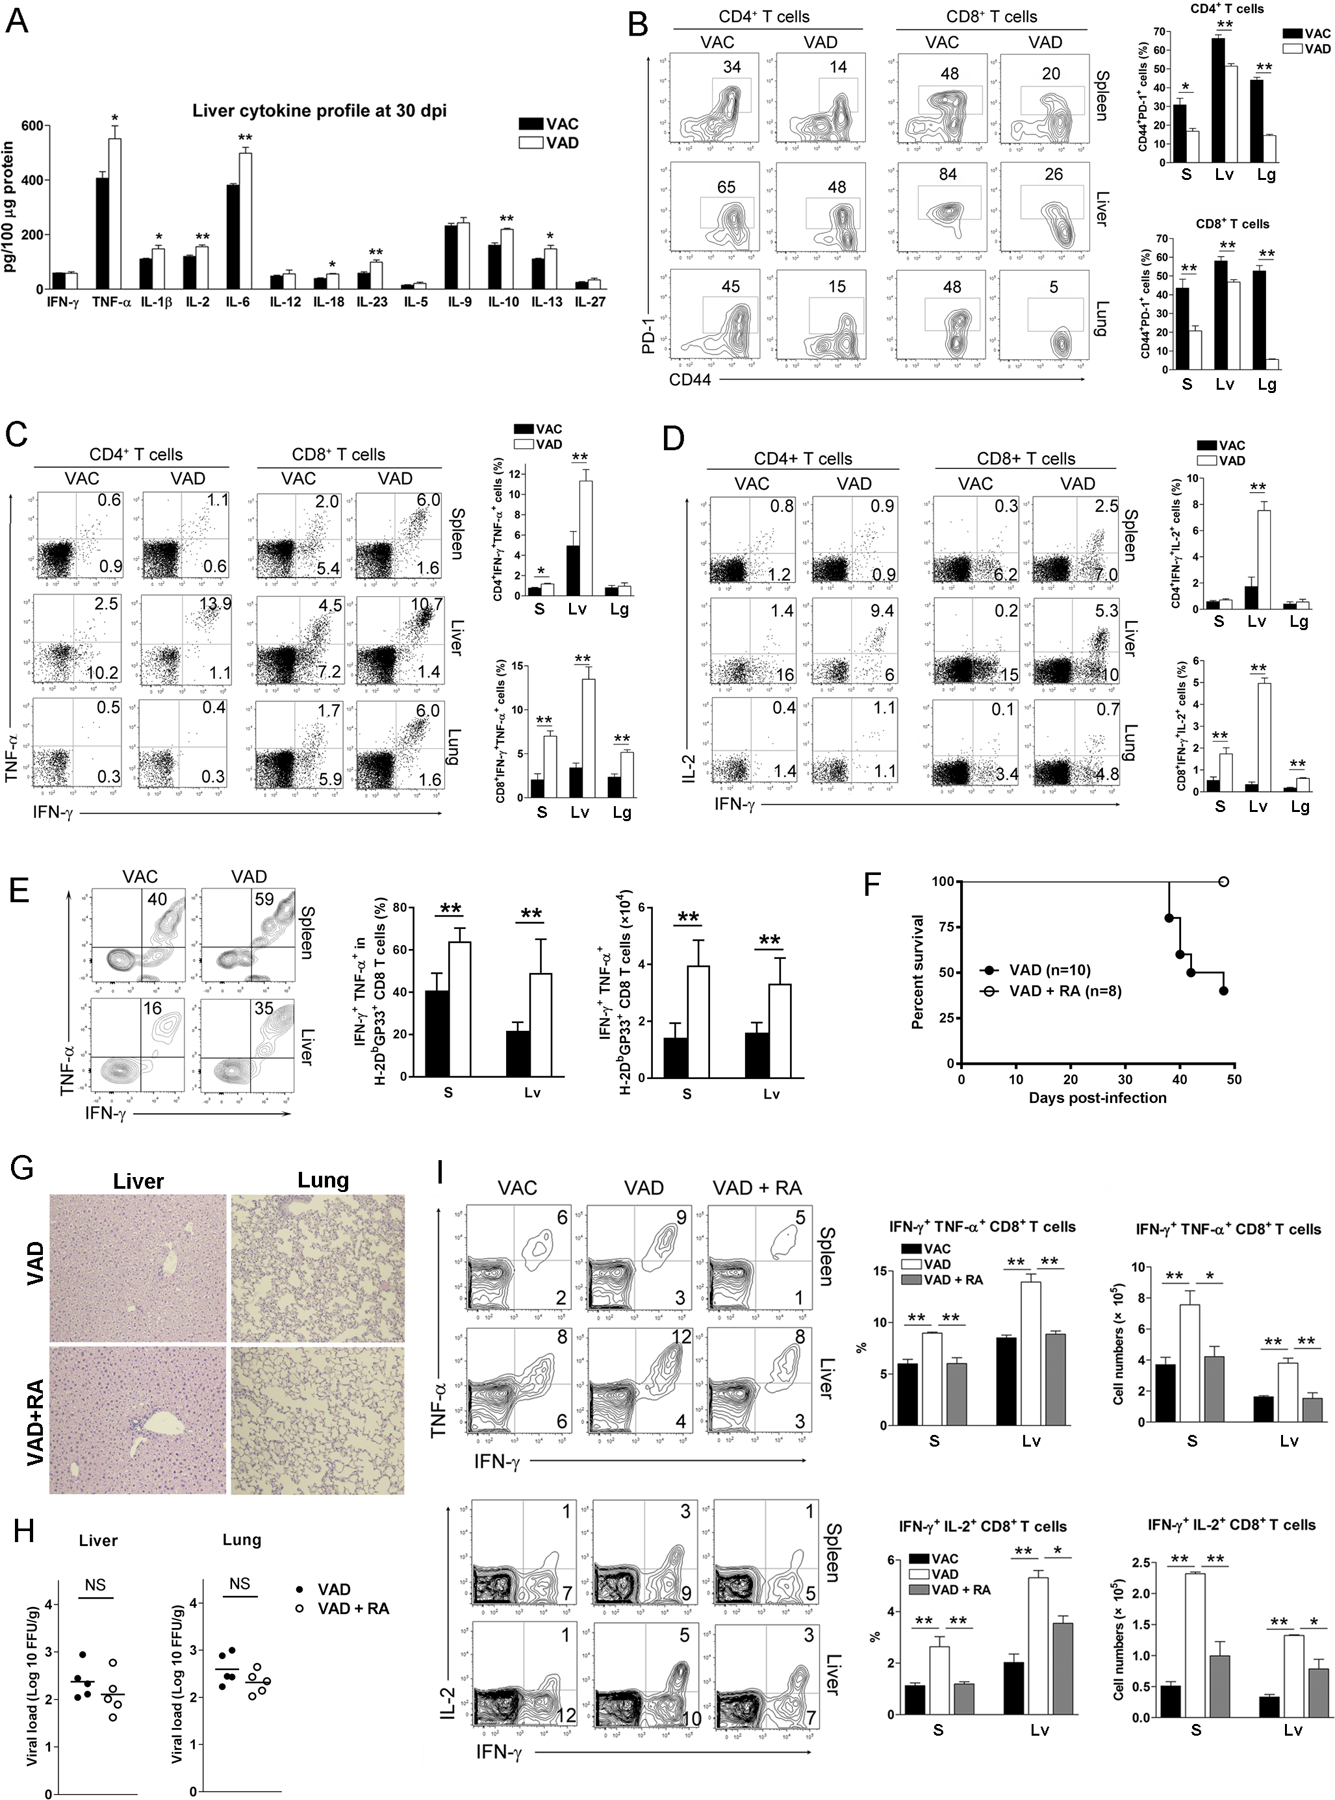
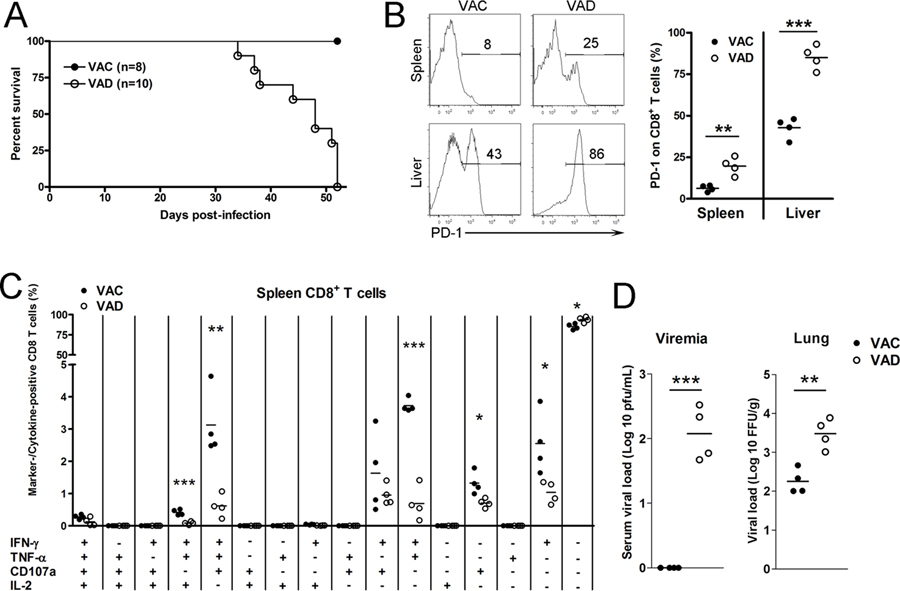
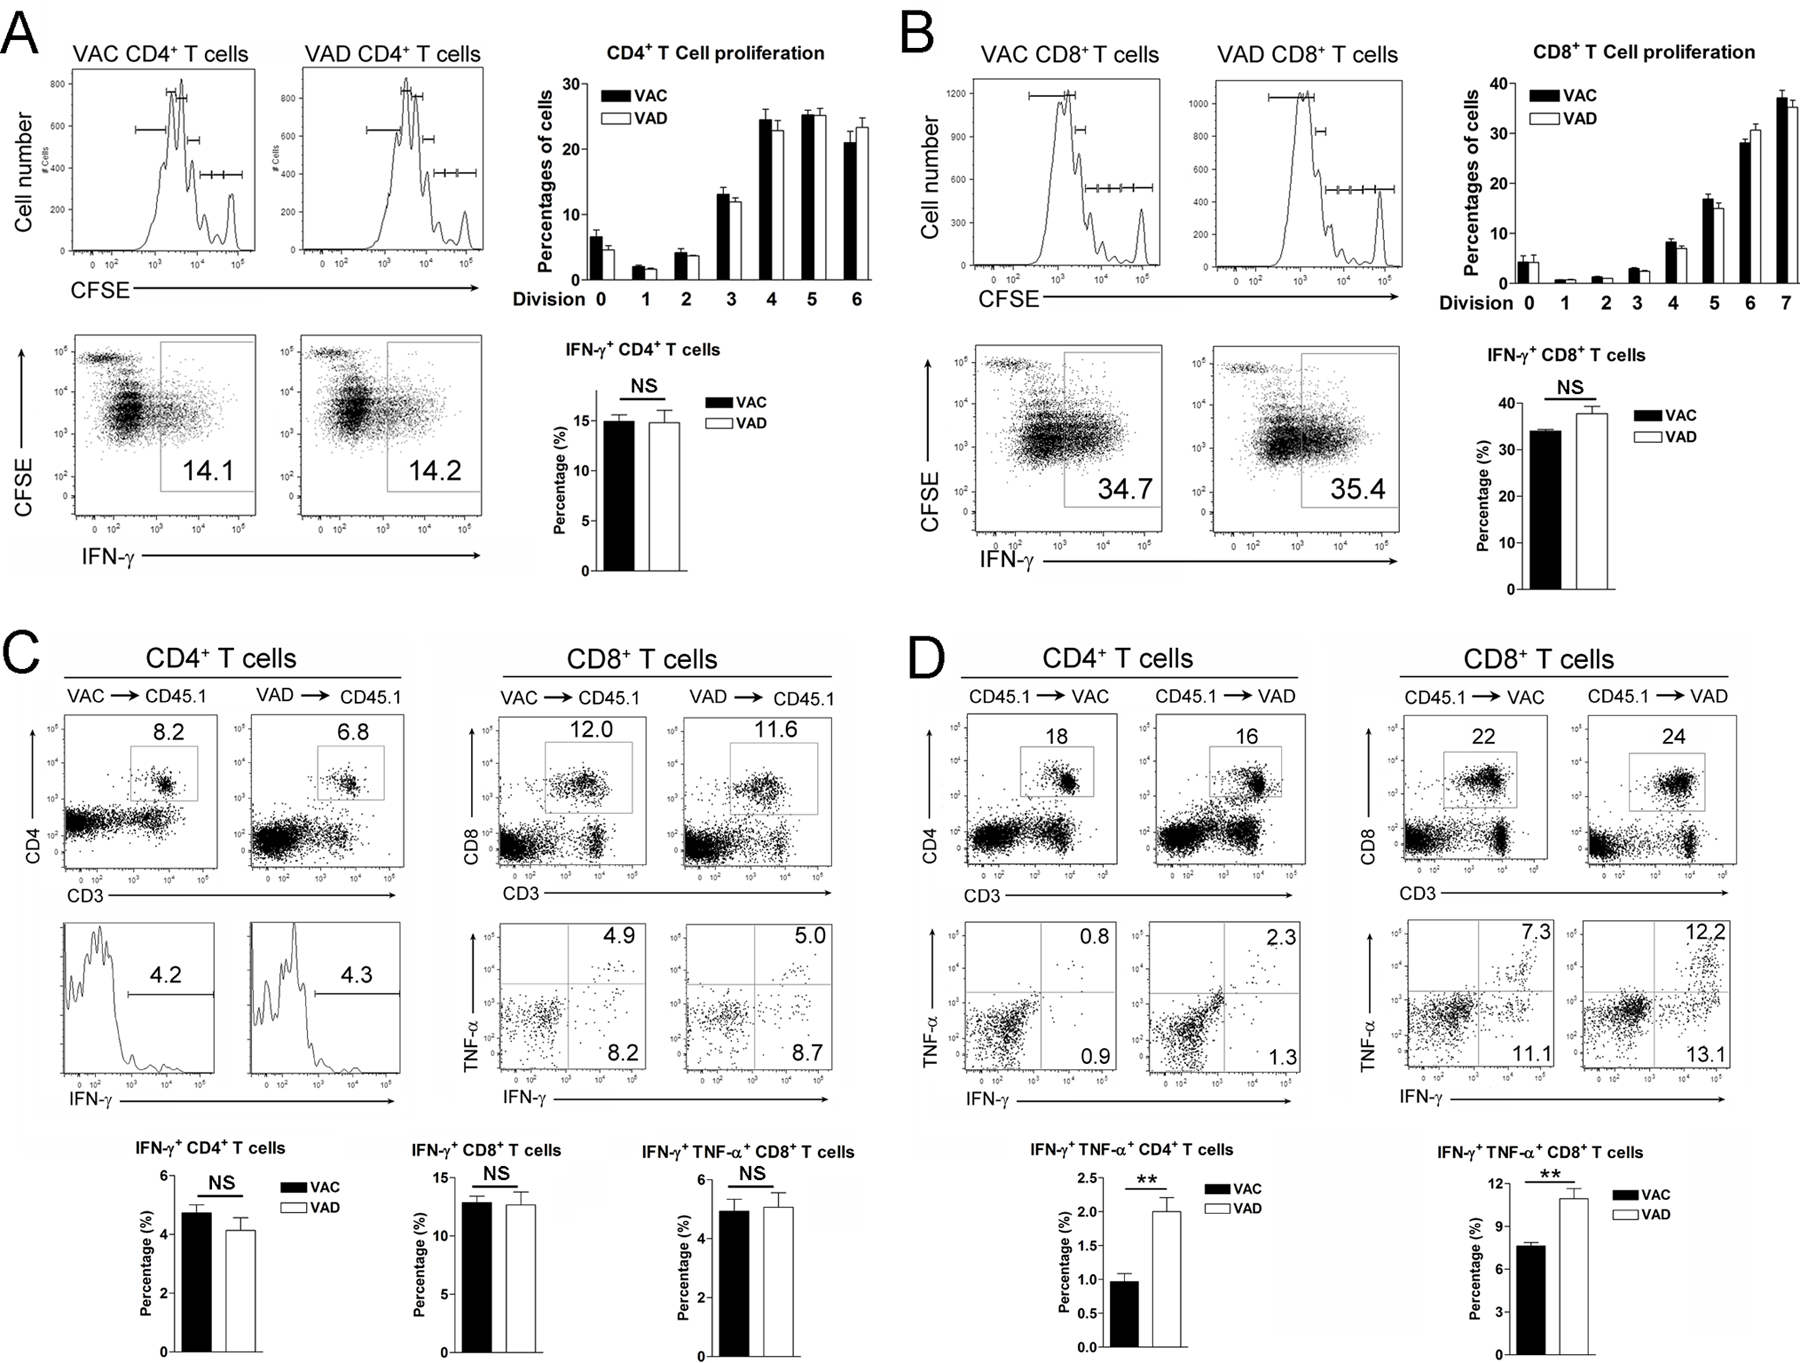
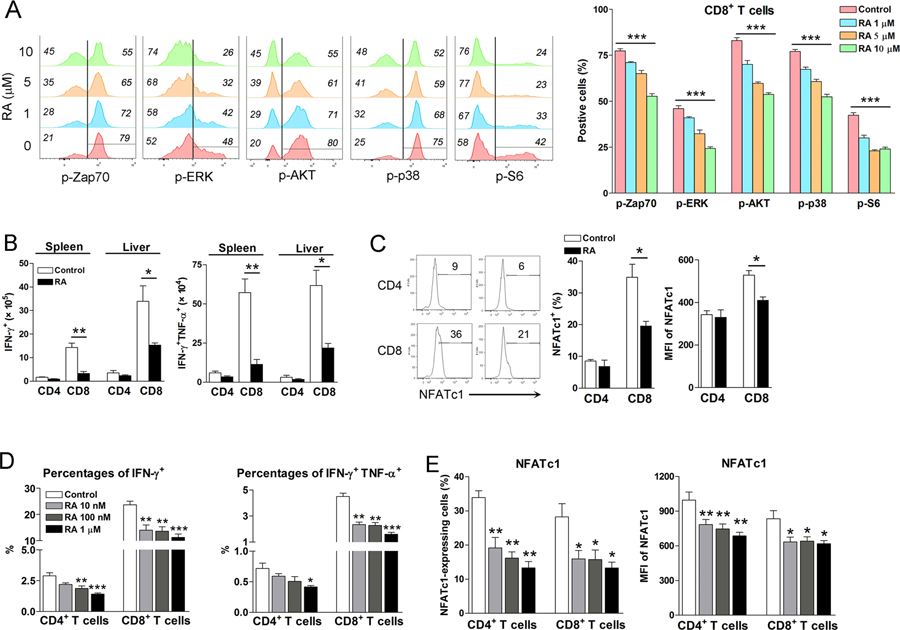
Vitamin A deficiency (VAD) is a major public health problem and is associated with increased host susceptibility to infection; however, how VAD influences viral infection remains unclear. Using a persistent lymphocytic choriomeningitis virus infection model, we showed in this study that although VAD did not alter innate type I IFN production, infected VAD mice had hyperactive, virus-specific T cell responses at both the acute and contraction stages, showing significantly decreased PD-1 but increased cytokine (IFN-γ, TNF-α, and IL-2) expression by T cells. Compared with control mice, VAD mice displayed excessive inflammation and more severe liver pathology, with increased death during persistent infection. Of note, supplements of all-trans retinoic acid (RA), one of the important metabolites of vitamin A, downregulated hyperactive T cell responses and rescued the persistently infected VAD mice. By using adoptive transfer of splenocytes, we found that the environmental vitamin A or its metabolites acted as rheostats modulating antiviral T cells. The analyses of T cell transcriptional factors and signaling pathways revealed the possible mechanisms of RA, as its supplements inhibited the abundance of NFATc1 (NFAT 1), a key regulator for T cell activation. Also, following CD3/CD28 cross-linking stimulation, RA negatively regulated the TCR-proximal signaling in T cells, via decreased phosphorylation of Zap70 and its downstream signals, including phosphorylated AKT, p38, ERK, and S6, respectively. Together, our data reveal VAD-mediated alterations in antiviral T cell responses and highlight the potential utility of RA for modulating excessive immune responses and tissue injury in infectious diseases.


Conflict of interest statement

Disclosures: The authors declare no financial or commercial conflict of interest.

Figures

Figure 1.
Figure 1.. Vitamin A deficiency did not alter type I IFN responses, but increased T cell activation in early LCMV infection.
Vitamin A control (VAC) and vitamin A deficiency (VAD) mice were infected with LCMV Cl13 (2×10⁶ FFU). A-B) Serum IFN-α and IFN-β, as well as viral loads were measured at 12, 24 and 48 hpi. C) Numbers of T cells, B cells, NK cells and NKT cells in spleen and livers at 48 hpi. D) Percentages of T cells and B cells in lymphoid nodes at 48 hpi. E) Lymphocytes were isolated from tissues and stimulated with PMA/Ionomycin in the presence of brefeldin A (BFA) for 4 h, followed by intracellular IFN-γ analysis using flow cytometry. The data are shown as mean ± SEM of three to six mice per group from a single representative experiment. The experiment was repeated three times independently. A two-tailed Student’s t-test was used to compare the two groups. * P<0.05, ** P<0.01.
Figure 2.
Figure 2.. VAD mice exhibited overzealous T cell responses and severe immunopathogenesis at the acute stage of viral infection.
VAC and VAD mice were infected with LCMV Cl13 (2×10⁶ FFU) and sacrificed at 7 dpi. A) Serum ALT and AST. B) Liver histological scores. C) Lymphocytes were isolated from the spleen (S), liver (Lv) and lung (Lg), followed by stimulation with GP33 and GP61 peptides in the presence of BFA for 5 h. Intracellular IFN-γ and TNF-α were analyzed using flow cytometry. D) Liver IFN-γ and TNF-α levels were measured by ELISA kits. E) Virus-specific CD8+ T cells were detected by H-2Db/GP33 MHC tetramer. The PD-1 expression on GP33-tetramer+ CD8+ T cells was measured. The data are shown as mean ± SEM of three to six mice per group from a single representative experiment. The experiment was repeated three times independently. A two-tailed Student’s t-test was used to compare the two groups. A Mann-Whitney test was used to compare the histological scores. * P<0.05, ** P<0.01, *** P<0.001, NS, no significance.
Figure 3.
Figure 3.. RA treatment restored the hyperactive T cell functions of VAD mice at the contraction stage of viral infection.
VAC and VAD mice were infected with LCMV Cl13 (2×10⁶ FFU). A) Liver cytokine profile at 30 dpi. B-D) Lymphocytes were isolated from the spleen (S), liver (Lv) and lung (Lg), and stimulated with GP33 and GP61 peptides in the presence of BFA for 5 h. Percentages of CD44+PD-1+ T cells, IFN-γ+TNF-α+ T cells and IFN-γ+IL-2+ T cells were analyzed using flow cytometry. E) The H-2Db/GP33 MHC tetramer+ CD8+ T cells were gated first, followed by analysis of IFN-γ and TNF-α expression. F) Infected VAD mice treated with RA (25 μg/daily) starting from 12 dpi through 42 dpi. Animal survival rates were recorded. G) H&E staining and H) viral loads of liver and lungs at 30 dpi. I) Percentages of IFN-γ+TNF-α+ CD8+ T cells and IFN-γ+IL-2+ CD8+ T cells were measured in the spleen and livers at 30 dpi. The data are shown as mean ± SEM of at least six mice per group from a single representative experiment. The experiment was repeated three times independently. A two-tailed Student’s t-test was used to compare the two groups. * P<0.05, ** P<0.01, *** P<0.001, NS, no significance.
Figure 4.
Figure 4.. VAD mice exhibited T cell exhaustion and died in the persistent viral infection.
VAC and VAD mice were infected with LCMV Cl13 (2×10⁶ FFU). A) Survival rates. B) Expression of PD-1 on CD8+ T cells. C) Multifunctional CTLs in the spleens. D) Viremia and lung viral loads at 48 dpi. The data are shown as mean ± SEM of four mice per group from a single representative experiment in B-D panels. The experiment was repeated twice independently. A two-tailed Student’s t-test was used to compare the two groups. * P<0.05, ** P<0.01, *** P<0.001.
Figure 5.
Figure 5.. VAD affected T cell functionality in the periphery in viral infection.
A) Naïve CD44CD4+ and B) CD44CD8+ T cells were purified from spleens of naïve mice. Cells were labeled with CFSE and cultured in vitro for 4 days with the anti-CD3/CD28 antibody stimulation. At last 5 h before harvest, PMA/Ionomycin and Brefeldin A were added into the culture system. Cell proliferation and intracellular IFN-γ expression were measured by flow cytometry. C) Splenocytes were isolated from VAC and VAD mice, followed by adoptively transferring into CD45.1 transgenic mice. D) Splenocytes were isolated from naïve CD45.1 transgenic mice, followed by adoptively transferring into VAC and VAD mice. These recipient mice were infected with LCMV and sacrificed at 6 dpi. The adoptive transferred cells were gated first, and the percentages of cytokine-producing T cells were analyzed by flow cytometry. The data are shown as mean ± SEM of three mice per group from a single representative experiment. The experiment was repeated three times independently. A two-tailed Student’s t-test was used to compare the two groups. ** P<0.01, NS, no significance.
Figure 6.
Figure 6.. RA inhibited T cell receptor signaling and NFATc1 expression in T cells.
A) Naïve splenocytes were isolated and cultured with RA in vitro for 24 h, followed by the stimulation with anti-CD3 plus anti-CD28 using an antibody- cross-linking method. Cells were fixed immediately by BD Phosflow Lyse/Fix Buffer at 37 °C for 12 mins and permeabilized by BD Phosflow Perm Buffer III on ice for 30 mins. Cells were then incubated with surface antibodies and phosphorylated antibodies for 1 h, followed by flow cytometry analysis. Each group was in triplicates. B) LCMV-infected mice were treated with RA (200 μg/day) at 1, 3, and 5 dpi. The numbers of cytokine-producing T cells and C) the percentages and mean fluorescence intensity (MFI) of NFATc1 were examined at 7 dpi. D-E) Splenocytes of naïve mice were cultured in vitro by anti-CD3/CD28 antibody stimulation in the presence of various concentrations of RA. After 3-day culture, cytokine levels and NFATc1 expression were analyzed by flow cytometry. Each group was in triplicates and the RA treated groups were compared to the control group. All experiments were repeated two to three times independently. A two-tailed Student’s t-test was used to compare the two groups. One-way ANOVA was used to compare more than two groups. * P<0.05, ** P<0.01, *** P<0.001.

References

    1. Villamor E, and Fawzi WW 2005. Effects of vitamin a supplementation on immune responses and correlation with clinical outcomes. Clin Microbiol Rev 18:446–464. - PMC - PubMed
    1. Stevens GA, Bennett JE, Hennocq Q, Lu Y, De-Regil LM, Rogers L, Danaei G, Li G, White RA, Flaxman SR, Oehrle SP, Finucane MM, Guerrero R, Bhutta ZA, Then-Paulino A, Fawzi W, Black RE, and Ezzati M 2015. Trends and mortality effects of vitamin A deficiency in children in 138 low-income and middle-income countries between 1991 and 2013: a pooled analysis of population-based surveys. Lancet Glob Health 3:e528–536. - PubMed
    1. Baum M, Cassetti L, Bonvehi P, Shor-Posner G, Lu Y, and Sauberlich H 1994. Inadequate dietary intake and altered nutrition status in early HIV-1 infection. Nutrition 10:16–20. - PubMed
    1. Semba RD, Caiaffa WT, Graham NM, Cohn S, and Vlahov D 1995. Vitamin A deficiency and wasting as predictors of mortality in human immunodeficiency virus-infected injection drug users. J Infect Dis 171:1196–1202. - PubMed
    1. Peres WA, Chaves GV, Goncalves JC, Ramalho A, and Coelho HS 2011. Vitamin A deficiency in patients with hepatitis C virus-related chronic liver disease. Br J Nutr 106:1724–1731. - PubMed

Publication types