. 2020 Apr 28;117(17):9566-9576.
doi: 10.1073/pnas.1921475117. Epub 2020 Apr 13.

Dynamic coupling of whole-brain neuronal and neurotransmitter systems

Affiliations

Dynamic coupling of whole-brain neuronal and neurotransmitter systems

Morten L Kringelbach et al. Proc Natl Acad Sci U S A. .

Abstract

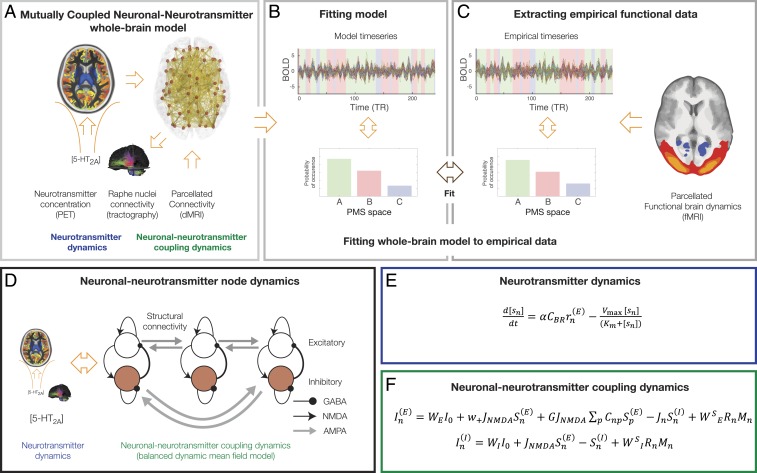
Remarkable progress has come from whole-brain models linking anatomy and function. Paradoxically, it is not clear how a neuronal dynamical system running in the fixed human anatomical connectome can give rise to the rich changes in the functional repertoire associated with human brain function, which is impossible to explain through long-term plasticity. Neuromodulation evolved to allow for such flexibility by dynamically updating the effectivity of the fixed anatomical connectivity. Here, we introduce a theoretical framework modeling the dynamical mutual coupling between the neuronal and neurotransmitter systems. We demonstrate that this framework is crucial to advance our understanding of whole-brain dynamics by bidirectional coupling of the two systems through combining multimodal neuroimaging data (diffusion magnetic resonance imaging [dMRI], functional magnetic resonance imaging [fMRI], and positron electron tomography [PET]) to explain the functional effects of specific serotoninergic receptor (5-HT2AR) stimulation with psilocybin in healthy humans. This advance provides an understanding of why psilocybin is showing considerable promise as a therapeutic intervention for neuropsychiatric disorders including depression, anxiety, and addiction. Overall, these insights demonstrate that the whole-brain mutual coupling between the neuronal and the neurotransmission systems is essential for understanding the remarkable flexibility of human brain function despite having to rely on fixed anatomical connectivity.

Keywords: PET; neurotransmitter; psilocybin; serotonin; whole-brain modeling.


Conflict of interest statement

The authors declare no competing interest.

Figures

Fig. 1.
Fig. 1.
Overview of the coupled neuronal–neurotransmitter whole-brain model. (A) We studied the mutual coupling of two different mutually coupled dynamical whole-brain systems (neuronal and neurotransmitter). (B) This system is fitted to the empirical neuroimaging data, which is described by probabilistic metastable substate (PMS) space (C), which is extracted from the empirical BOLD data. (D) We achieve this by adding a coupled neurotransmitter system (blue) to modulate and interact with the neuronal system (green), which was modeled using a balanced dynamic mean field model that expresses consistently the time evolution of the ensemble activity of the different neural populations building up the spiking network (24, 25). (E) The neurotransmitter system (blue) is modeled by a set of differential equations describing the dynamics of the neurotransmitter concentration level, which is given by the well-known Michaelis–Menten release-and-reuptake dynamics (Materials and Methods) (–28). (F) The neuronal coupling dynamics (green) is modeled by another set of differential equations describing the spontaneous activity of each single brain region consisting of two pools of excitatory and inhibitory neurons (Materials and Methods). We couple the neurotransmitter and neuronal dynamical systems through the anatomical connectivity between the raphe nucleus and the rest of the brain, estimated using dMRI from the HCP (Materials and Methods). The explicit coupling between the neurotransmitter and the neuronal system is given in Eqs. 1617 (shown here and described in Materials and Methods). As can be clearly seen, the neurotransmitter currents are applied to each region’s excitatory and inhibitory pools of neurons using the effectivity/conductivity parameters (WE and WI, respectively). In each region, the neurotransmitter currents are also scaled by the each region’s receptor density (measured in vivo using PET). The reverse coupling from the neuronal to the neurotransmitter system is given by inserting in the Michaelis–Menten release-and-reuptake equation the neuronal population firing rate of the source brain region of the neurotransmitter spread from the raphe nucleus.
Fig. 2.
Fig. 2.
Computing the probabilistic metastable substate (PMS) space for whole-brain activity. For illustrative purposes in the following, we sketch the full process of computing the PMS space. For all parcellated brain regions of each participant (A), we extract the original BOLD signal (orange line), bandpass filter between 0.02 and 0.1 Hz (blue line), and then use the Hilbert transform to compute the time-varying amplitude A and its phase θ (with real and imaginary components) of the BOLD signal (black dotted lines). The red arrows represent the BOLD phase at each TR, and, as can be seen, much of the original BOLD signal is captured by the BOLD phase, cos(θ). (B) We compute the BOLD phase coherence matrix between brain regions (Lower) and extract its leading eigenvector V1(t) for every timepoint t (Top, colored red and blue according to their sign). (C) Finally, to determine the PMS space, we gather all leading eigenvectors V1(t) for all participants for every time point as a low-resolution representation of the BOLD phase coherence patterns (leftmost panel). We apply a clustering algorithm (k-means), which divides the data into a predefined number of clusters k (here k = 3). Each cluster is represented by a central vector (green, red, and blue), which represents a recurrent pattern of phase coherence, or substate, which occurs with a given probability (rightmost panel). Any given brain state can thus be represented by this PMS space.
Fig. 3.
Fig. 3.
Finding the optimum fit of mutually coupled whole-brain model as a function of excitatory and inhibitory coupling parameters. (A) We computed the three probability metastable substate (PMS) spaces that significantly distinguish the placebo and psilocybin conditions (each shown rendered on the human brain). As shown, substates 1 and 2 are significantly different in terms of probability of occurrence and substate 3 in terms of lifetimes. (B) We first fitted the whole-brain model to the PMS space of the placebo condition using only the neuronal system (and thus without coupling the neurotransmitter system). We then studied the coupled neuronal–neurotransmission whole-brain model (using the same centroids found in the neuroimaging empirical data) and a 2D matrix of coupling parameters WE and WI for generating the modeled PMS spaces. We show the resulting matrices for the symmetrized Kullback–Leibler distance (KLD) and average error distance between the lifetimes of the substates. (C) First, we show the PMS when the neurotransmitter system is disconnected (WES=0 and WIS=0, leftmost orange box). However, the most significantly optimal fit to the empirical PMS (rightmost black panel) is found at WES=0.3 and WIS=0.1 (Middle, red box, P < 10−4).
Fig. 4.
Fig. 4.
Optimal dynamical coupled neuronal–neurotransmission (CNN) whole-brain model is significantly better then alternative models. Further insights into the underlying dynamics of neuromodulation involved in psilocybin were obtained by comparing the Kullback–Leibler distance (KLD) for the PMS and the error lifetimes between the empirical data and the whole-brain model undergoing various manipulations. (A) For the optimal fit of the mutually coupled whole-brain model, we found a very significant difference between the optimal fit and the uncoupled system (i.e., without neuromodulation) (P < 10−6). (B) We also found a significant difference when removing the feedback dynamics (P < 10−6). We tested this by allowing optimal model coupling until steady state, at which point we kept just the average of the neurotransmitter variables while cancelling all feedback dynamics. (C) We found a significant difference between using the empirical 5-HT2A receptor densities across the regions at the optimal fit compared with randomly shuffling the receptor densities (P < 10−4). This demonstrates the causal importance of the 5-HT2A receptor densities.
Fig. 5.
Fig. 5.
Optimality of mutually coupled neuronal–neurotransmission (CNN) whole-brain model causally depends on the 5-HT2A receptor map. (A) We studied the effect of replacing the 5-HT2A receptor map with other serotonin receptor binding maps and 5-HTT. (B) The results show significant differences at the optimal fit of the impact of 5-HT2A receptor compared with the other serotonin receptors: 5-HT1A (P < 10−6), 5-HT1B (P < 10−6), and 5-HT4 (P < 10−6). (C) We also found a significant difference when comparing with 5-HTT (P < 0.02 for KLD, but not significant for error lifetimes).

Comment in

References

    1. Sporns O., Tononi G., Kötter R., The human connectome: A structural description of the human brain. PLoS Comput. Biol. 1, e42 (2005). - PMC - PubMed
    1. Atasoy S., Donnelly I., Pearson J., Human brain networks function in connectome-specific harmonic waves. Nat. Commun. 7, 10340 (2016). - PMC - PubMed
    1. Deco G., Cruzat J., Kringelbach M. L., Brain songs framework used for discovering the relevant timescale of the human brain. Nat. Commun. 10, 583 (2019). - PMC - PubMed
    1. Sporns O., Network attributes for segregation and integration in the human brain. Curr. Opin. Neurobiol. 23, 162–171 (2013). - PubMed
    1. Deco G., Tononi G., Boly M., Kringelbach M. L., Rethinking segregation and integration: Contributions of whole-brain modelling. Nat. Rev. Neurosci. 16, 430–439 (2015). - PubMed

Publication types

Substances