. 2020 Jul;5(7):929-942.
doi: 10.1038/s41564-020-0701-5. Epub 2020 Apr 13.

Oxysterols provide innate immunity to bacterial infection by mobilizing cell surface accessible cholesterol

Affiliations

Oxysterols provide innate immunity to bacterial infection by mobilizing cell surface accessible cholesterol

Michael E Abrams et al. Nat Microbiol. 2020 Jul.

Abstract

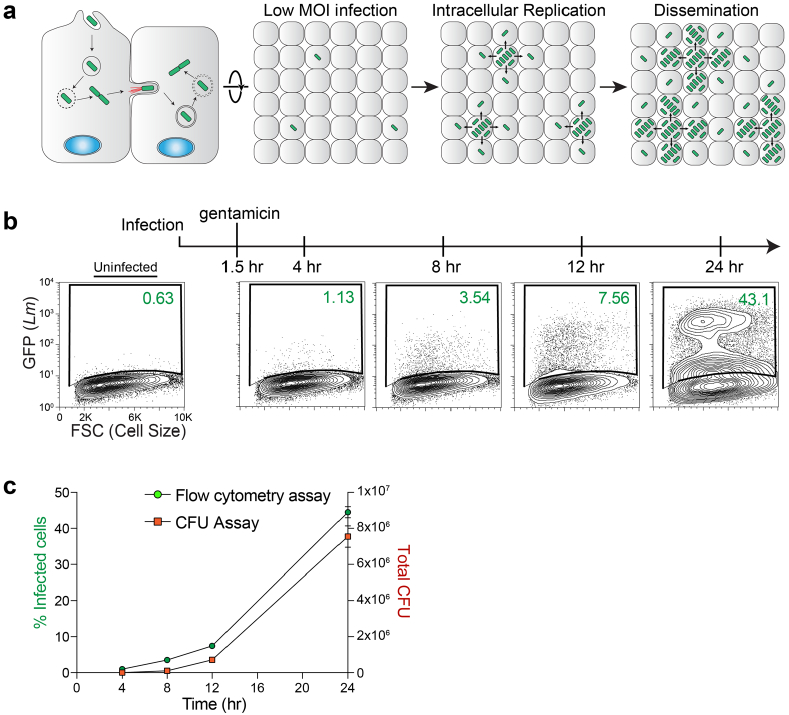
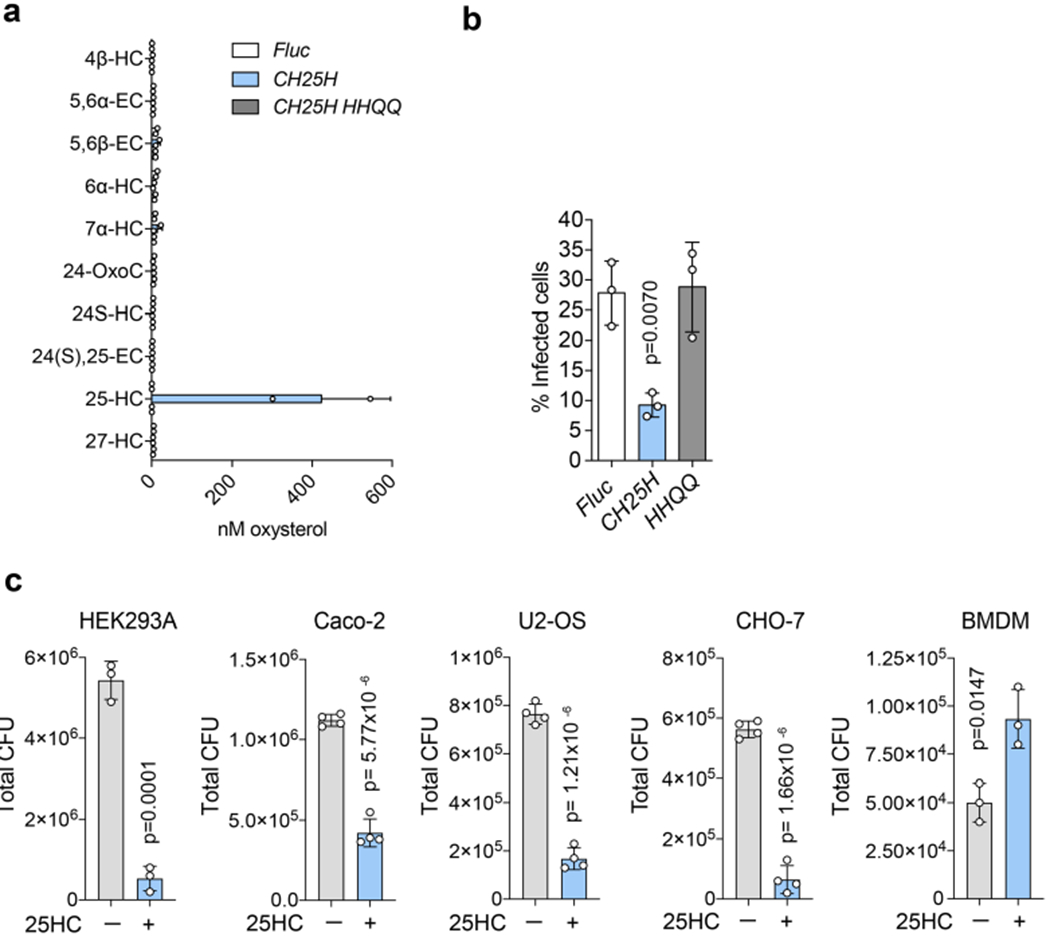
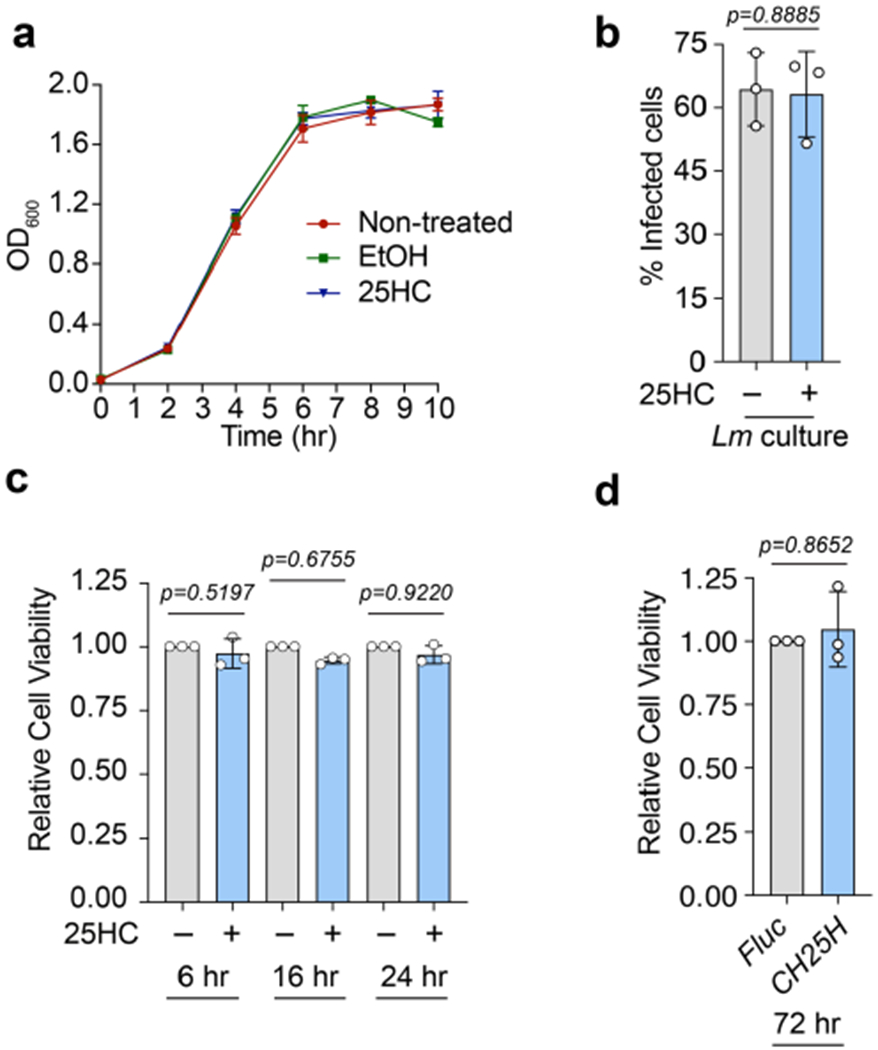
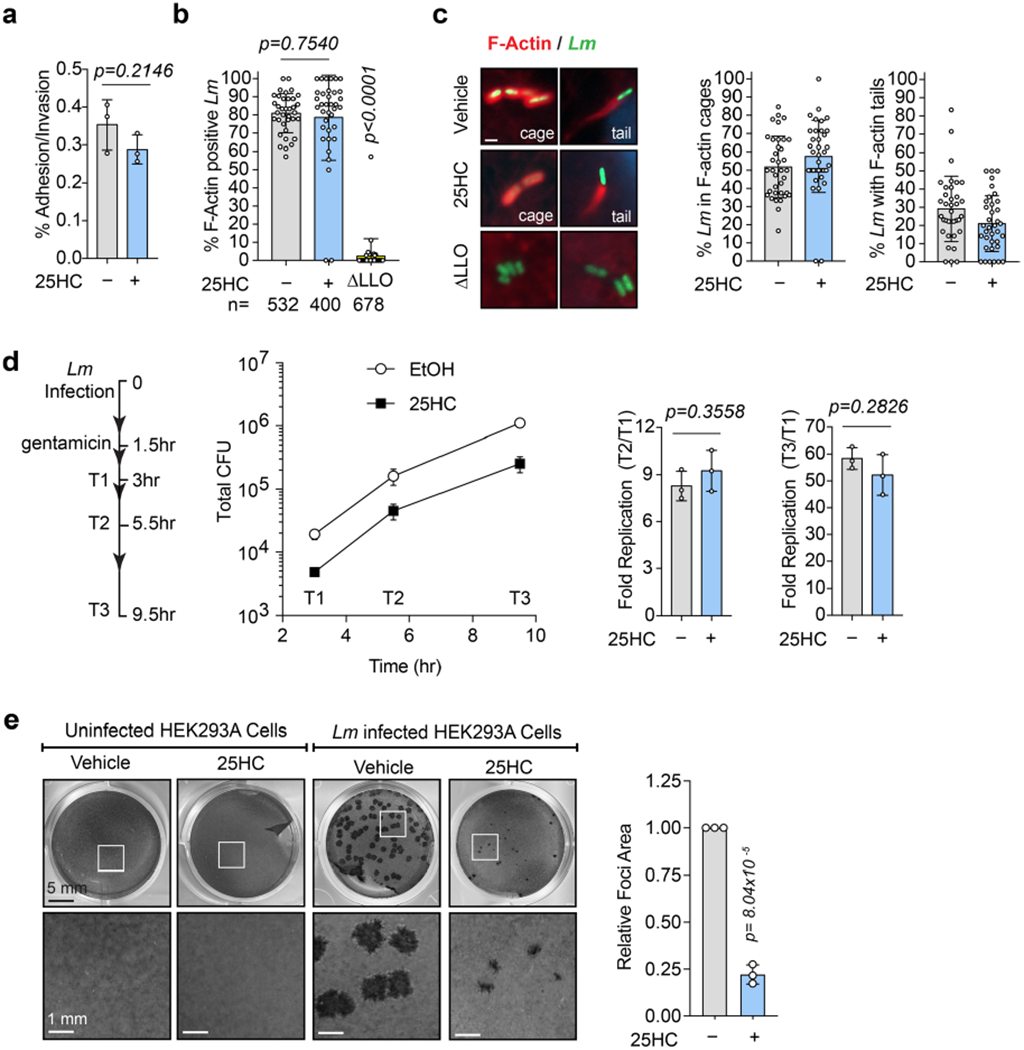
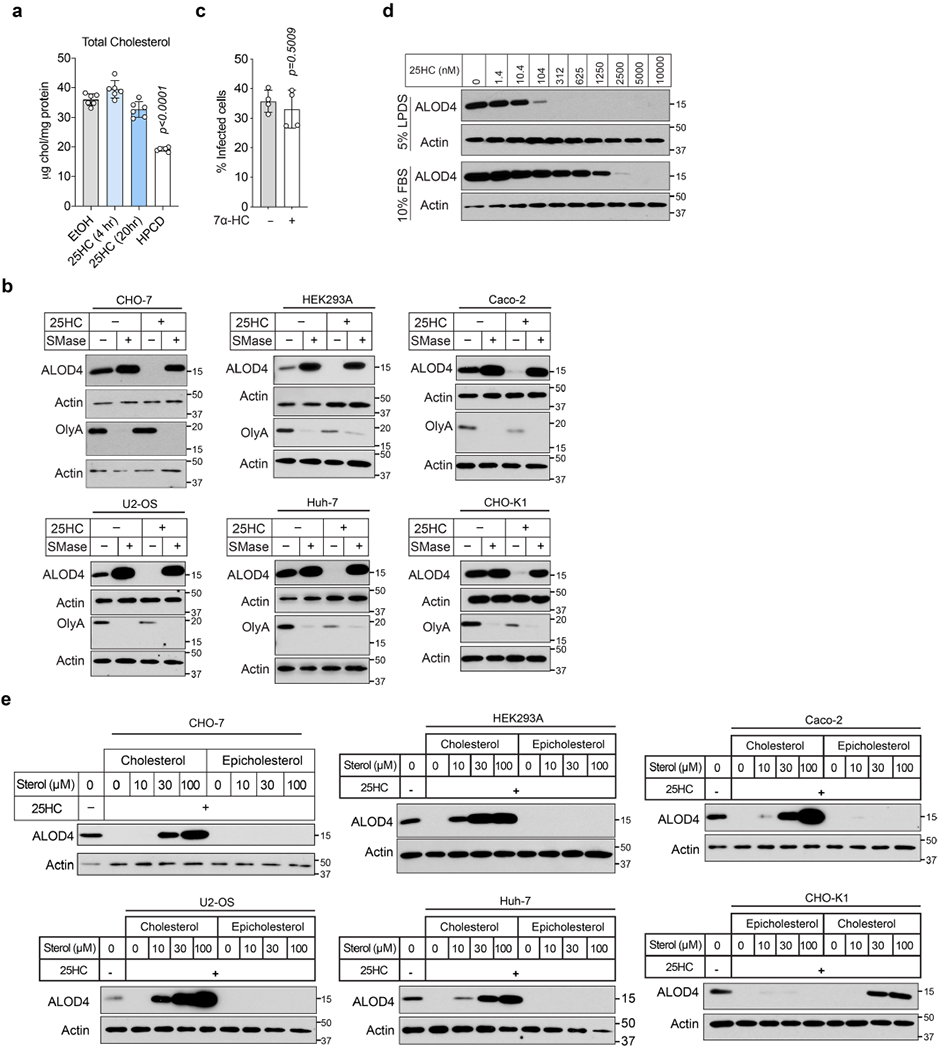
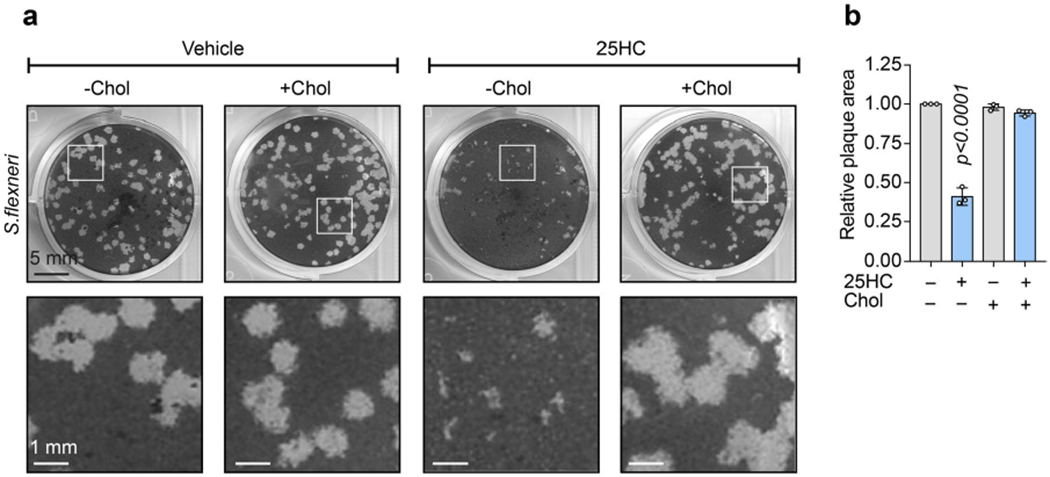
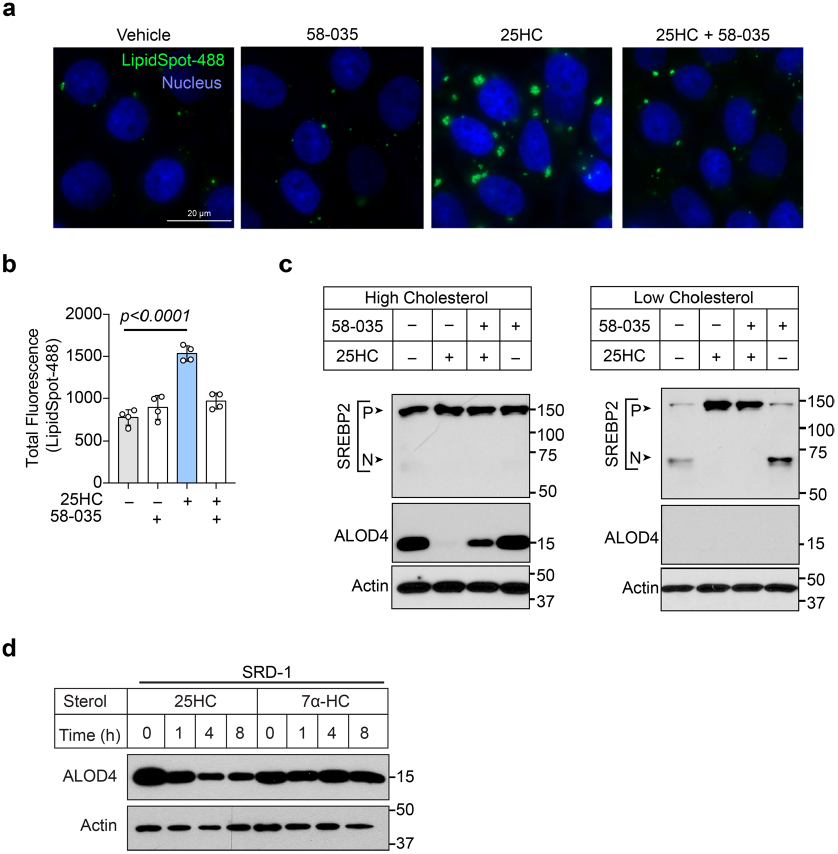
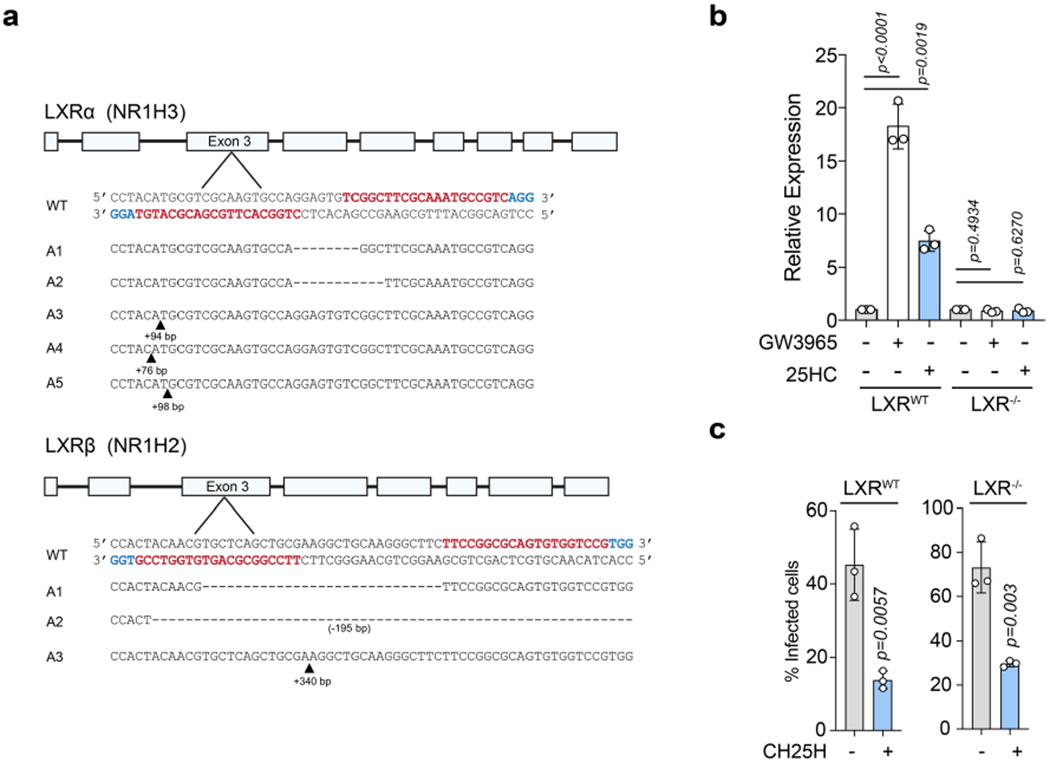
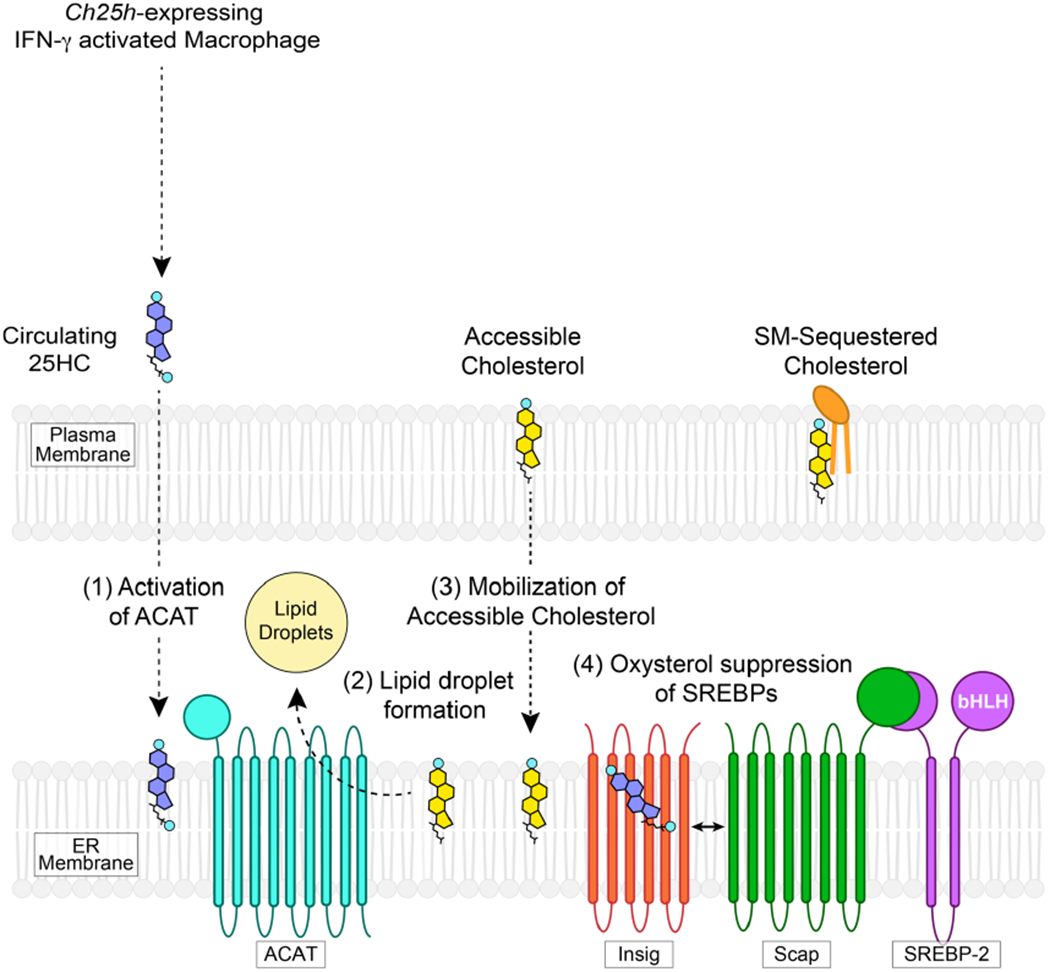
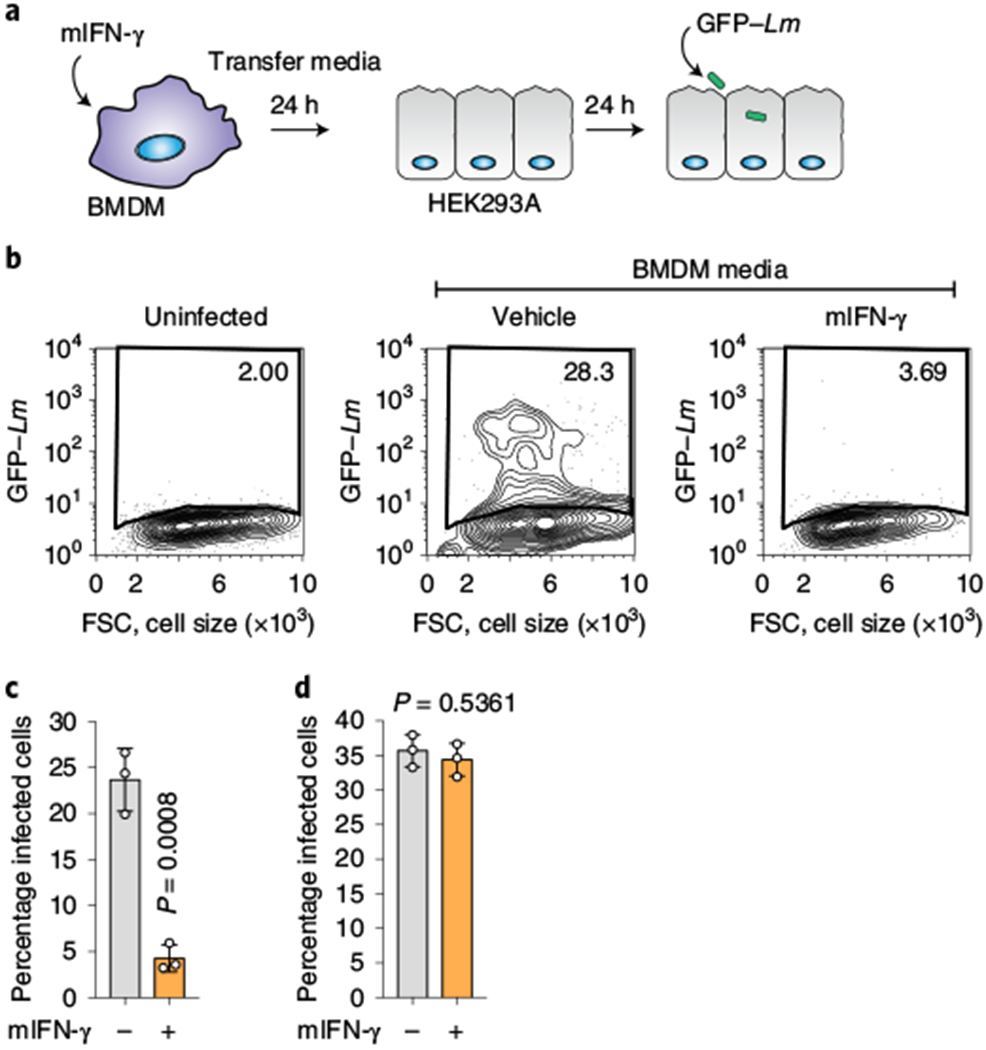
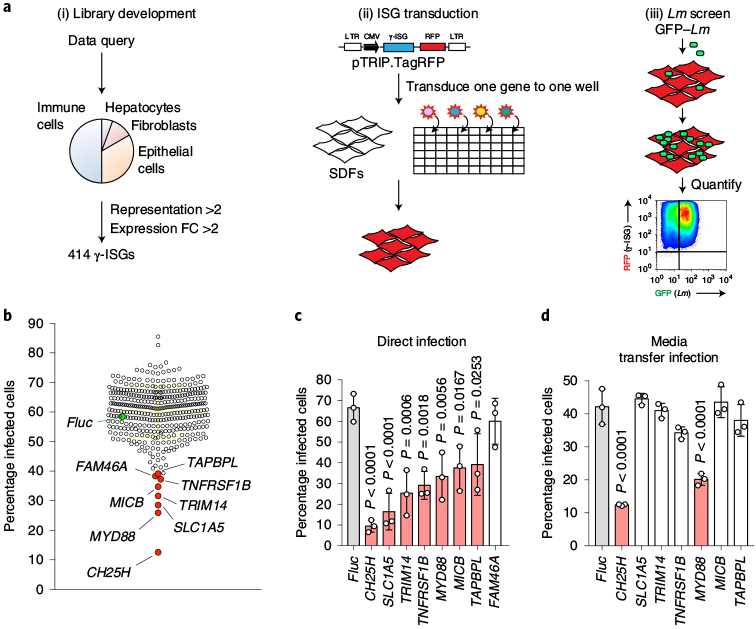
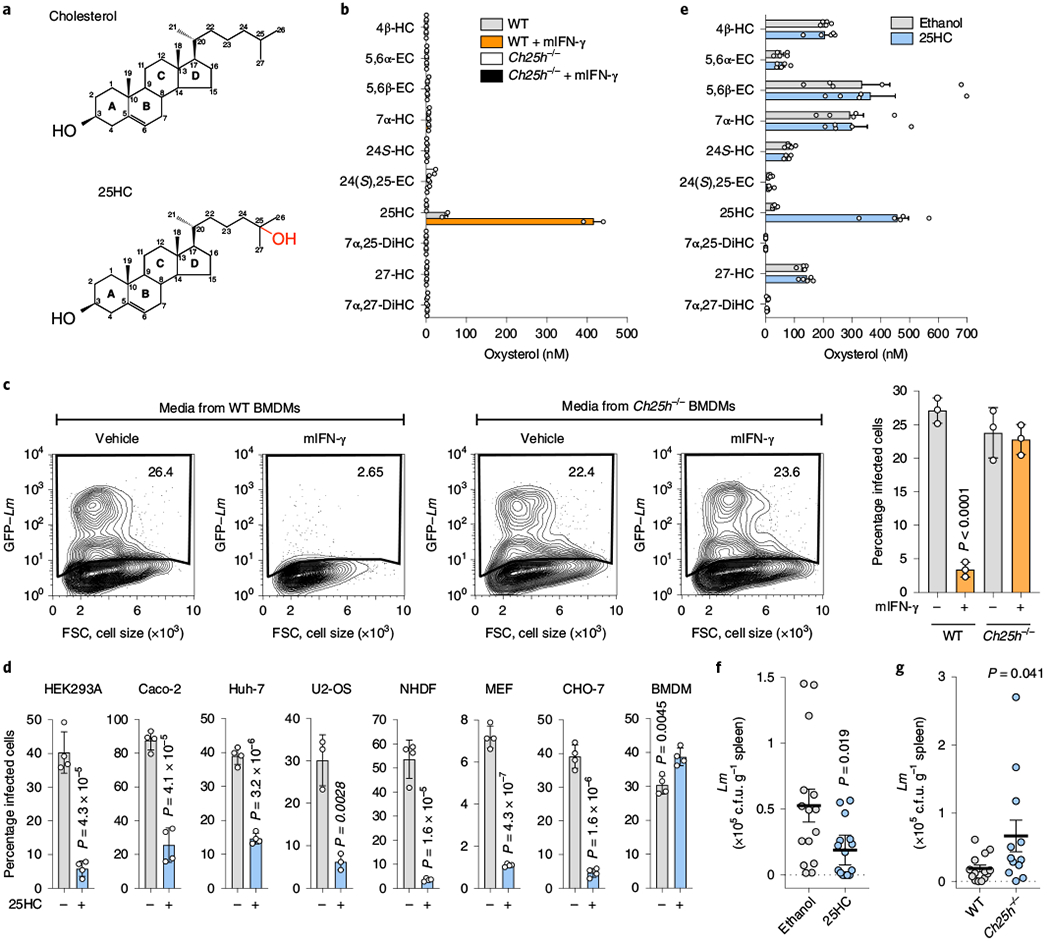
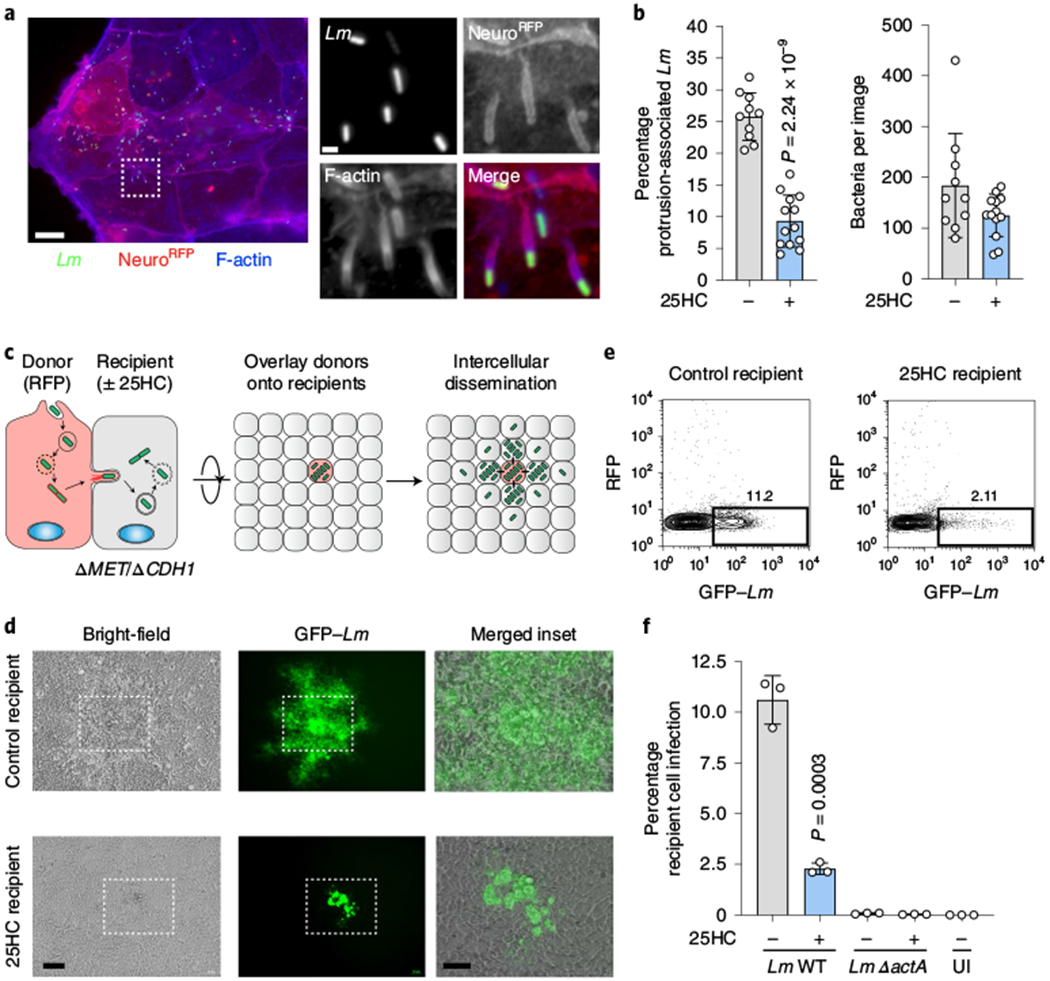
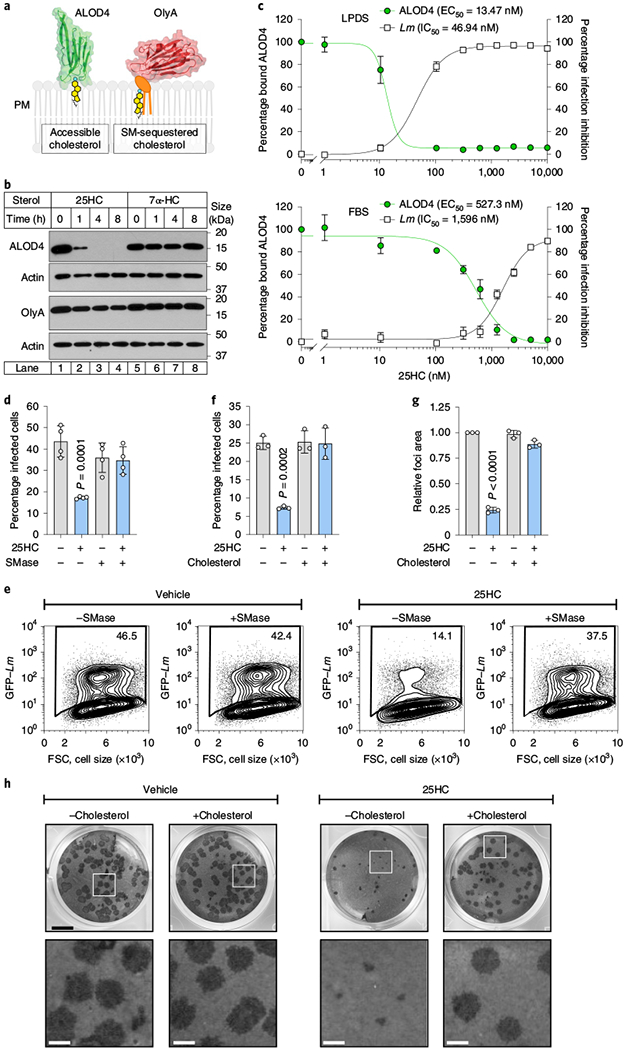
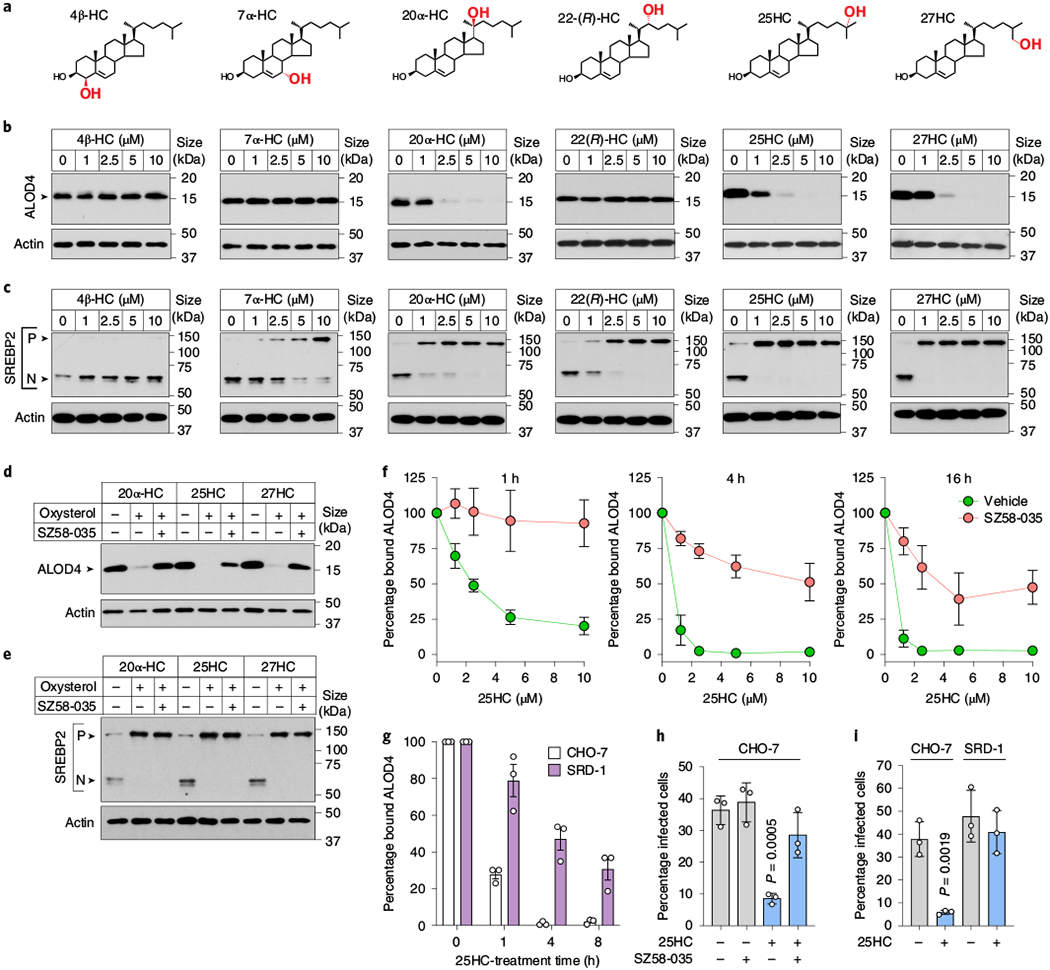
Cholesterol 25-hydroxylase (CH25H) is an interferon-stimulated gene that converts cholesterol to the oxysterol 25-hydroxycholesterol (25HC). Circulating 25HC modulates essential immunological processes including antiviral immunity, inflammasome activation and antibody class switching; and dysregulation of CH25H may contribute to chronic inflammatory disease and cancer. Although 25HC is a potent regulator of cholesterol storage, uptake, efflux and biosynthesis, how these metabolic activities reprogram the immunological state of target cells remains poorly understood. Here, we used recently designed toxin-based biosensors that discriminate between distinct pools of plasma membrane cholesterol to elucidate how 25HC prevents Listeria monocytogenes from traversing the plasma membrane of infected host cells. The 25HC-mediated activation of acyl-CoA:cholesterol acyltransferase (ACAT) triggered rapid internalization of a biochemically defined fraction of cholesterol, termed 'accessible' cholesterol, from the plasma membrane while having little effect on cholesterol in complexes with sphingomyelin. We show that evolutionarily distinct bacterial species, L. monocytogenes and Shigella flexneri, exploit the accessible pool of cholesterol for infection and that acute mobilization of this pool by oxysterols confers immunity to these pathogens. The significance of this signal-mediated membrane remodelling pathway probably extends beyond host defence systems, as several other biologically active oxysterols also mobilize accessible cholesterol through an ACAT-dependent mechanism.


Conflict of interest statement

Competing interests

The authors declare no competing interests.

Figures

Extended Data Fig. 1 |
Extended Data Fig. 1 |. Comparison between flow cytometry and CFUs for L. monocytogenes infection.
a, Schematic of the L. monocytogenes life-cycle (left) and its replication and intercellular dissemination initiated from a low dose of bacterial infection. HEK293A cells were infected with GFP-expressing L. monocytogenes (MOI=1) so that only a small percentage of the host cell monolayer (<1%) are initially infected. Cell-to-cell spread of L. monocytogenes results in robust infection of the monolayer over time. b, Representative flow cytometry plots of L. monocytogenes (GFP) infection of HEK293A cells at the indicated time points. After 90 minutes of infection, the host cell monolayers were washed and incubated with gentamicin to remove and kill extracellular bacteria. These studies were repeated independently four times with similar results. c, Direct comparison between gentamicin protection assays assessed by flow cytometry (as above) or Colony forming Units (CFUs). Samples were harvested for analysis at the indicated time points after infection. Graph showing the percent of infected cells determined by flow cytometry (y-axis, left) were directly compared to CFUs recovered (y-axis, right). Mean values from 4 independent experiments are plotted, and error bars show s.d. We concluded that flow cytometry is an accurate method of enumerating bacterial burden in host cells.
Extended Data Fig. 2 |
Extended Data Fig. 2 |. CH25H inhibits L. monocytogenes through 25HC production.
a, Oxysterol measurements in media collected from SDFs transduced with lentivirus encoding Fluc, CH25H, or a catalytically inactive CH25H mutant with the following mutations: H242H243/Q242Q243. Following 48 hours transduction, the concentration of oxysterols secreted into the media was measured by mass spectrometry. Bars represent mean values. Error bars show s.d. from two independent experiments. See Methods for oxysterol nomenclature. b, To determine if CH25H catalytic activity is necessary for its antibacterial function, HEK293A cells were transduced with lentivirus as in (a), infected with GFP-expressing L. monocytogenes (MOI=10) for 6 hours, and analysed by flow cytometry. Bars represent mean values. Error bars show s.d. from three independent experiments and statistical significance was determined by one-way ANOVA compared to Fluc with Dunnet’s correction. c, Bar graph showing the total L. monocytogenes CFUs recovered from gentamicin protection assays performed on the indicated cell lines treated with vehicle (EtOH) or 25HC (5 μM). The specified cell lines were set up, treated, and infected as in Fig. 3d, and CFU enumerated by lysing cells and plating serial dilutions. Bars represent mean values. Error bars show s.d. from three or four independent experiments as indicated and statistical significance was determined by student’s unpaired t-test (two-tailed).
Extended Data Fig. 3 |
Extended Data Fig. 3 |. 25HC does not directly affect bacterial infectivity or host viability.
25HC could inhibit L. monocytogenes infection through different mechanisms. For example, it may (1) directly reduce bacterial viability, (2) inhibit the expression or function of bacterial virulence factors, (3) induce host cell death, or (4) regulate host cellular processes that limit bacterial infection. a, To determine whether 25HC directly reduced bacterial viability, a starting bacterial culture was back-diluted in DMEM (10% FBS) supplemented with vehicle (EtOH) or 25HC (5 μM). Bacterial cultures were incubated at 37°C while shaking at 200 rpm, and OD600 was measured for each sample at the indicated time points. Mean values from 3 independent experiments are plotted, and error bars show s.d. b, To determine whether 25HC directly modifies bacterial virulence, GFP-expressing L. monocytogenes were cultured overnight in BHI supplemented with vehicle (EtOH) or 25HC (5 μM) and HEK293A cells were then infected with bacteria from either culture (MOI = 20, 6 hours). Infection was analysed by flow cytometry. Bars represent mean values. Error bars show s.d. from three independent experiments and statistical significance was determined by student’s unpaired t-test (two-tailed). c-d, Host cell viability was assessed in cells treated with 25HC (c) or in cells virally transduced with CH25H (d). HEK293A cells were treated with 25HC (5 μM) or vehicle (EtOH) for 6, 16, or 24 hours (c) or transduced with Fluc or CH25H for 72 hours (d). Cell viability was evaluated by measuring ATP production using CellTiter-Glo assays. Data are normalized to vehicle (EtOH) in (c), and Fluc in (d). Bars represent mean values. Error bars show s.d. from three independent experiments and statistical significance was determined before normalization by student’s unpaired t-test (two-tailed).
Extended Data Fig. 4 |
Extended Data Fig. 4 |. 25HC has little effect on the early life-cycle stages of L. monocytogenes.
a, 25HC does not inhibit L. monocytogenes adhesion/invasion. The percent adhesion/invasion is shown. Bars represent mean values. Error bars show s.d. from three independent experiments and statistical significance was determined by student’s unpaired t-test (two-tailed). b, 25HC does not inhibit L. monocytogenes vacuole escape. The number of internalized bacteria that escape the phagocytic vacuole was determined by quantifying percent cytosolic L. monocytogenes that polymerize actin (F-actin cages or tails). L. monocytogenes lacking LLO was used as an escape-deficient control. Each data point represents the percent of bacteria that nucleate F-actin per field of view. The total number of individual bacteria assessed for F-actin nucleation is also indicated. Bars represent mean values. Error bars show s.d. and statistical significance was determined by student’s unpaired t-test (two-tailed). c, 25HC does not inhibit L. monocytogenes actin polymerization. Images (left) of GFP-expressing L. monocytogenes (green) and F-actin structures associated with cytosolic bacteria (phalloidin, red). Nuclei were labelled with DAPI (blue). Scale bar, 1 μm. Graph shows the frequency of F-actin structures nucleated by bacteria in host cells treated with vehicle or 25HC (5 μM). These data were collected from the experiments performed in (b). Bars represent mean values, and error bars are s.d. d, 25HC does not inhibit L. monocytogenes replication in host cells. Schematic indicating the time points of sample collection after bacterial infection. The total CFU recovered at each time point is shown (line graph). Bacterial replication was determined by calculating the ratio of CFU recovered at the indicated time points (T2 or T3) relative to the CFUs recovered after 3 hours of infection (T1). Mean values were plotted (left), and bars (right) represent mean values. Error bars show s.d. from three independent experiments and statistical significance was determined using student’s unpaired t-test (two-tailed). e, Left, representative images of L. monocytogenes cell-to-cell dissemination foci in HEK293A monolayers. Scale bar, 1 mm. Right, graph showing mean dissemination foci area formed by L. monocytogenes. Bars represent mean values. Error bars show s.d. of foci area normalized to vehicle-treated cells from three independent experiments. Statistical significance was determined prior to normalization by student’s unpaired t-test (two-tailed).
Extended Data Fig. 5 |
Extended Data Fig. 5 |. 25HC has no effect on the total cholesterol content of target cells and mobilizes accessible cholesterol in diverse cell types.
a, Total cellular cholesterol measurements of CHO-K1 cells treated for the indicated times with vehicle (EtOH), 25HC (5 μM), or HPCD (1% w/v), normalized to cellular protein content. Bars represent mean values. Error bars show s.d. from six independent experiments and statistical significance was determined by one-way ANOVA compared to vehicle with Dunnet’s correction. b, Immunoblots showing the effects of SMase treatment on cell surface binding of ALOD4 and OlyA in the indicated cell lines. Cells were treated without or with 25HC (5 μM) for 4 hours, followed by treatment with SMase (100 mU/ml) as indicated. Equal aliquots of cell lysates (10% of total) were subjected to immunoblot analysis. Data are representative of three independent experiments. c, CHO-7 cells were treated with 7α-HC (5μM) or vehicle (EtOH) for 16 hours, infected with GFP-expressing L. monocytogenes (MOI=1, 22 hours), and then subjected to flow cytometry analysis. Bars represent mean values. Error bars show s.d. from four independent experiments and statistical significance was determined by student’s unpaired t-test (two-tailed). d, Representative immunoblots from three independent experiments, measured by ALOD4 binding, quantification of which is shown in Fig. 5c. e, Immunoblots showing the effects of exogenously added epicholesterol or cholesterol on cell surface binding of ALOD4 to the indicated 25HC-treated cell lines. Cells were treated with 5 μM 25HC for 4 hours and then incubated with the indicated concentrations of epicholesterol or cholesterol (complexed to MCD) as described in Methods. Equal aliquots of cell lysates (10% of total; or 20 μg/lane for HEK293A) were subjected to ALOD4 immunoblot analysis. Data are representative of three independent experiments.
Extended Data Fig. 6 |
Extended Data Fig. 6 |. 25HC suppresses spread of S. flexneri through mobilization of accessible cholesterol.
a, S. flexneri invades epithelial cells and disseminates from cell-to-cell. However, compared to L. monocytogenes, S. flexneri uses different molecular mechanisms and virulence factors. To test whether 25HC can inhibit S. flexneri by modulating accessible cholesterol, we carried out plaque-forming assays coupled with cholesterol repletion. HEK293A were treated with 25HC (5 μM) or vehicle for 16 hours, then 1 hour prior to S. flexneri infection, cells were treated with Chol/MCD complexes diluted in media (40 μM), or vehicle. Plaques were analysed 72 hours after avicel overlay. Representative images of three independent experiments are shown. Scale bar, 1 mm. b, Plaque area was quantified for assay described in (a), and normalized to vehicle-treated cells. Bars represent mean values. Error bars show s.d. from three independent experiments and statistical significance was determined before normalization by one-way ANOVA compared to vehicle with Dunnet’s correction.
Extended Data Fig. 7 |
Extended Data Fig. 7 |. 25HC regulation of cholesterol esterification and ALOD4 binding.
a, b, Examination of lipid droplet formation by microscopy (a; images) or flow cytometry (b; bar graph). CHO-7 cells were treated for 2 hours with SZ58-035 (10 μM) or vehicle (DMSO), and then treated with 25HC (5 μM) along with SZ58-035 (10 μM) or vehicle. For microscopy, CHO-7 cells were plated onto glass culture slides prior to treatments and fixed cells were incubated with DAPI to visualize nuclei (blue) and LipidSpot (green) to detect lipid droplet formation. Representative microscopy images are shown. Scale bar, 20 μm. For flow cytometry measurement of lipid droplets in treated CHO-7 cells, the total fluorescence (LipidSpot, Ex-488 nm) was calculated as the %LipidSpot+ cells multiplied by the geometric mean fluorescence intensity. Bars represent mean values. Error bars show s.d. from four independent experiments and statistical significance was determined by one-way ANOVA compared to vehicle-treated cells, with Dunnet’s correction. c, Immunoblot showing SREBP2 processing in cholesterol-replete (left blot) or cholesterol-depleted (right blot) CHO-K1 cells after treatment without or with 25HC in the presence or absence of 58-035, as described in Methods. P, precursor form of SREBP2; N, nuclear form of SREBP2. Blots are representative of three independent experiments. d, Cholesterol accessibility on PMs of CHO-7 mutant cells (SRD-1) constitutively expressing nuclear SREBP-2 treated with 25HC or 7α-HC was assessed by immunoblot analysis of ALOD4 binding, as described in Methods. A representative immunoblot from three independent experiments quantified in Fig. 6g is shown.
Extended Data Fig. 8 |
Extended Data Fig. 8 |. 25HC does not suppress L. monocytogenes infection via LXR stimulation.
a, Strategy to generate LXRα/β-deficient cells via CRISPR/Cas9 editing. Genomic sequencing of LXRα/β-deficient HEK293A demonstrating indel formation in each targeted exon is shown. The 20 bp guides are highlighted in red, while the 3 bp PAM sequence is highlighted in blue. Alignments to WT reference DNA using Needle software is shown for each allele. b, To confirm loss of LXR signalling, Wild-type and LXRα/β-deficient HEK293A were stimulated with LXR agonists (2.5 μM GW3965 or 5 μM 25-HC) or vehicle for 24 hours. Total RNA was extracted and mRNA levels of the LXR target gene ABCA1 was determined by qPCR. Expression levels were normalized to non-treated samples, for LXR WT and LXRα/β-deficient cells, respectively. Bars represent mean values. Error bars show s.d. from three independent experiments and statistical significance was determined by one-way ANOVA compared to vehicle-treated cells, with Dunnet’s correction. c, Wild-type and LXRα/β-deficient HEK293A cells were transduced with lentivirus co-expressing Tag-RFP and Fluc or CH25H. After 48 hour transduction, cells were infected with GFP-L monocytogenes (MOI =10) for 6 hours and analysed by flow cytometry. Bars represent mean values. Error bars show s.d. from three independent experiments and statistical significance was determined by student’s unpaired t-test (two-tailed).
Extended Data Fig. 9 |
Extended Data Fig. 9 |. Model of plasma membrane cholesterol remodelling by circulating oxysterols.
Model of 25HC-mediated regulation of accessible cholesterol. (1) 25HC secreted from IFN-γ activated macrophage enters the target cell and stimulates the enzymatic activity of ACAT (Step 1). ACAT activation results in production of cholesteryl esters that are incorporated into lipid droplets (Step 2). Cholesterol esterification lowers the free cholesterol levels in the ER, triggering internalization of accessible cholesterol from the plasma membrane (Step 3). Long-term suppression of accessible cholesterol is achieved through 25HC-mediated inhibition of the SREBP2 pathway which leads to lower cholesterol synthesis and uptake (Step 4).
Fig. 1 |
Fig. 1 |. IFN-γ-activated BMDMs secrete an antibacterial factor.
a, Schematic of the medium-transfer assay designed to investigate antibacterial products produced and secreted by mIFN-γ-stimulated BMDMs. b, HEK293A cells cultured in conditioned medium from mIFN-γ-stimulated BMDMs were infected with GFP-expressing L. monocytogenes (multiplicity of infection (m.o.i.) = 2; 22 h) as indicated. The flow cytometry plots show the percentage of GFP-positive HEK293A cells. FSC, forward scatter. c, Quantification of the assay described in b (BMDM-conditioned medium). d, HEK293A cells were not affected by residual mIFN-γ present in BMDM-conditioned media. HEK293A cells were treated with 500 U ml−1 mIFN-γ for 24 h and infected with GFP-expressing L. monocytogenes the next day (m.o.i. = 2; 22 h). Infection was quantified by flow cytometry as in c. c,d, The bars represent the mean values. The error bars show the s.d. from three independent experiments and statistical significance was determined using a Student’s unpaired t-test (two-tailed). Lm, L. monocytogenes.
Fig. 2 |
Fig. 2 |. Functional cDNA screen of γ-ISGs identifies CH25H as an inhibitor of L. monocytogenes infection.
a, Schematic of the γ-ISG lentiviral library development and screening strategy for antibacterial γ-ISGs. SDFs were transduced for 48 h and then infected with GFP-tagged L. monocytogenes (m.o.i. = 5; 8 h). FC, fold change; LTR, long terminal repeat; CMV, cytomegalovirus; RFP, red fluorescent protein. b, Level of L. monocytogenes infection in the presence of overexpressed γ-ISG. Two replicate screens were performed and the average infection level for each ISG is shown. The horizontal yellow line represents the mean and the error bars show the s.d. Inhibitory γ-ISGs are indicated in red, control firefly luciferase (Fluc) is indicated in green. c, Lentiviral stocks of the genes identified in b were reproduced and the antibacterial activity was assessed. SDFs were transduced with each lentivirus and then infected with GFP-expressing L. monocytogenes (m.o.i. = 10; 6 h) after 48 h. d, To determine whether the confirmed inhibitors of L. monocytogenes infection from c possessed secreted antibacterial activity, SDFs were transduced with each ISG for 48 h, and naive SDFs were bathed in conditioned media and subsequently infected with GFP-expressing L. monocytogenes (m.o.i. = 5; 6 h). c,d, Infection was quantified by flow cytometry. The bars represent the mean values. The error bars show the s.d. from three independent experiments and statistical significance in comparison to Fluc was determined using a one-way analysis of variance (ANOVA) with Dunnett’s correction.
Fig. 3 |
Fig. 3 |. 25HC inhibits L. monocytogenes infection in local tissue environments.
a, Chemical structures of cholesterol (top) and 25HC (bottom). b, Concentration of the indicated oxysterols in media collected from WT or Ch25h−/− BMDMs treated with either mIFN-γ or vehicle for 24 h. The bars represent the mean values. The error bars show the s.d. from two independent experiments. See Methods for the oxysterol nomenclature. c, HEK293A cells were cultured in media collected from WT or Ch25h−/− BMDMs treated with mIFN-γ or vehicle as described in Fig. 1a and infected as in Fig. 1b. Left, representative flow cytometry plots showing the percentage of infected cells. Flow cytometry plots are representative of three independent experiments. Right, percentage of infected cells determined from three independent flow cytometry experiments. The bars represent the mean values. The error bars show the s.d. and statistical significance was determined using a Student’s unpaired t-test (two-tailed). d, Quantification of L. monocytogenes infection of immortalized cell lines, primary normal human dermal fibroblasts (NHDFs) and BMDMs treated with 25HC. See Methods for the infection conditions. The bars represent the mean values. The error bars show the s.d. from four independent experiments for all except U2-OS (n = 3) and statistical significance was determined using a Student’s unpaired t-test (two-tailed). e, Concentration of the indicated oxysterols in the serum collected from ethanol- (vehicle, n = 5) or 25HC-treated (n = 5) mice as described in f. The bars represent the mean values. The error bars show the s.e.m. f, Mice injected with either ethanol (vehicle, n = 15) or 25HC (n = 15) in the peritoneal cavity and infected with L. monocytogenes by oral gavage as described in Methods. Bacterial tissue transmission was determined 72 h post-infection by enumerating the bacterial colony-forming units (c.f.u.) recovered from whole-spleen homogenates. g, Ch25h−/− (n = 12) and WT (n = 14) mice were orally infected with L. monocytogenes as described in Methods. Bacterial tissue transmission was determined as in f. f,g, The horizontal lines represents the mean. The error bars are the s.e.m. and statistical significance was determined using a Student’s unpaired t-test (two-tailed).
Fig. 4 |
Fig. 4 |. 25HC restricts L. monocytogenes cell-to-cell dissemination.
a,b, Representative images (a) and quantification (b) of membrane protrusions induced by L. monocytogenes infection of Caco-2 cells expressing NeuroRFP. Alexa Fluor 647 phalloidin staining was used to visualize F-actin. a, Scale bars, 20 μm (left) and 1 μm (right; magnifications of the region in the white box on the left). b, Left, frequency of host membrane protrusions per field of view collected across three independent experiments (vehicle treatment (−), n = 10 and 25HC, n = 13). Right, the total number of bacteria were similar between the two indicated treatments. The bars represent the mean values. The error bars show the s.d. and statistical significance was determined using a Student’s unpaired t-test (two-tailed). c, Schematic depicting the donor-to-recipient experiment. d, Representative images of recipient HEK293AΔMETΔCDH1 cells seeded with donor cells (WT HEK293A) infected with GFP-expressing L. monocytogenes as in c. The white boxes show the region of the merged inset (right). Scale bars, 100 μm (left and middle) and 50 μm (right). The cells were seeded at a donor:recipient ratio of 1:200. Images were acquired 24 h after donor-cell seeding. Images are representative of three independent experiments. e, Representative flow cytometry plots (n = 3) of donor (RFP-positive) and recipient (RFP-negative) cells infected with L. monocytogenes (GFP-positive). The percentage of L. monocytogenes infection in recipient cells (rectangular gate) is shown. f, Percentage of recipient cells infected, determined using the gating strategy in e. The bars represent the mean values. For the WT L. monocytogenes comparison (bars 1 and 2), the error bars show the s.d. from three independent experiments and statistical significance was determined using a Student’s unpaired t-test (two-tailed). Spread-deficient L. monocytogenes ΔactA served as a negative control and uninfected (UI) recipient cells are shown.
Fig. 5 |
Fig. 5 |. 25HC reorganizes PM cholesterol.
a, Structure and membrane-binding model for ALOD4 (left; residues 404–512 of ALO; Protein Data Bank: 3CQF) and OlyA (right; Protein Data Bank: 6MYJ), which bind to accessible cholesterol and sphingomyelin (SM)-sequestered cholesterol, respectively. b, Immunoblot showing ALOD4 and OlyA bound to the membranes of CHO-7 cells treated with 5μM of the indicated oxysterol. The blots are representative of three independent experiments. c, Percentage of ALOD4 bound to the membranes and percentage of L. monocytogenes inhibition in CHO-7 cells treated with the indicated concentrations of 25HC for 16 h in media supplemented with 5% LPDS (low lipoprotein content; upper graph) or 10% FBS (high lipoprotein content; lower graph). The mean values from three independent experiments are plotted and the error bars show the s.e.m. EC50, half-maximum effective concentration; IC50, half-maximum inhibitory concentration. d,e, Graph (d) and representative flow cytometry plots (e) showing the percentage of CHO-K1 cells infected with L. monocytogenes after treatment with vehicle (ethanol) or 25HC (5μM; 16 h) and SMase, as described in Methods. The bars represent the mean values. The error bars show the s.d. from four independent experiments and statistical significance in comparison to the vehicle was determined using a one-way ANOVA with Dunnett’s correction. f, Percentage of HEK293A cells infected with L. monocytogenes after treatment with vehicle (ethanol) or 25HC (5μM; 16 h). The treated cells were incubated with cholesterol-methyl-β-cyclodextrin (MCD) complexes (40 μM) for 1 h before infection with GFP-expressing L. monocytogenes (m.o.i. = 10; 6 h) and then analysed by flow cytometry. The bars represent the mean values. The error bars show the s.d. from three independent experiments and statistical significance in comparison to the vehicle was determined using a one-way ANOVA with Dunnett’s correction. g,h, Quantification (g) and representative images (h) of foci-forming assays showing the effect of cholesterol repletion on bacterial dissemination in HEK293A cells treated with 25HC (5μM). The foci areas for the experiment presented in g, h were quantified as in Extended Data Fig. 4e. The bars represent the mean values. The error bars show the s.d. from three independent experiments and statistical significance in comparison to the vehicle was determined before normalization using a one-way ANOVA with Dunnett’s correction. h, Scale bars, 5 mm (top) and 1mm (bottom; magnification of the white squares in the top images).
Fig. 6 |
Fig. 6 |. Side-chain oxysterols mobilize accessible cholesterol through a concerted mechanism.
a, Oxysterol structures. b, Immunoblot showing ALOD4 bound to membranes of CHO-K1 cells treated with different concentrations of the indicated oxysterol. Immunoblots are representative of three independent experiments. c, Immunoblot showing SREBP2 processing in sterol-depleted CHO-K1 cells, which were incubated with increasing concentrations of the indicated oxysterols for 4 h. P, precursor form of SREBP2; N, nuclear form of SREBP2. Immunoblots are representative of three independent experiments. d,e, Immunoblots showing ALOD4 bound to the membrane (d) or SREBP2 processing (e) in CHO-K1 cells treated with 10 μM SZ58-035 or vehicle (dimethylsulfoxide) before the addition of the indicated oxysterols as described in b,c. See Methods for additional experimental details. Blots are representative of three independent experiments. f, Quantification of ALOD4 binding to membranes in CHO-7 cells pretreated with 10 μM SZ58-035 or vehicle (dimethylsulfoxide) and treated with the specified concentration of 25HC for the indicated times (1-h 25HC treatment, n = 4; 4-h treatment, n = 3; 16-h treatment, n = 3 except the 10 μM data point where n = 2) the following day. The mean values are plotted and the error bars show the s.e.m. g, Percentage of ALOD4 bound to the membranes of CHO-7 and SRD-1 cells treated with 25HC (5μM) for the indicated times. The bars represent the mean values. The error bars show the s.d. from three independent experiments. h, Percentage of L. monocytogenes-infected CHO-7 cells pretreated with SZ58-035 (10μM) and 25HC (5μM) as described in Methods. The bars represent the mean values. The error bars show the s.d. from three independent experiments and statistical significance in comparison to the vehicle was determined using a one-way ANOVA with Dunnett’s correction. i, Percentage of L. monocytogenes-infected CHO-7 and SRD-1 cells pretreated with 25HC (5μM) as described in Methods. The bars represent the mean values. The error bars show the s.d. from three independent experiments and statistical significance was determined using a Student’s unpaired t-test (two-tailed). h,i, The infection levels were assessed by flow cytometry.

Comment in

  • Cholesterol in quarantine.
    Dang EV, Madhani HD, Vance RE. Dang EV, et al. Nat Immunol. 2020 Jul;21(7):716-717. doi: 10.1038/s41590-020-0712-7. Nat Immunol. 2020. PMID: 32514065 No abstract available.
  • Cholesterol access aids pathogen spread.
    Andrews NW. Andrews NW. Nat Microbiol. 2020 Jul;5(7):881-882. doi: 10.1038/s41564-020-0744-7. Nat Microbiol. 2020. PMID: 32587375 No abstract available.

References

    1. Schroder K, Hertzog PJ, Ravasi T & Hume DA Interferon-γ: an overview of signals, mechanisms and functions. J. Leukoc. Biol 75, 163–189 (2004). - PubMed
    1. Jouanguy E et al. A human IFNGR1 small deletion hotspot associated with dominant susceptibility to mycobacterial infection. Nat. Genet 21, 370–378 (1999). - PubMed
    1. Jouanguy E et al. IL-12 and IFN-γ in host defense against mycobacteria and salmonella in mice and men. Curr. Opin. Immunol 11, 346–351 (1999). - PubMed
    1. Radoshevich L & Cossart P Listeria monocytogenes: towards a complete picture of its physiology and pathogenesis. Nat. Rev. Microbiol 16, 32–46 (2018). - PubMed
    1. Portnoy DA, Auerbuch V & Glomski IJ The cell biology of Listeria monocytogenes infection: the intersection of bacterial pathogenesis and cell-mediated immunity. J. Cell Biol 158, 409–414 (2002). - PMC - PubMed

Publication types

MeSH terms