. 2020 Jun;5(6):838-847.
doi: 10.1038/s41564-020-0694-0. Epub 2020 Apr 13.

Bacterial colonization reprograms the neonatal gut metabolome

Affiliations

Bacterial colonization reprograms the neonatal gut metabolome

Kyle Bittinger et al. Nat Microbiol. 2020 Jun.

Abstract

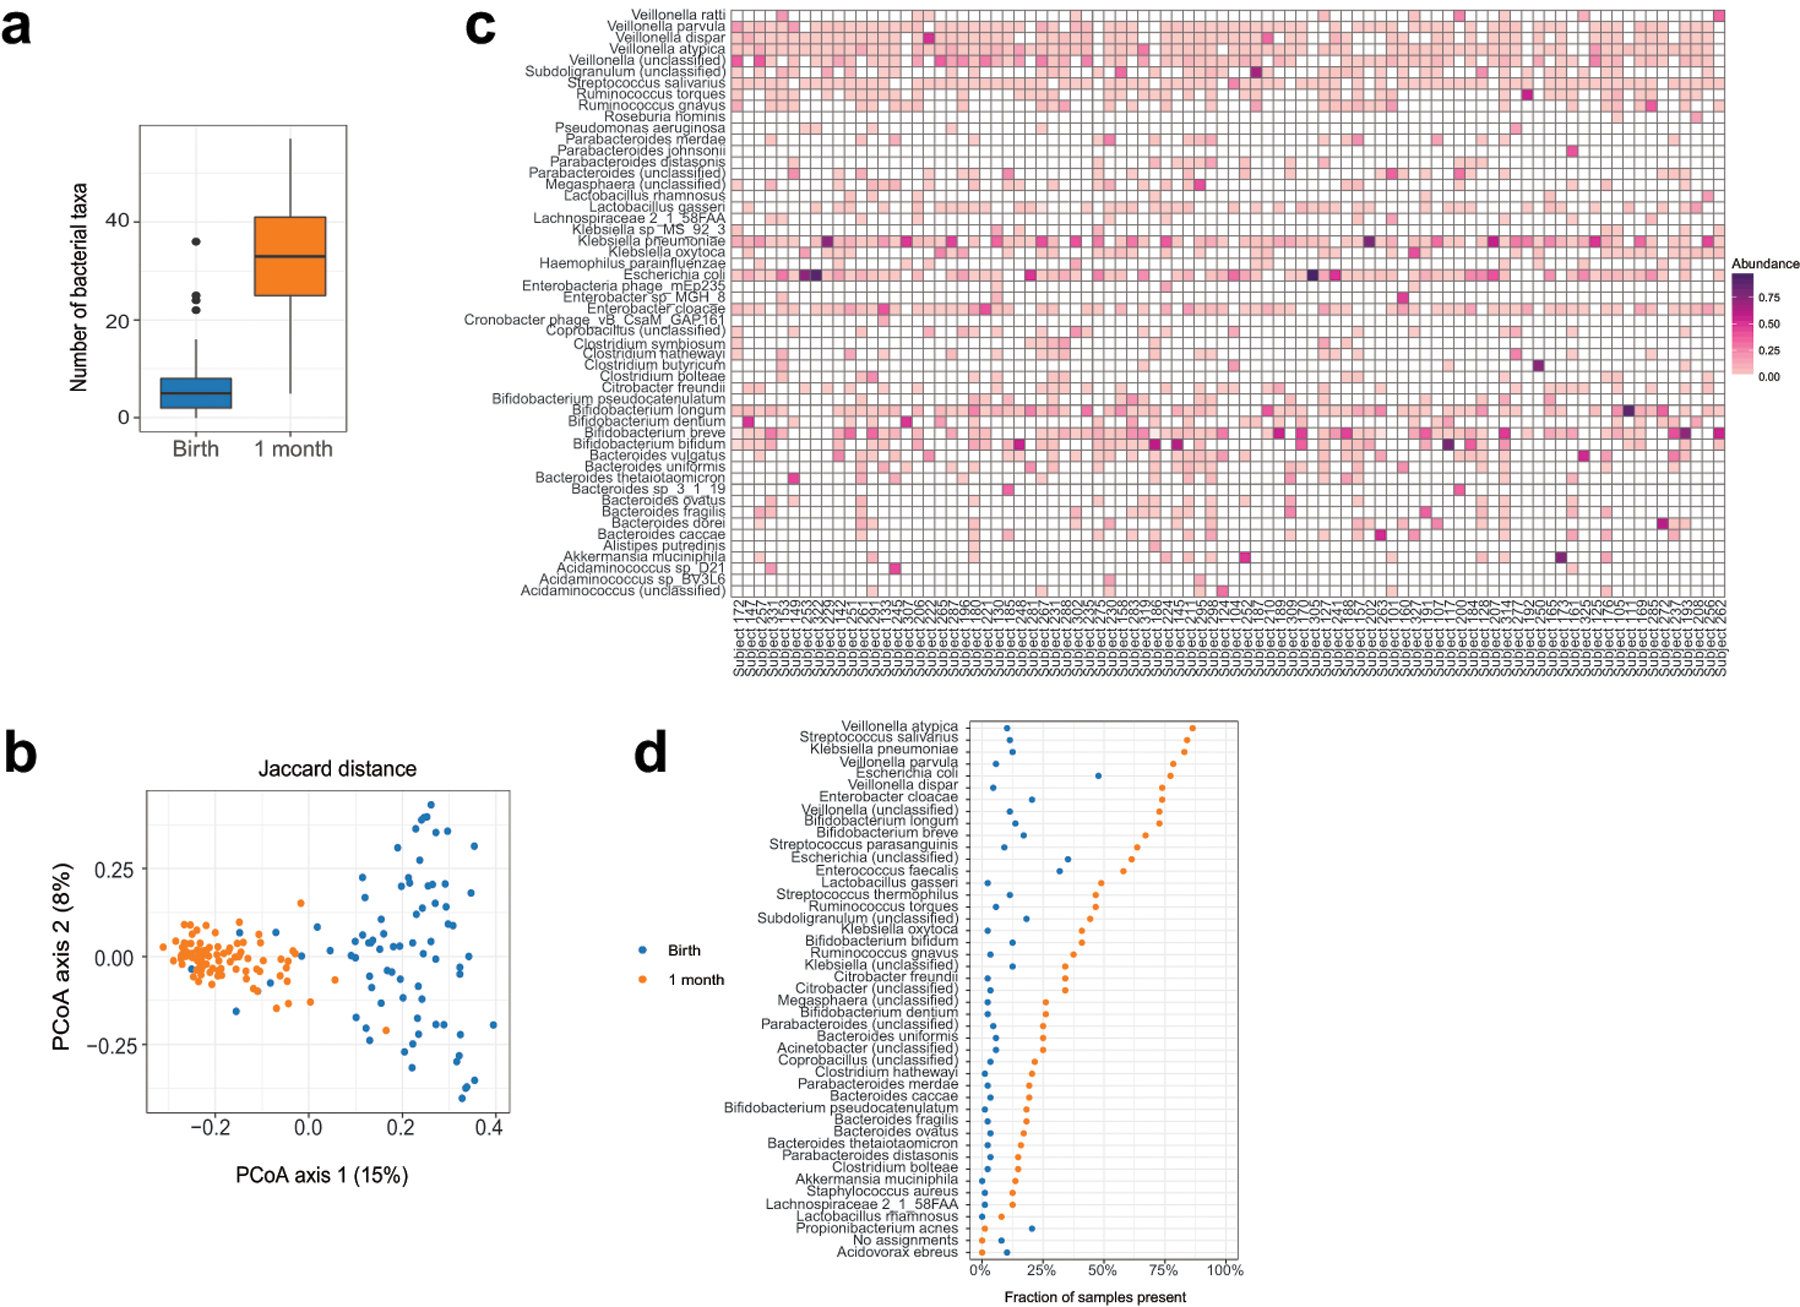
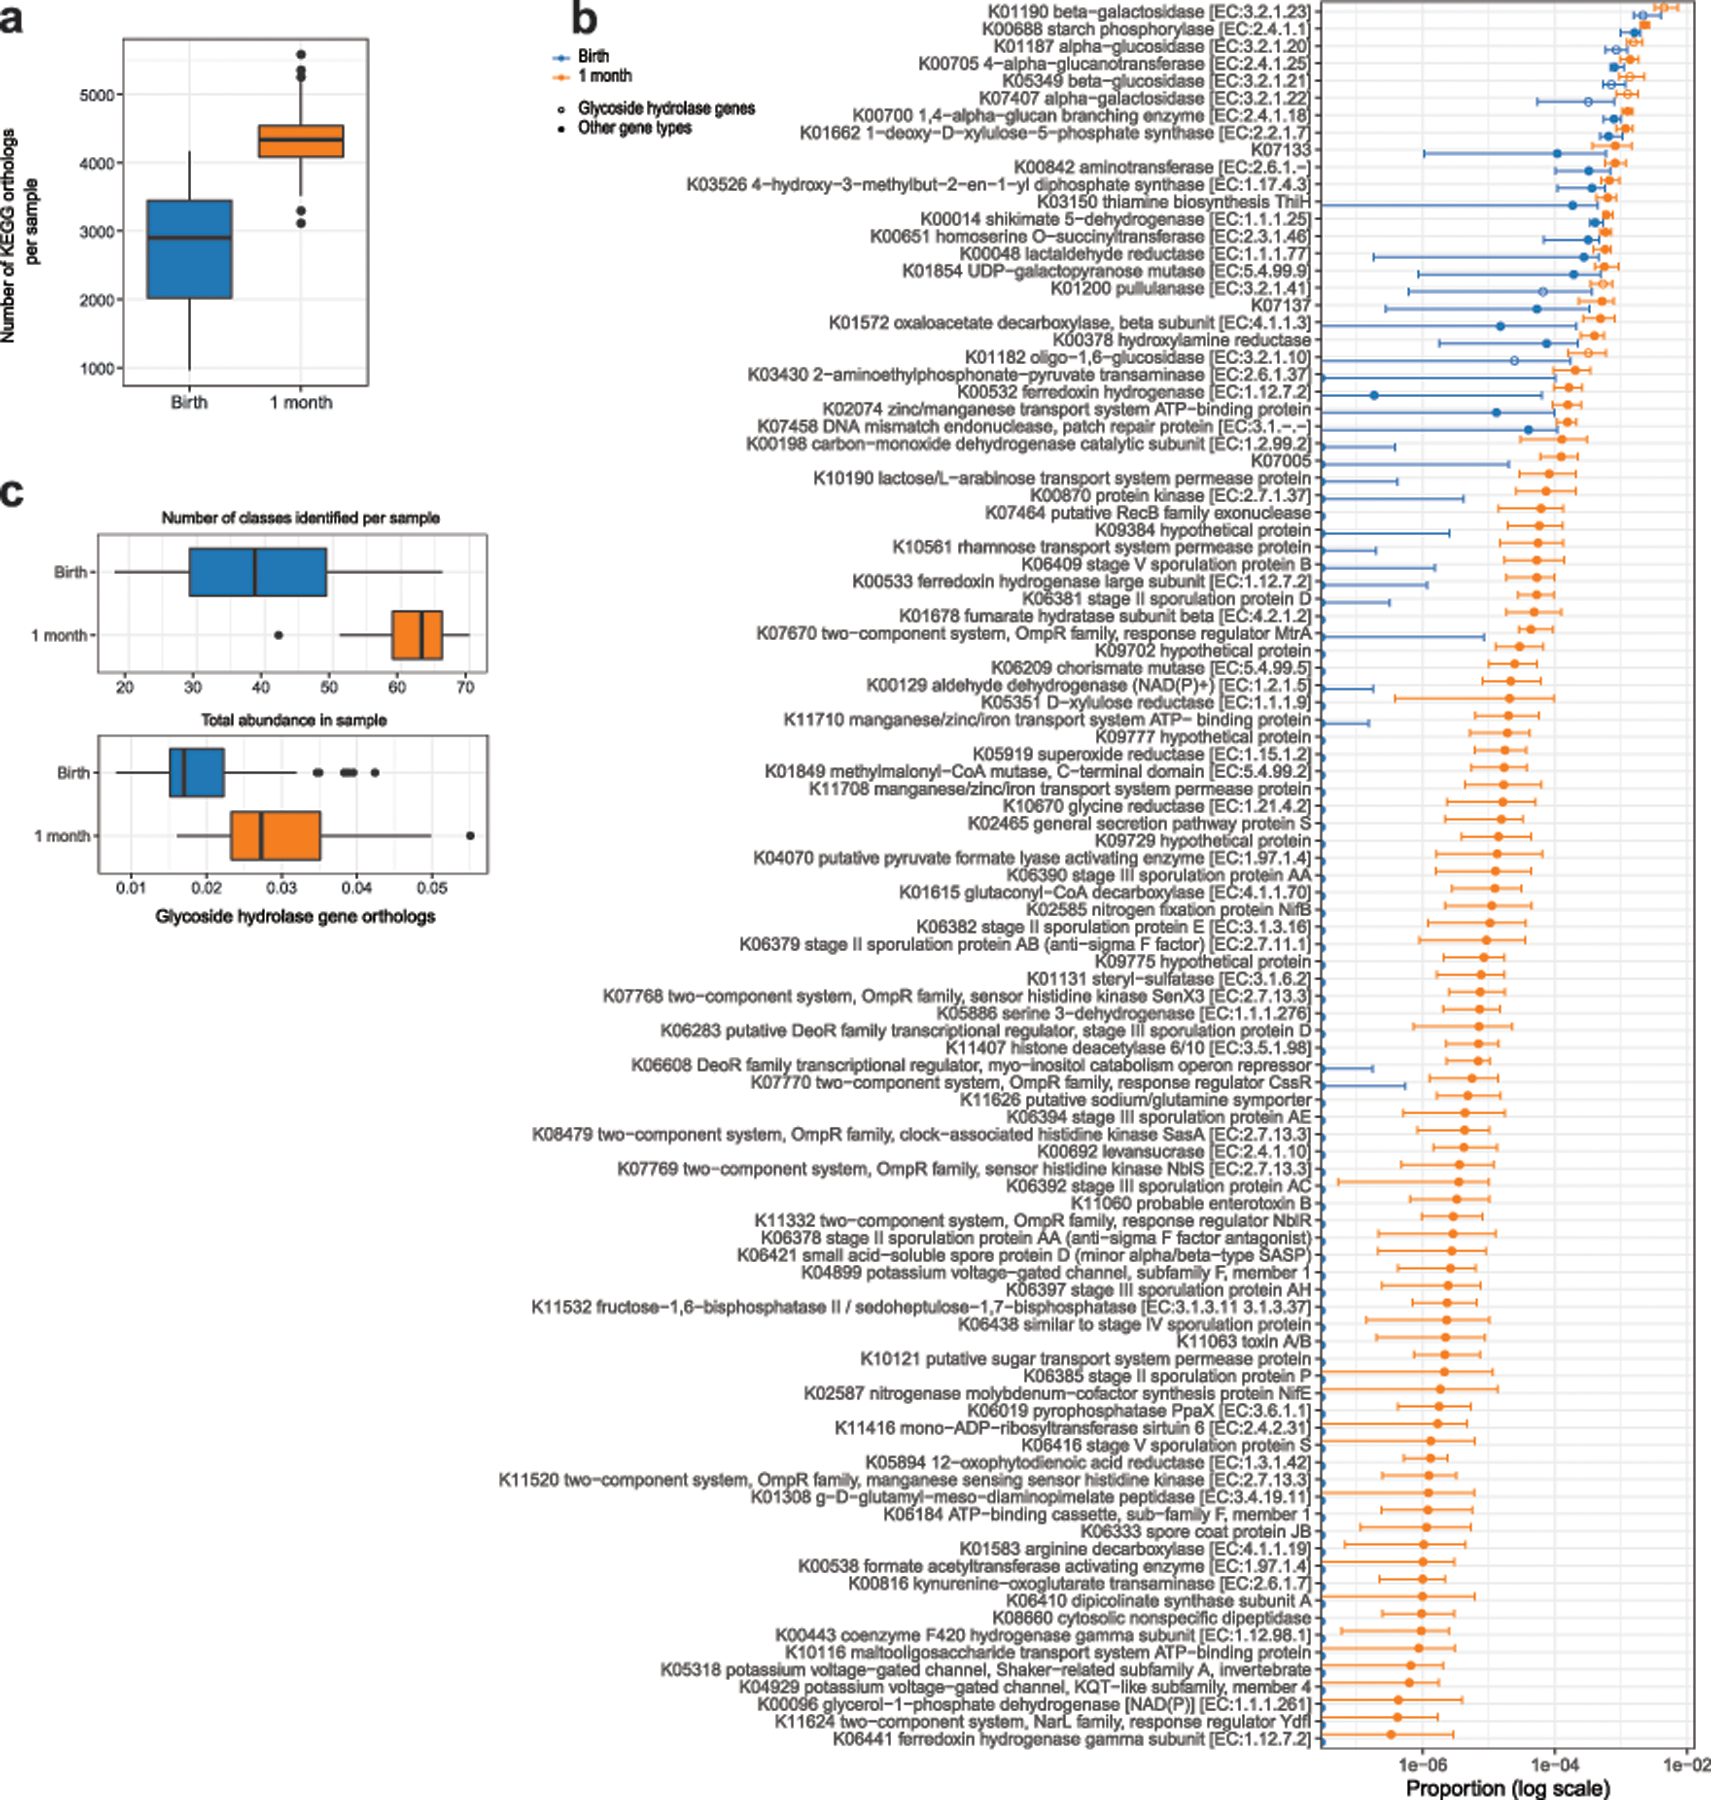
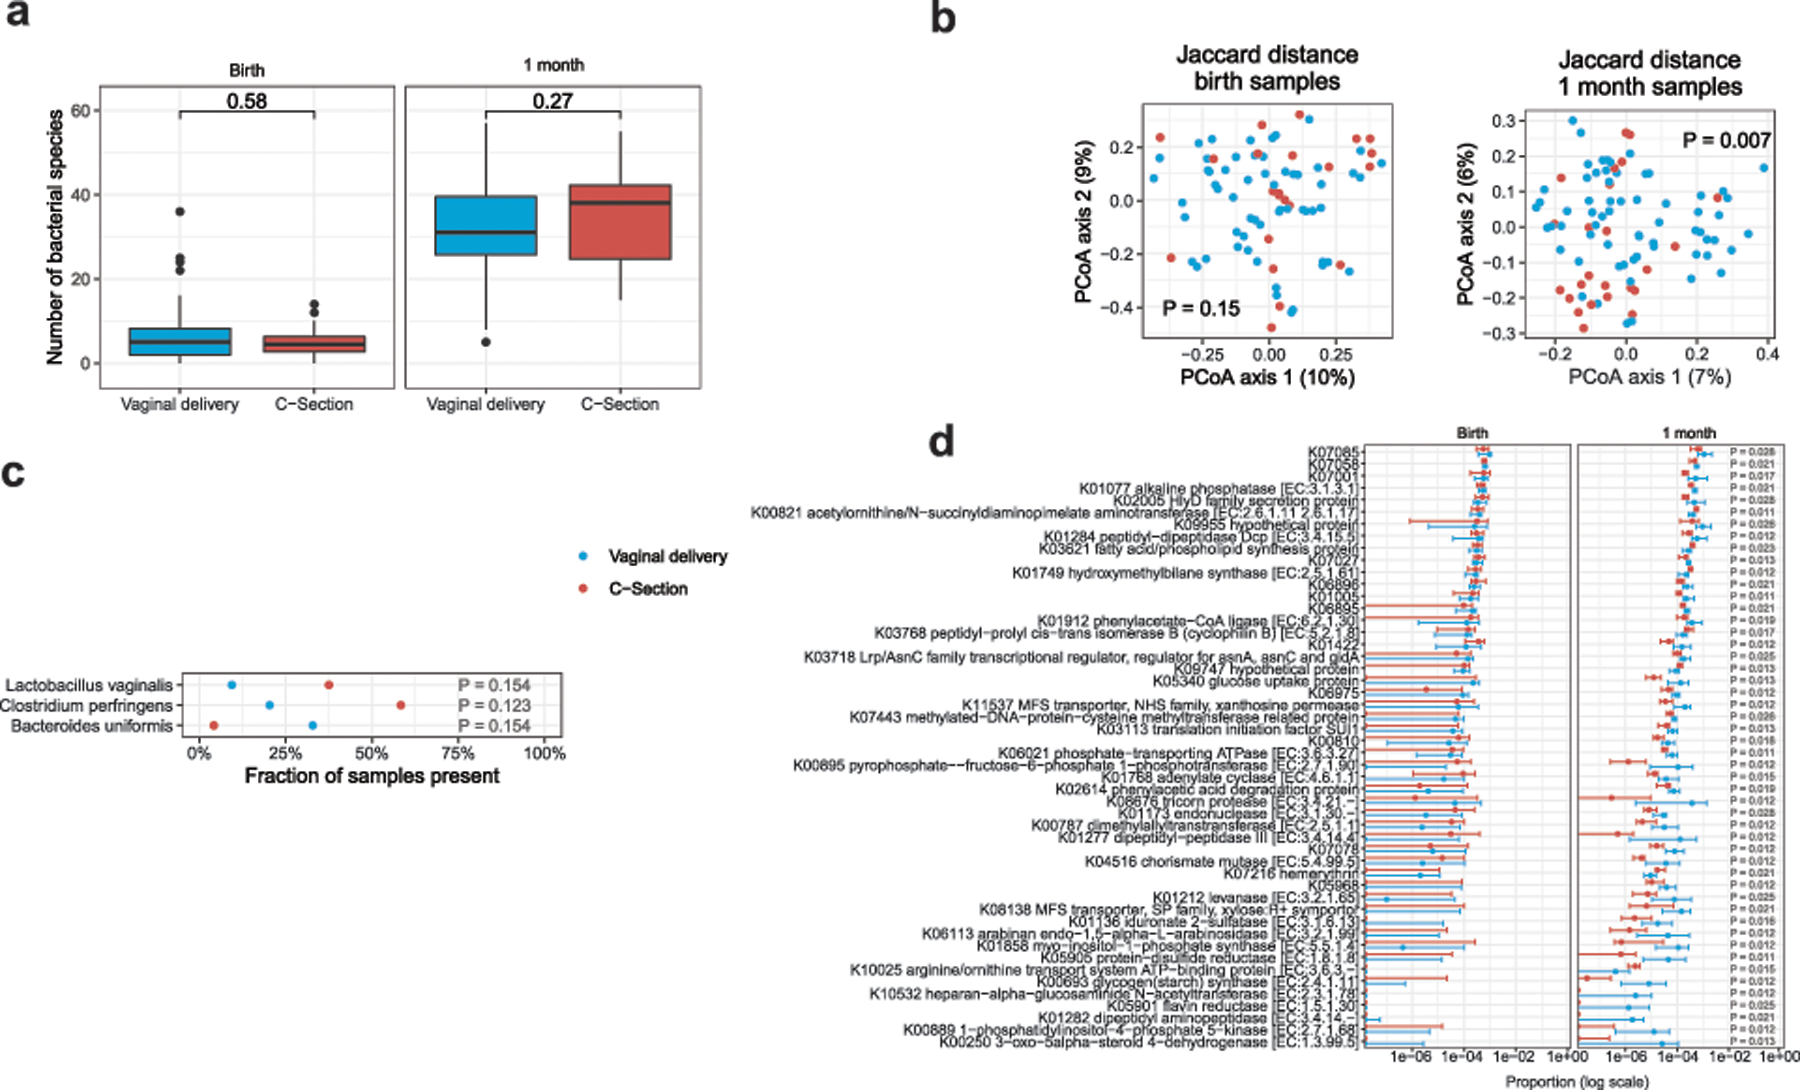
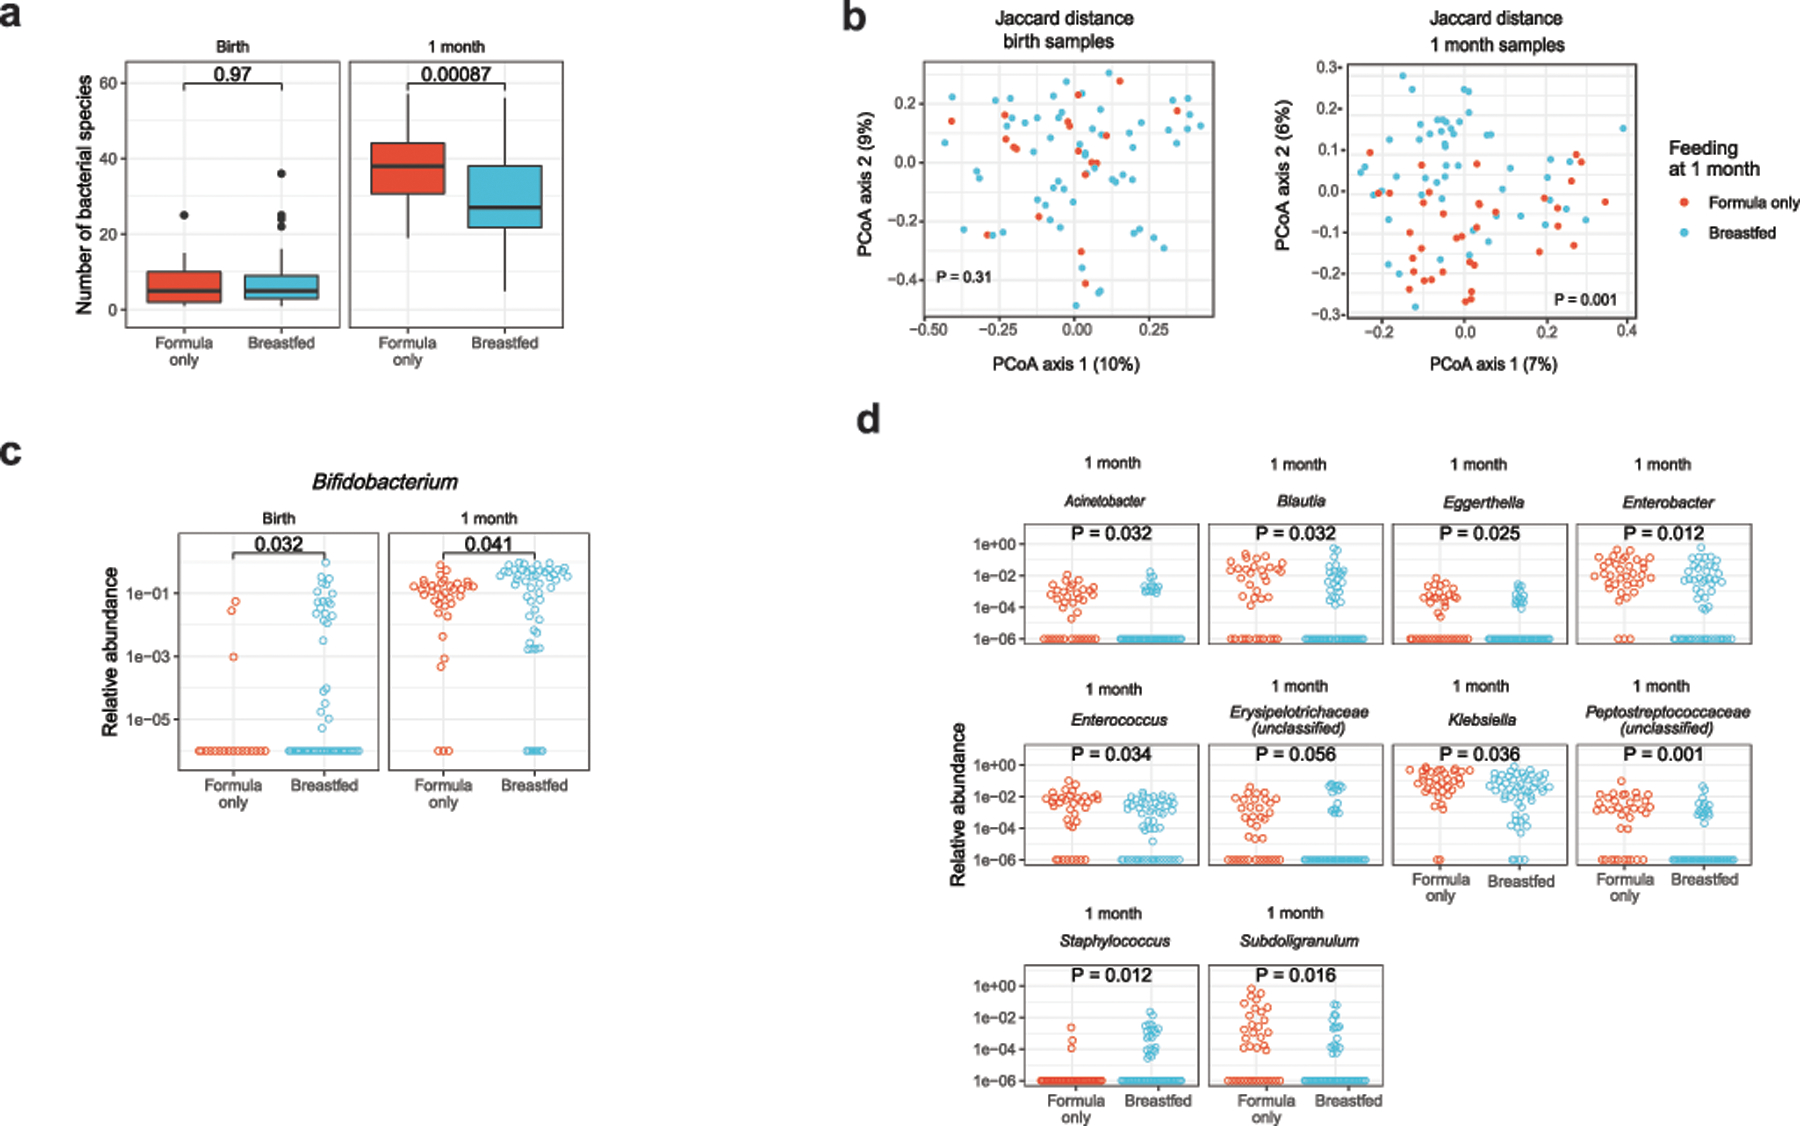
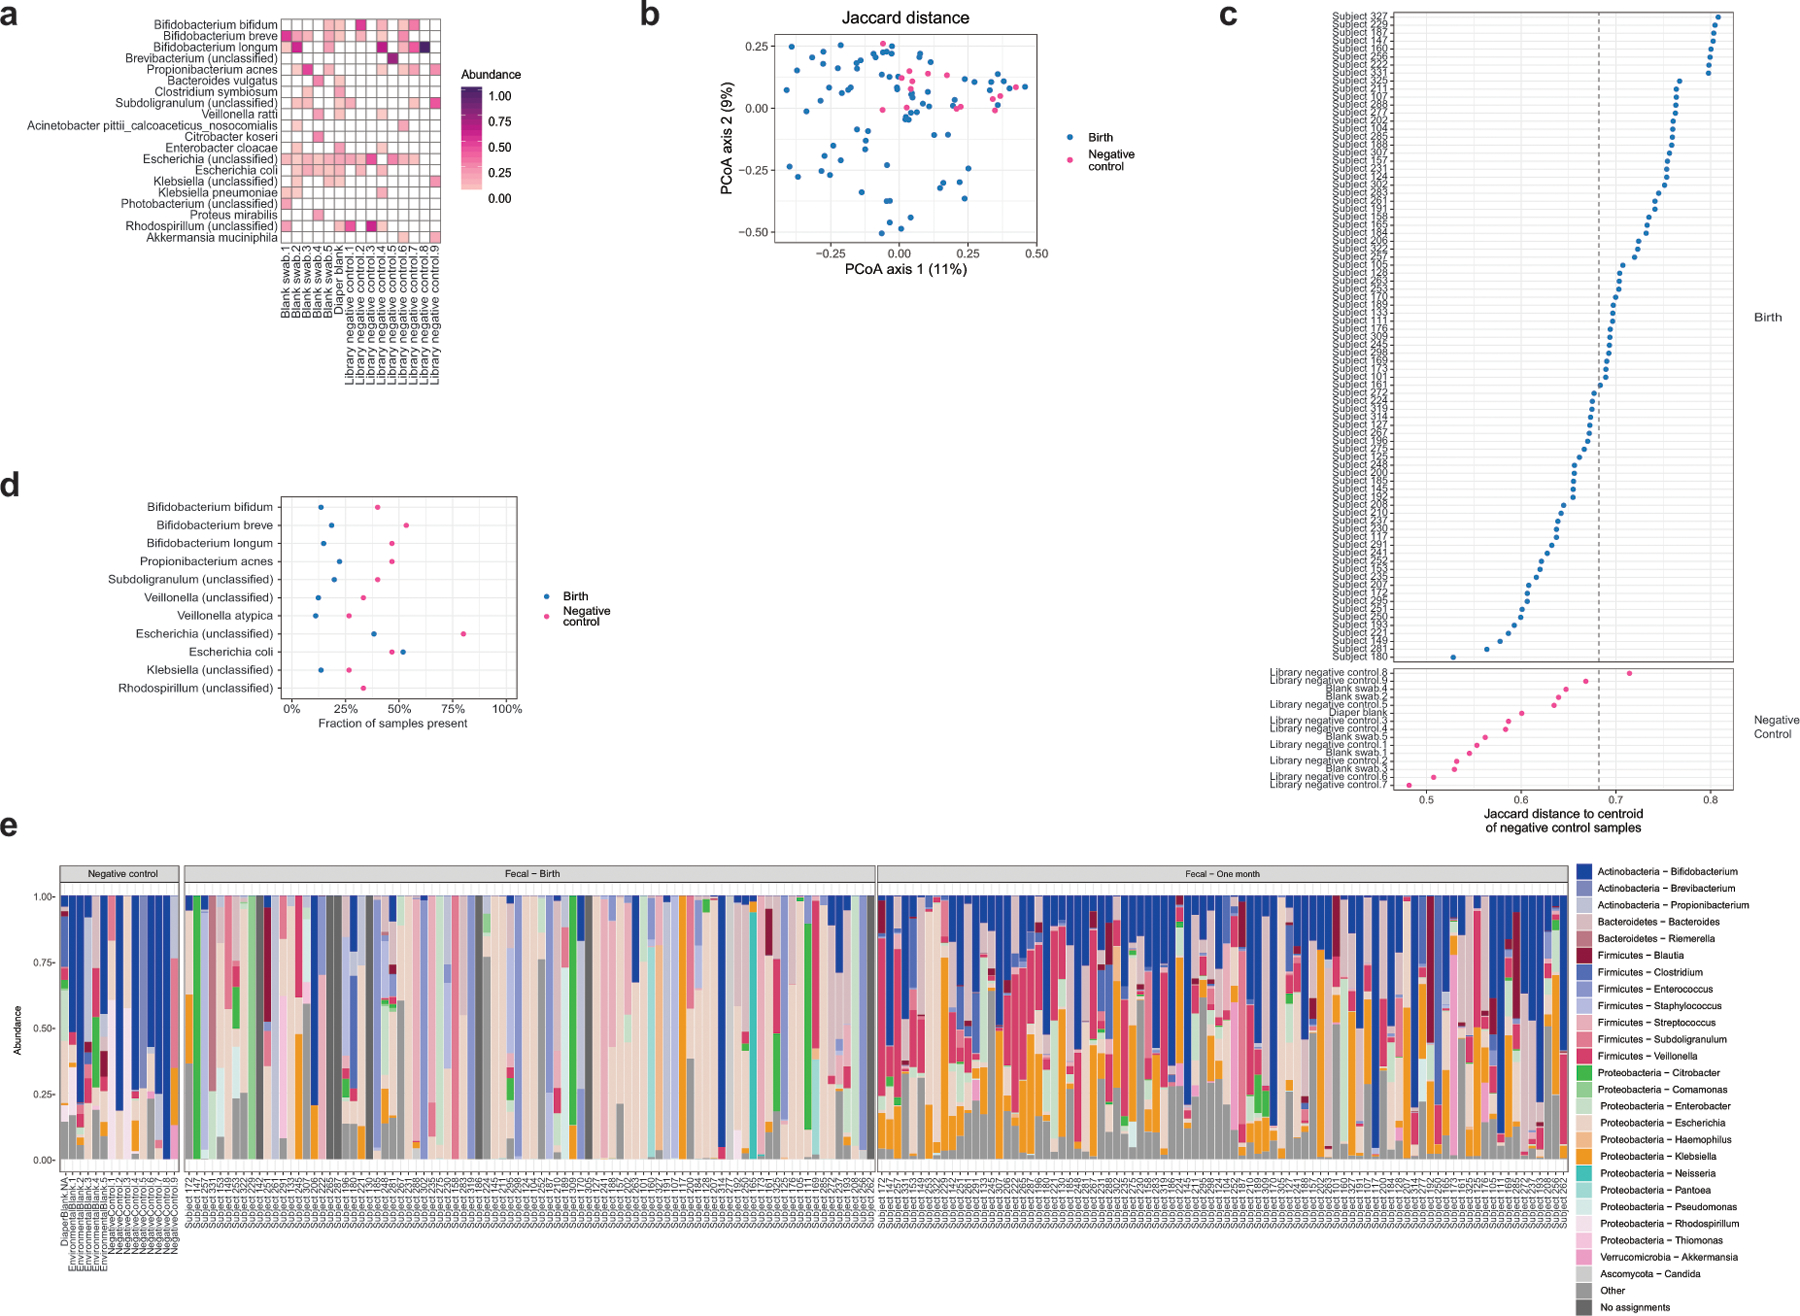
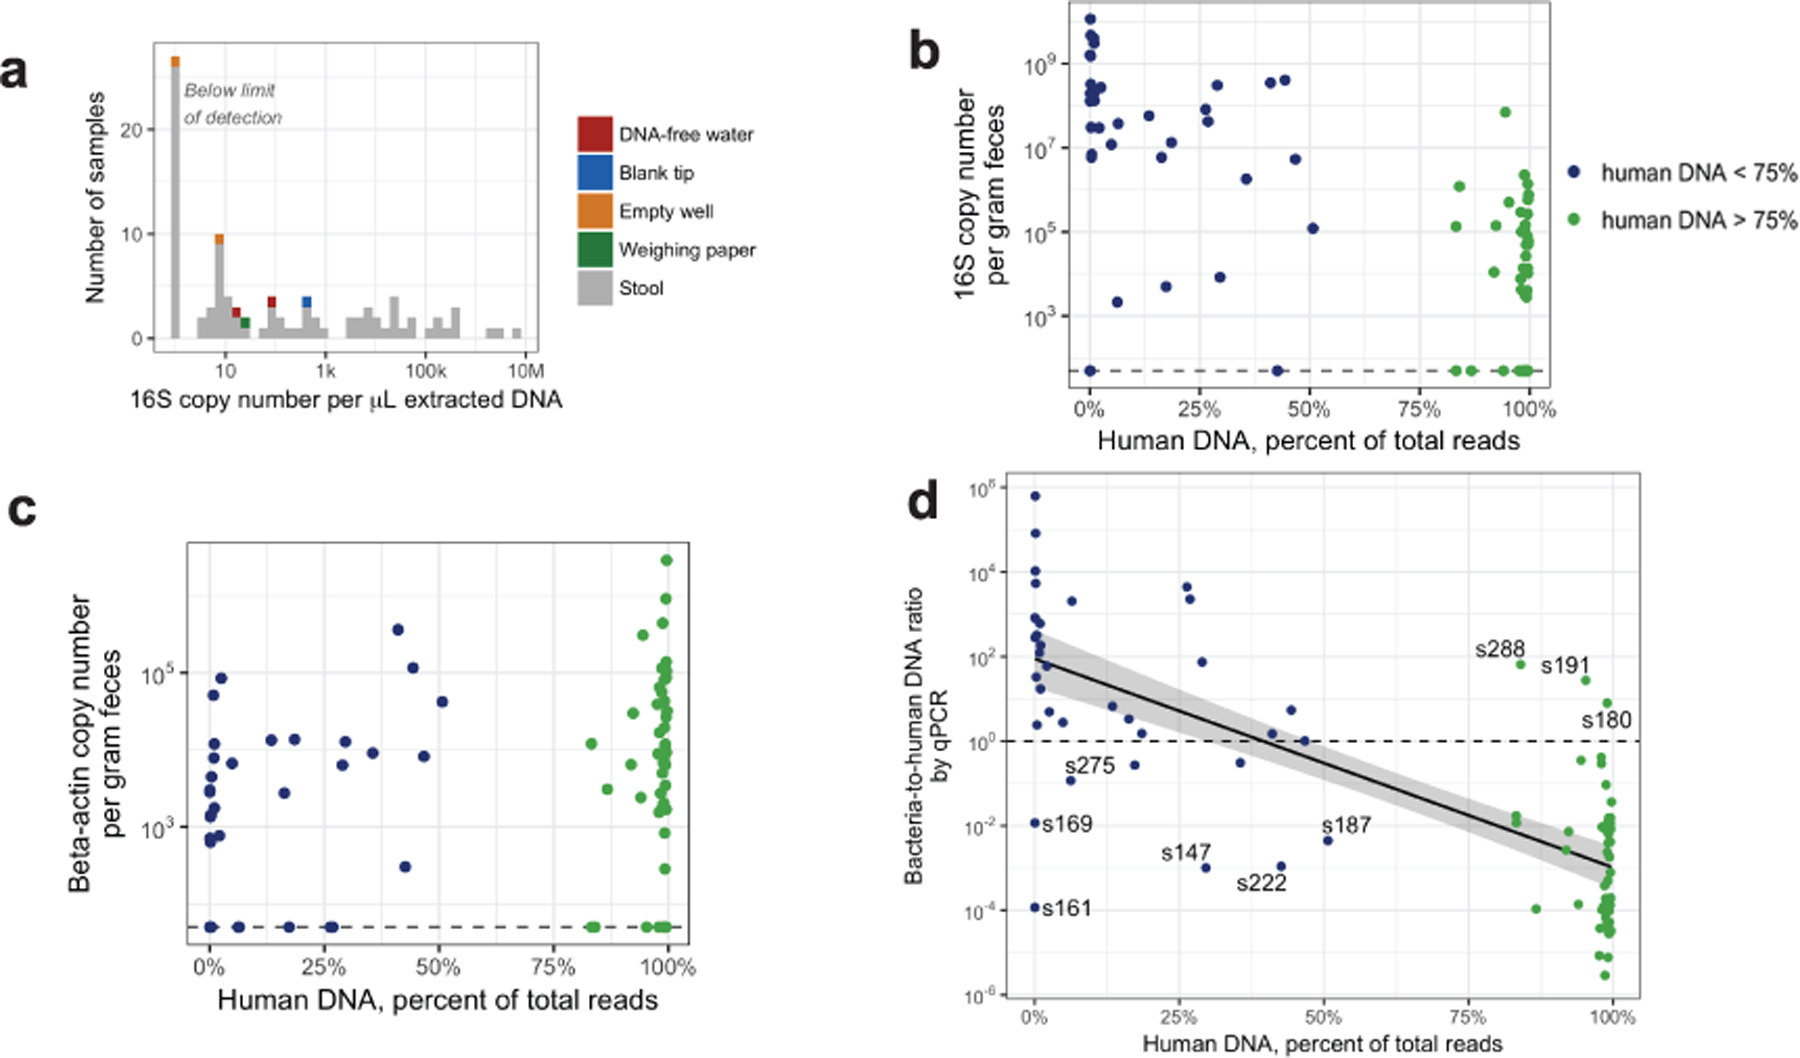
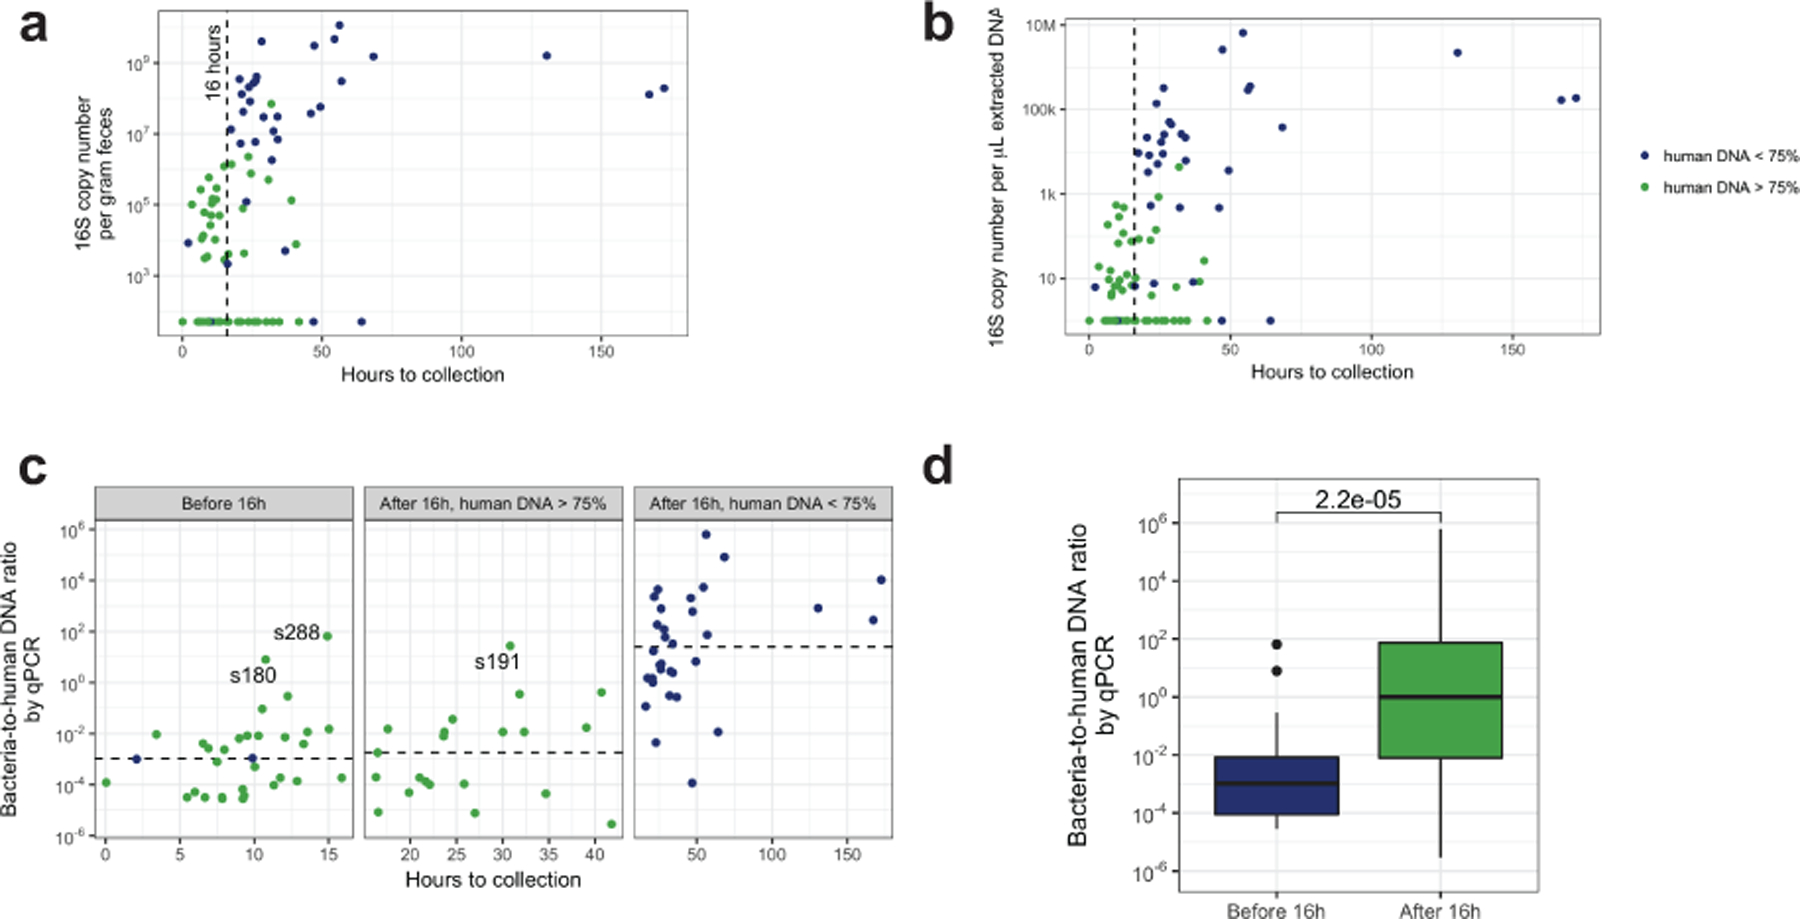
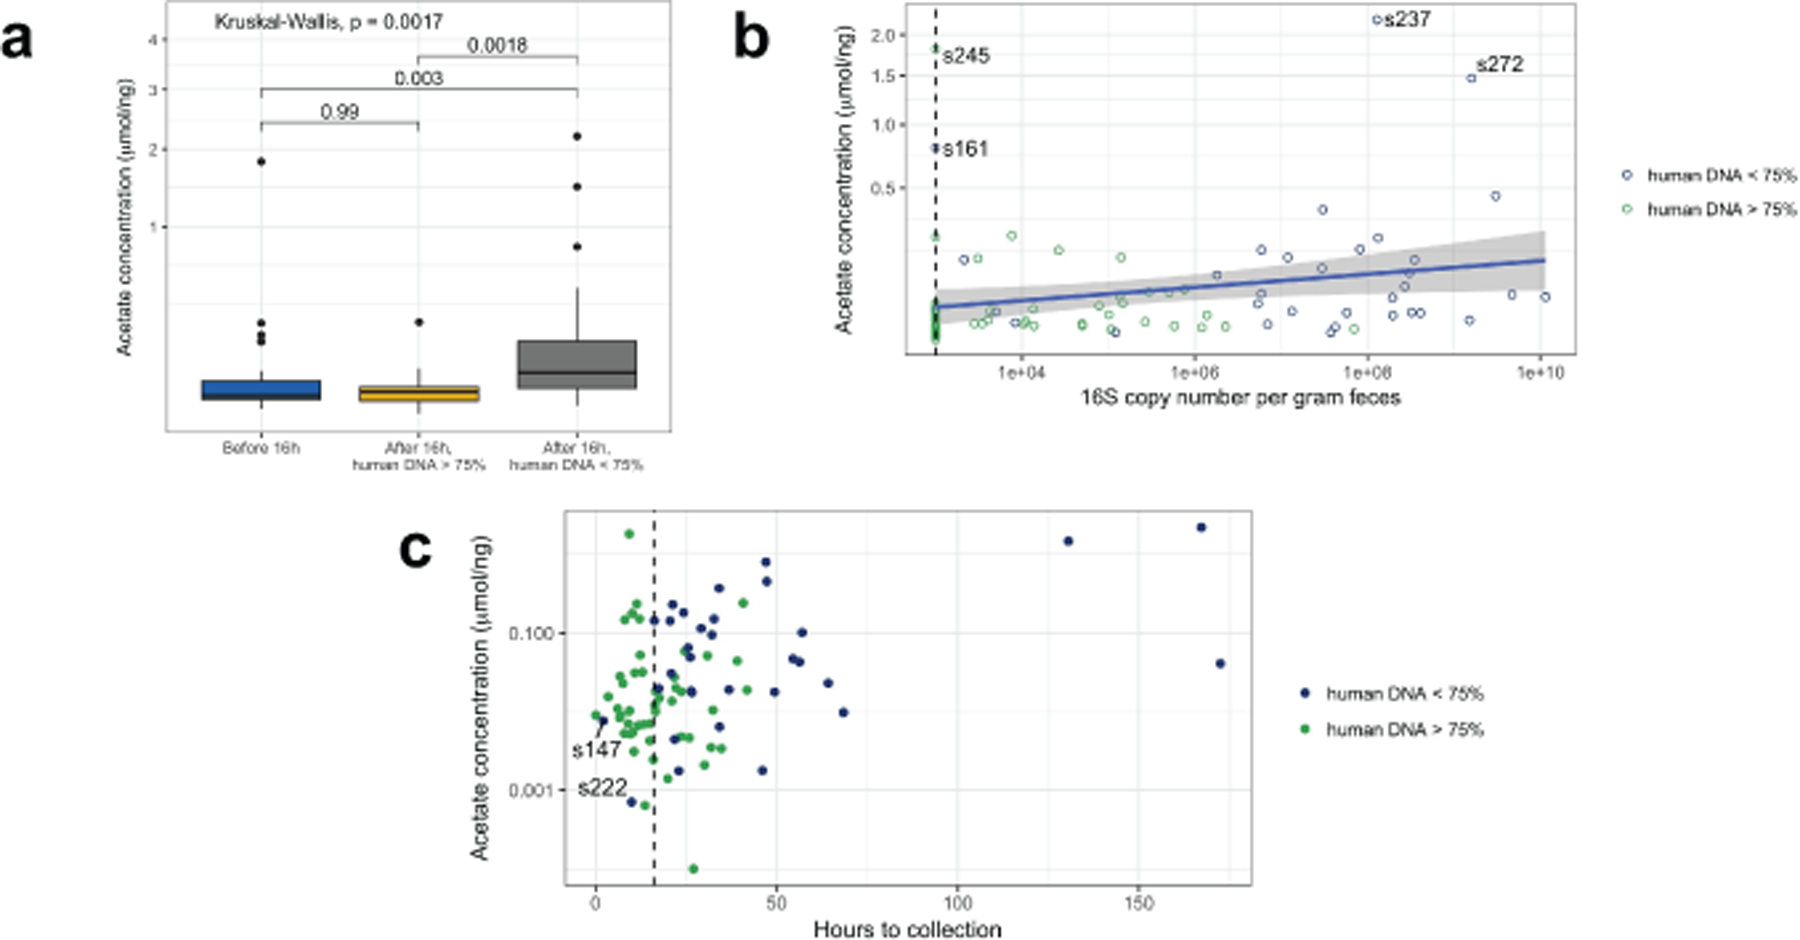
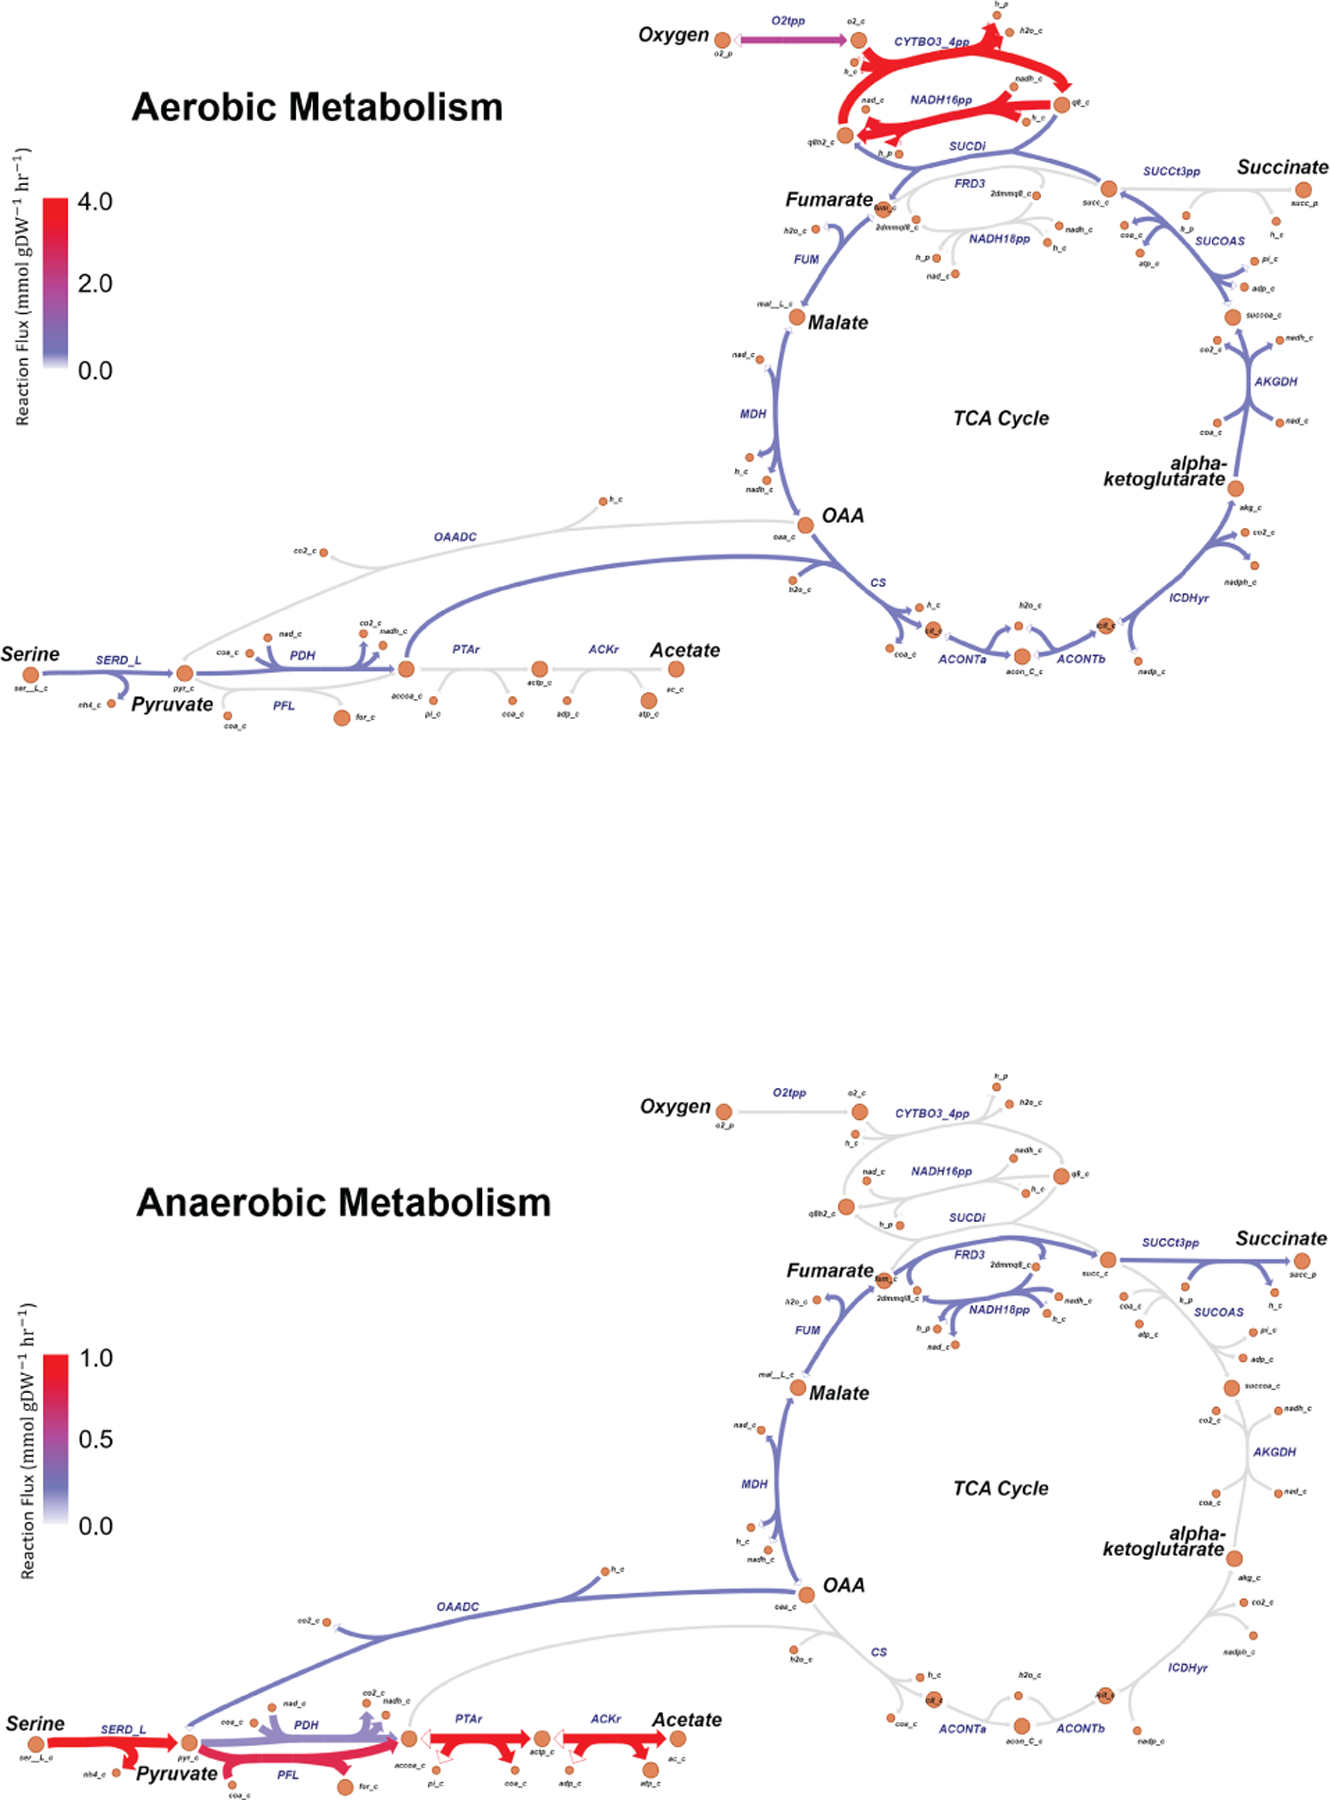
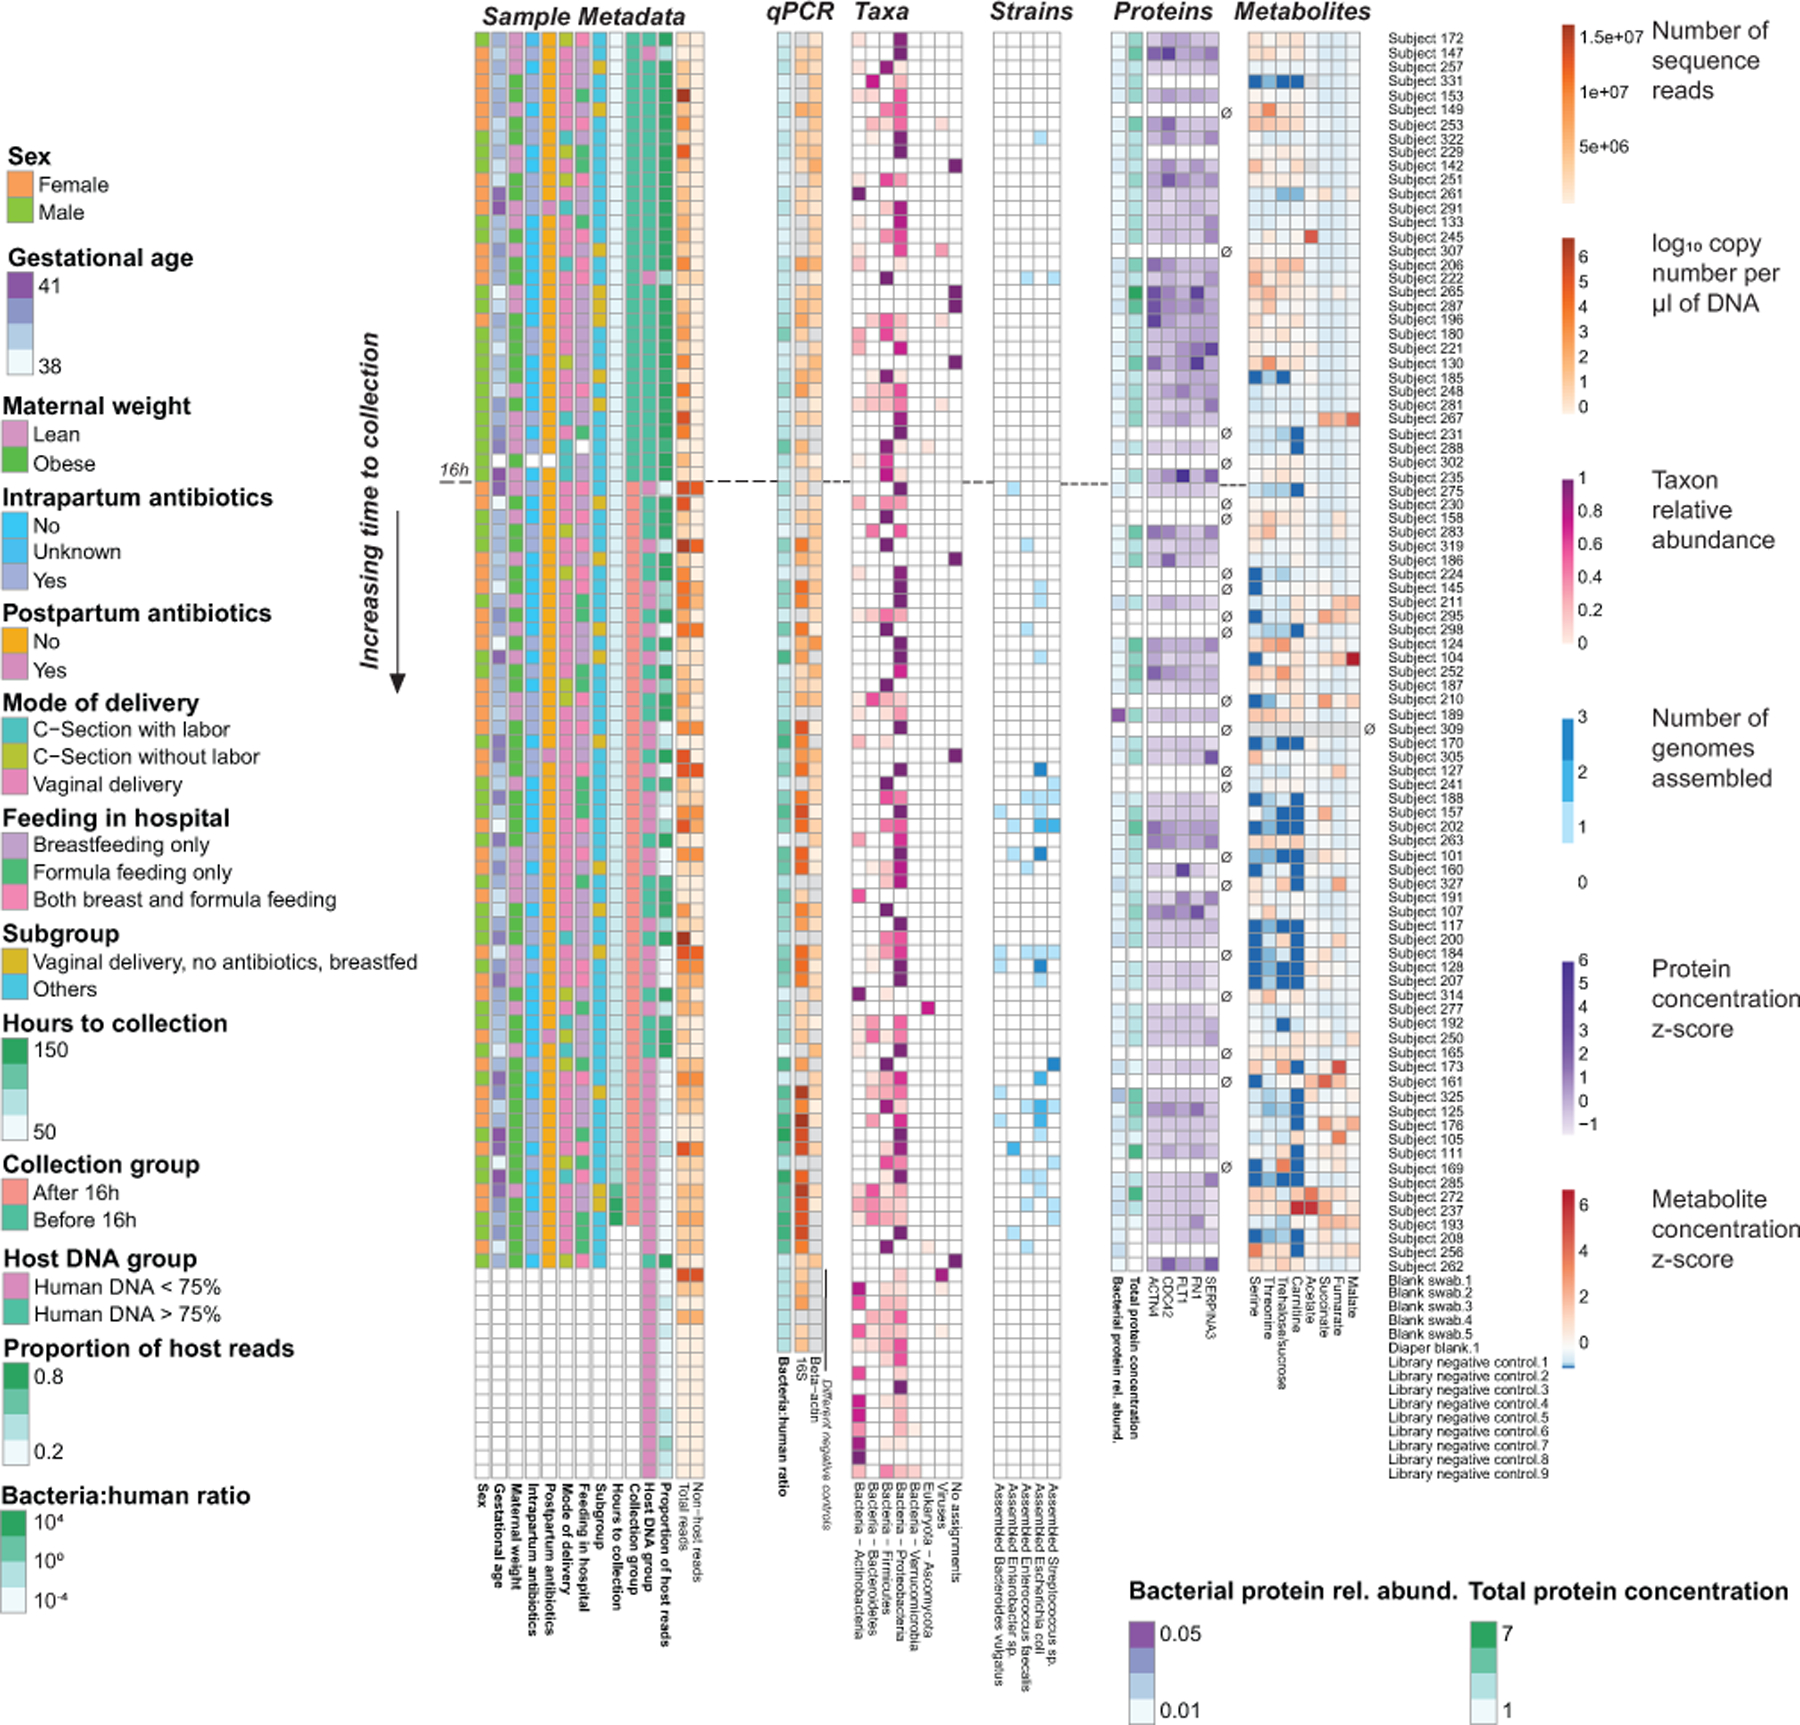
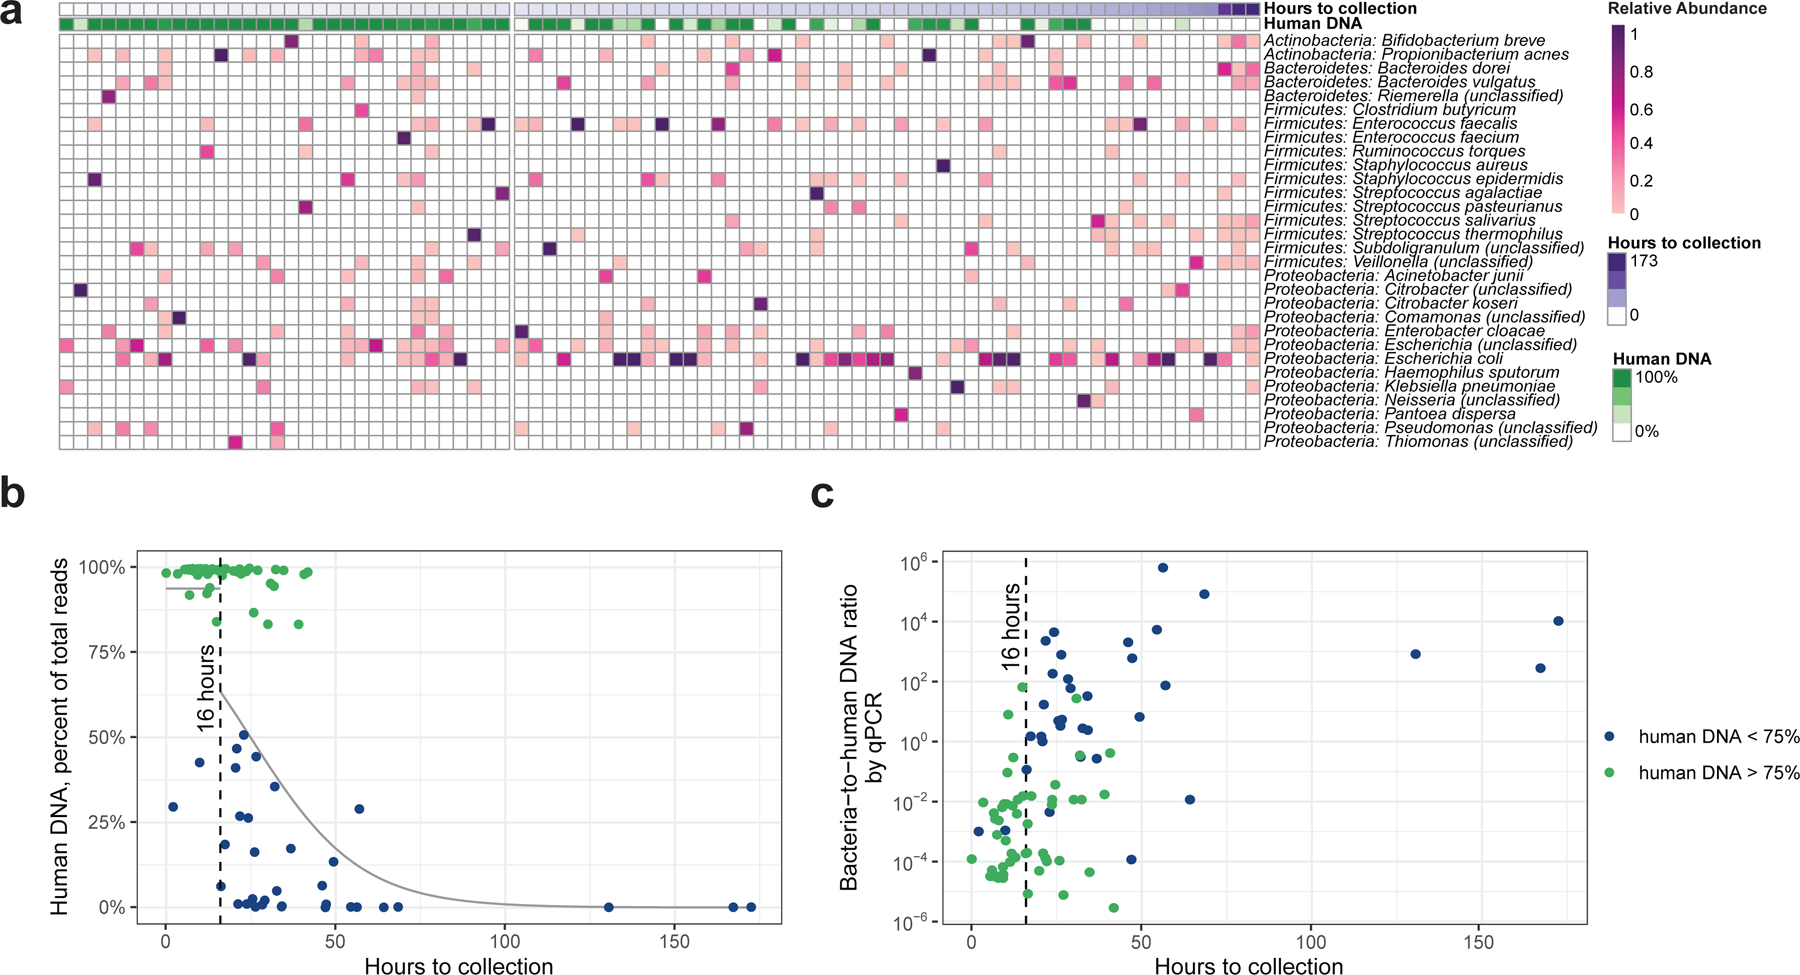
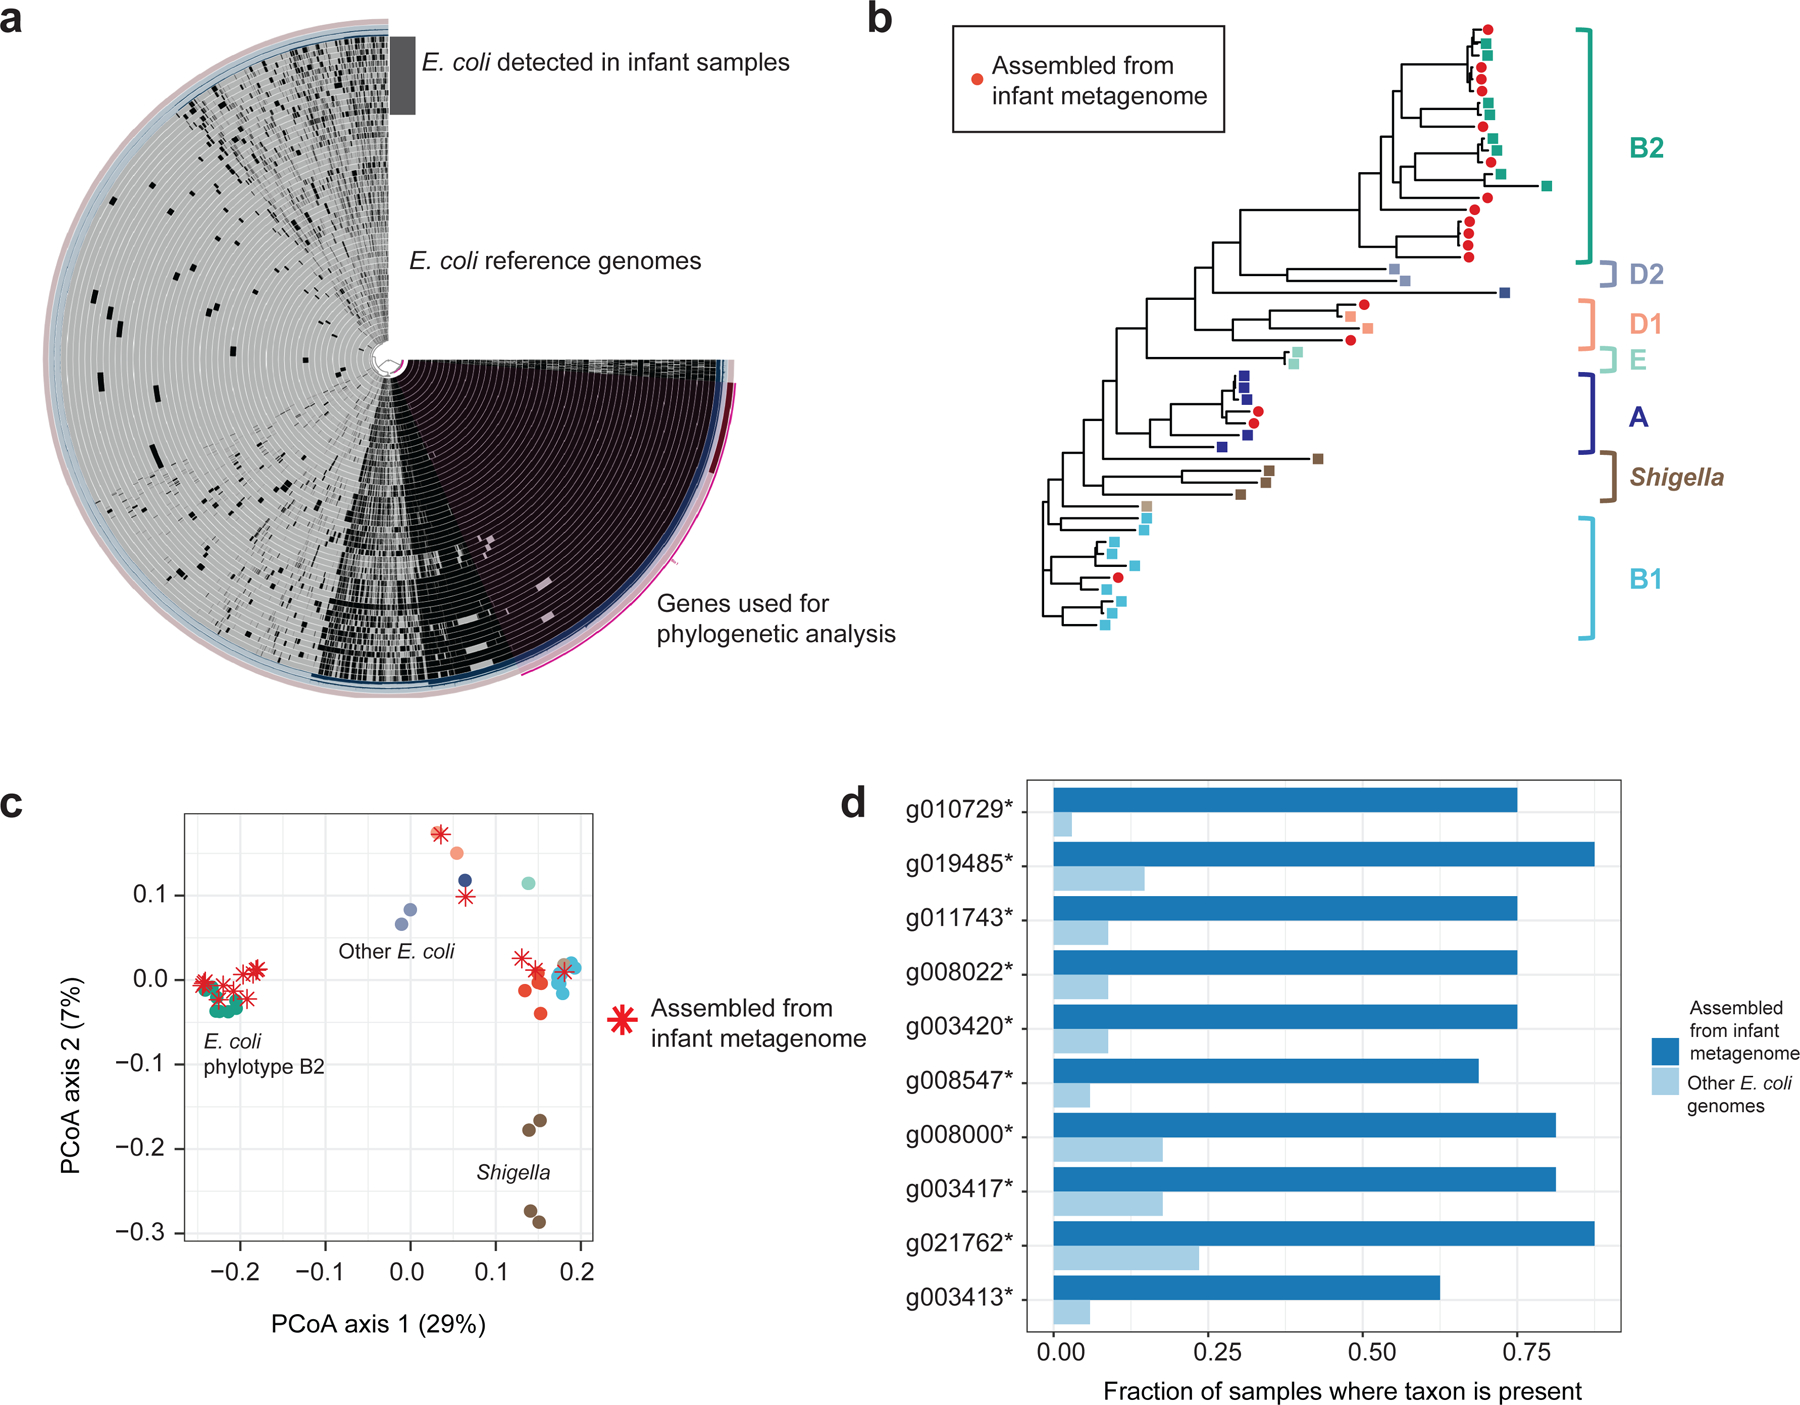
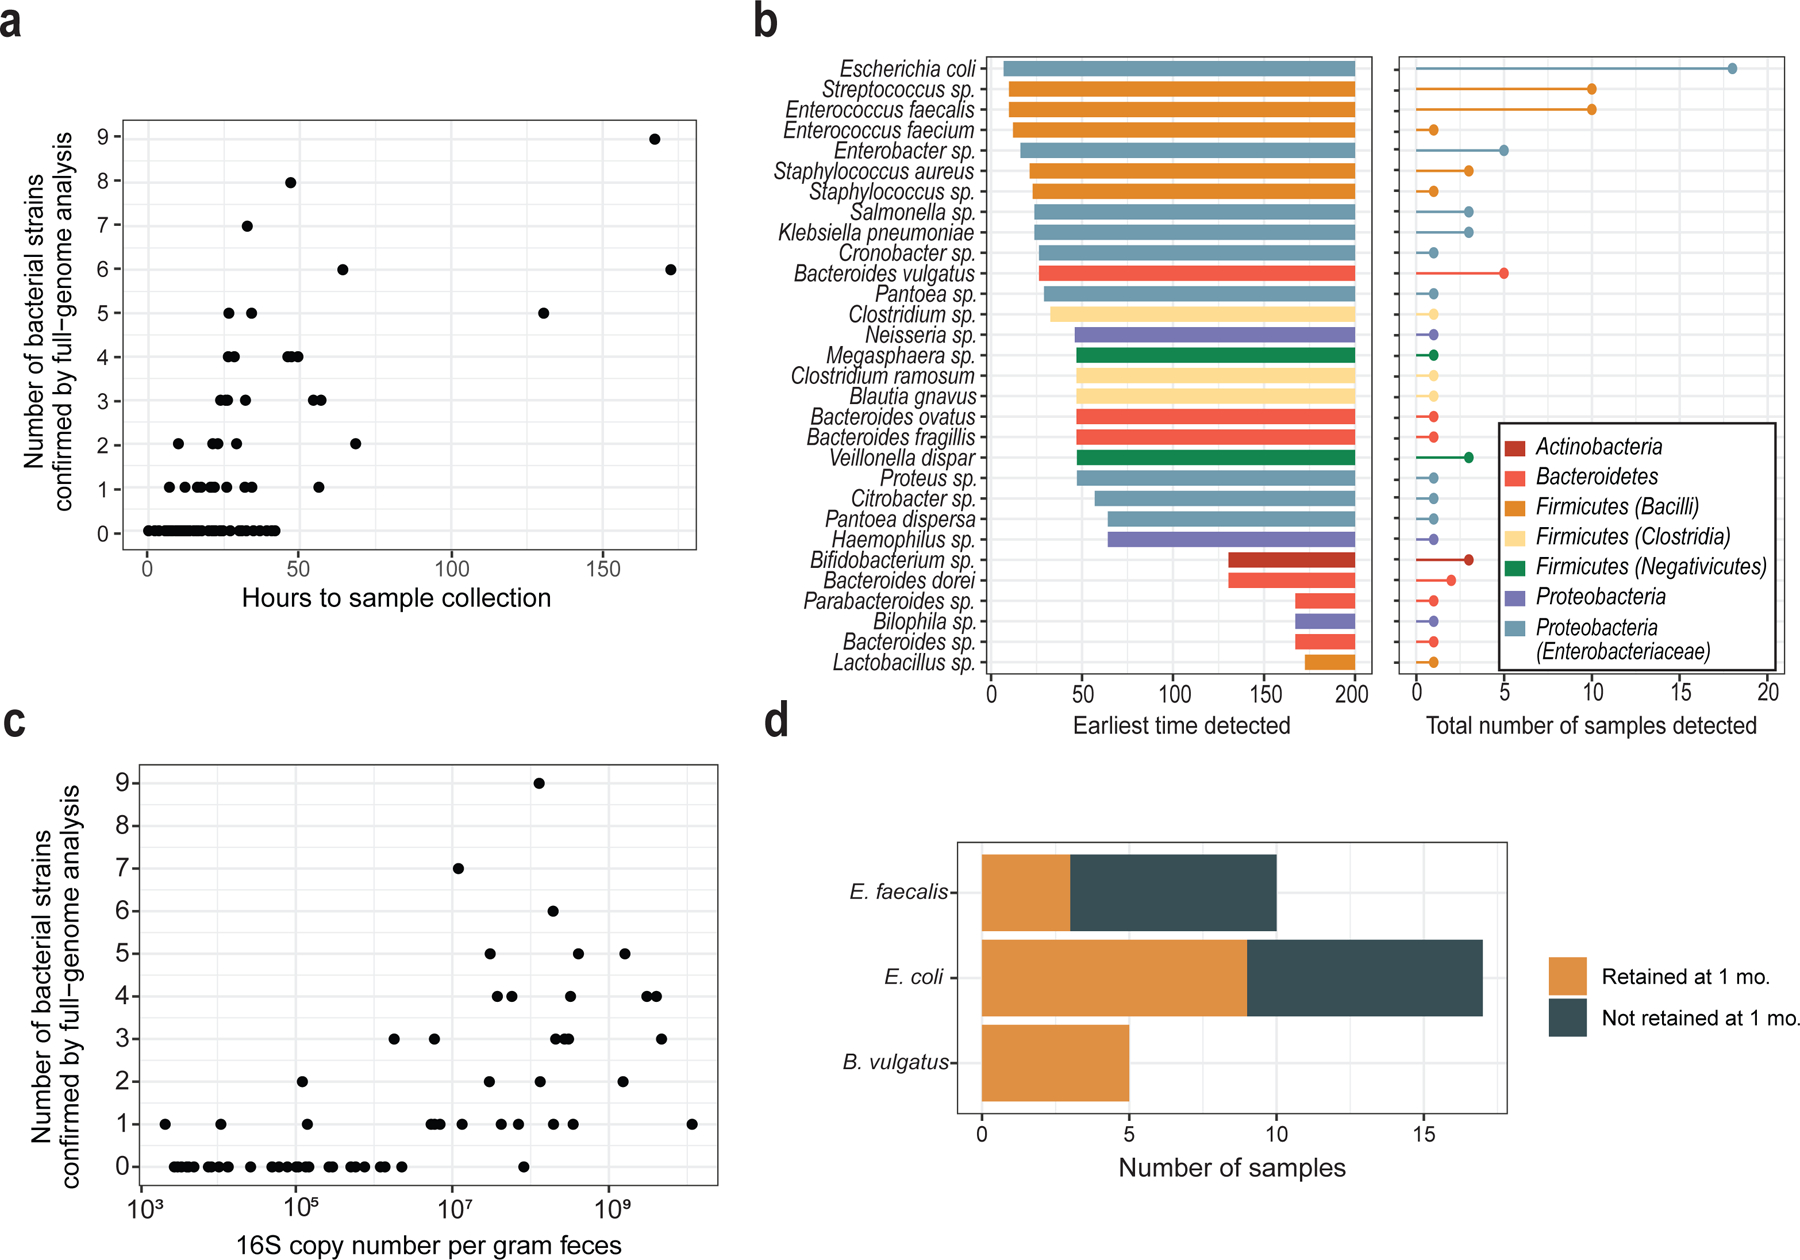
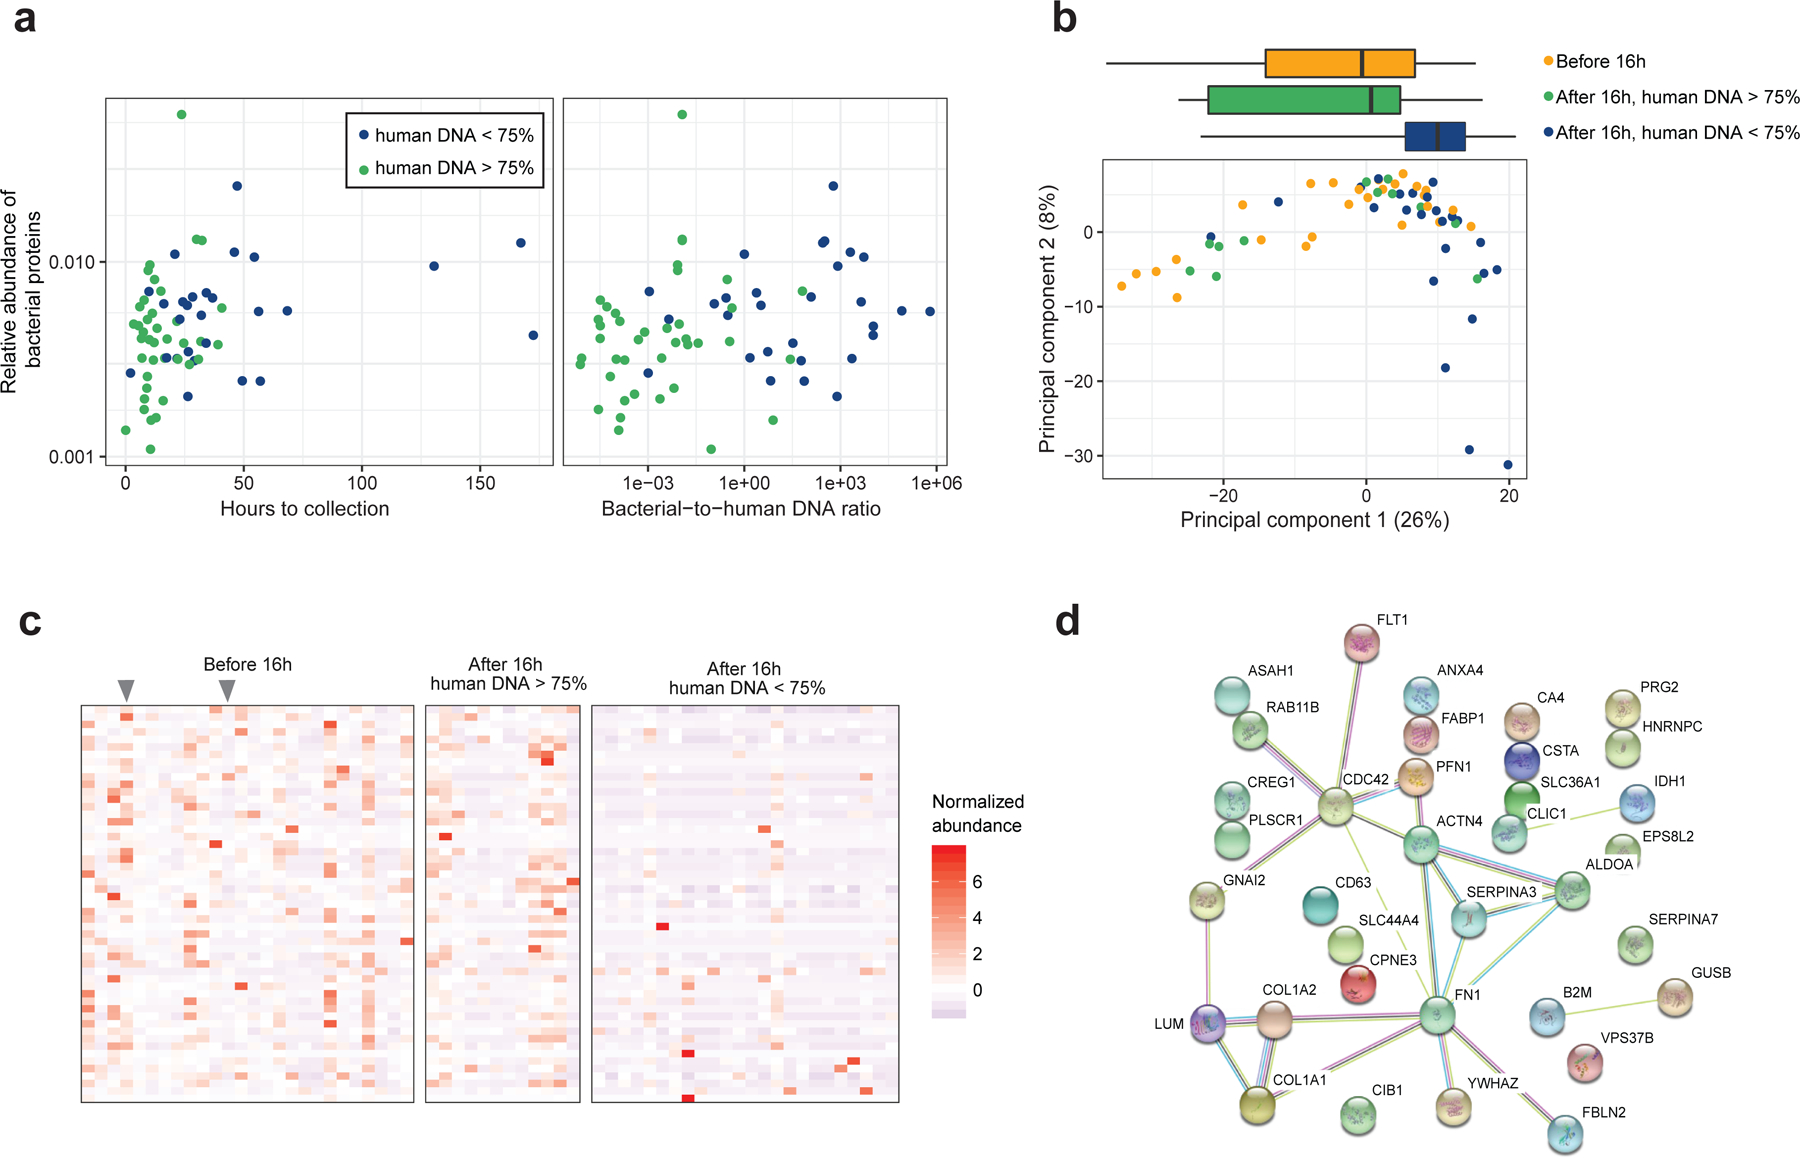
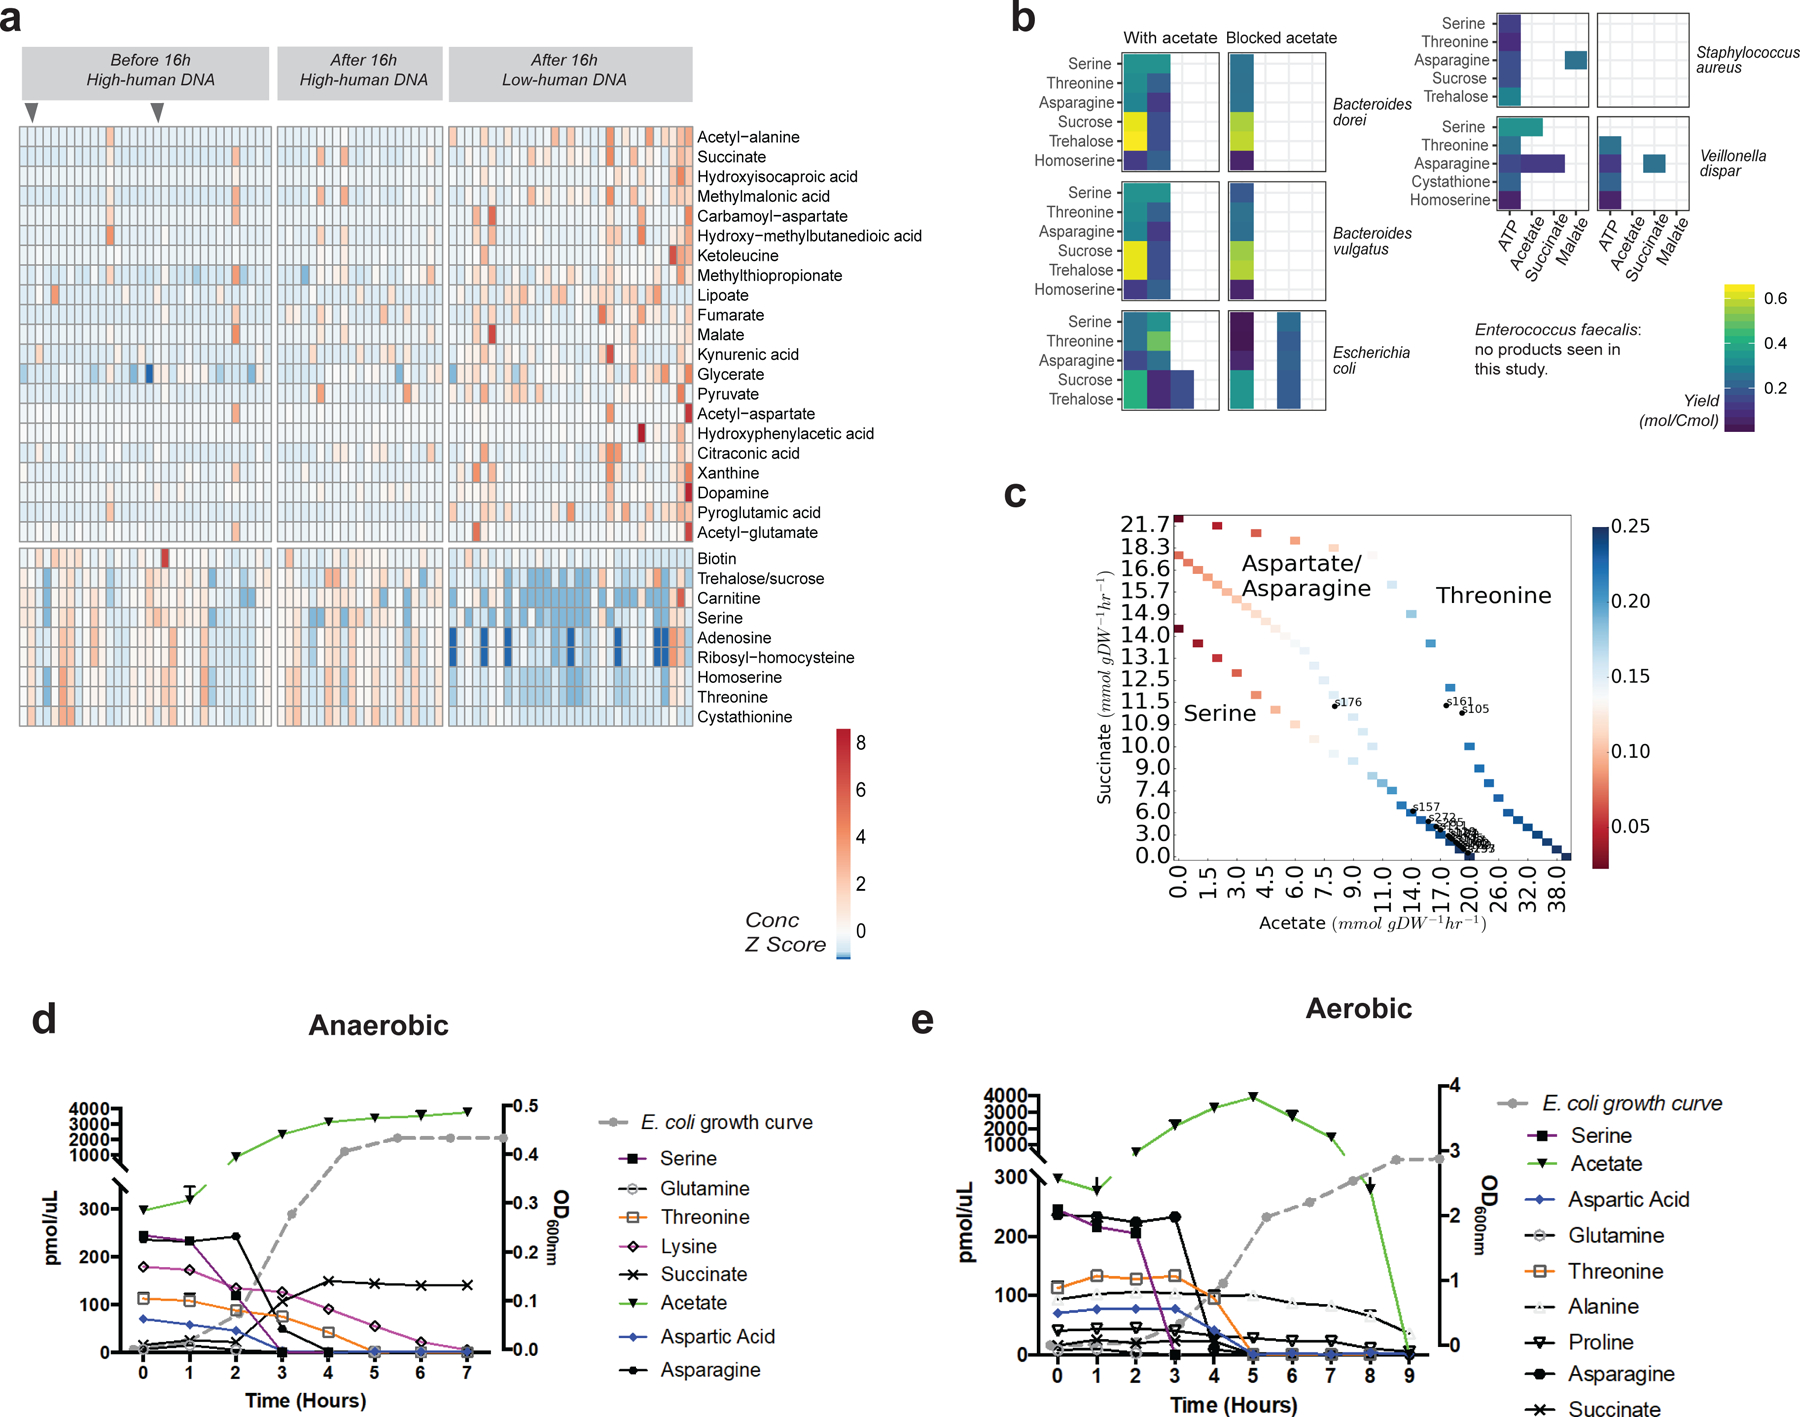
Initial microbial colonization and later succession in the gut of human infants are linked to health and disease later in life. The timing of the appearance of the first gut microbiome, and the consequences for the early life metabolome, are just starting to be defined. Here, we evaluated the gut microbiome, proteome and metabolome in 88 African-American newborns using faecal samples collected in the first few days of life. Gut bacteria became detectable using molecular methods by 16 h after birth. Detailed analysis of the three most common species, Escherichia coli, Enterococcus faecalis and Bacteroides vulgatus, did not suggest a genomic signature for neonatal gut colonization. The appearance of bacteria was associated with reduced abundance of approximately 50 human proteins, decreased levels of free amino acids and an increase in products of bacterial fermentation, including acetate and succinate. Using flux balance modelling and in vitro experiments, we provide evidence that fermentation of amino acids provides a mechanism for the initial growth of E. coli, the most common early colonizer, under anaerobic conditions. These results provide a deep characterization of the first microbes in the human gut and show how the biochemical environment is altered by their appearance.


Conflict of interest statement

Competing Interests

The authors declare no competing interests.

Figures

Extended Data Fig. 1
Extended Data Fig. 1. Microbiota differences between birth and 1 month.
(a) The number of bacterial species increased in the 1 month samples (P = 8×10⁻¹⁶, two-sided Wilcoxon signed-rank test, n = 88 per group). Boxes indicate the median and interquartile distance, whiskers indicate maximum and minimum data points within 1.5 times the interquartile range, points represent values outside this range. (b) The identity of bacterial species was different in samples at 1 month, as quantified by Jaccard distance (R2 = 0.09, P = 0.001, PERMANOVA test with restricted permutations, n1 = 81 samples from birth, n2 = 88 samples from 1 month, 7 birth samples excluded due to no taxonomic assignments). (c) Heatmap of taxa detected in samples collected at 1 month. Taxa were included if the relative abundance was greater than 10% in any sample. (d) Prevalence of bacterial taxa in samples collected at birth and 1 month. Taxa shown were determined to be differentially present or absent by Fisher’s exact test, P < 0.05 after correction for false discovery rate (n = 88 per group, 482 taxa tested, two-sided test).
Extended Data Fig. 2
Extended Data Fig. 2. Abundance of bacterial gene orthologs at birth and 1 month.
. (a) The total number of KEGG gene orthologs per sample was higher at 1 month relative to birth (P = 9×10⁻¹⁶, two-sided Wilcoxon signed-rank test, n = 88 per group). (b) Genes increasing in abundance at 1 month relative to birth (top 100 shown, P < 0.001 after correction for false discovery rate, two-sided Wilcoxon signed-rank test, n = 88 per group). Points show the median value, error bars show the interquartile range. (c) The number of glycoside hydrolase gene types per sample (P = 9×10⁻¹⁶) and total abundance of glycoside hydrolase genes (P = 7×10⁻¹³) in each sample increased from birth to 1 month (two-sided Wilcoxon signed-rank test, n = 88 per group). Boxes indicate the median and interquartile distance, whiskers indicate maximum and minimum data points within 1.5 times the interquartile range, points represent values outside this range.
Extended Data Fig. 3
Extended Data Fig. 3. Correlation of microbiota with mode of delivery.
(a) The mode of delivery was not associated with differences in the number of bacterial species per sample at birth or 1 month (two-sided Mann-Whitney test). (b) The mode of delivery had a small effect on the composition of bacteria present at 1 month, as measured by Jaccard distance (R2 = 0.02, PERMANOVA test), but no effect at birth. (c) Several taxa differed in prevalence according to mode of delivery at 1 month, but were not statistically significant after correction for multiple comparisons (two-sided Fisher’s exact test). No taxa differed in abundance at either time point (two-sided Mann-Whitney test). (d) KEGG gene orthologs associated with mode of delivery in 1 month samples (two-sided Mann-Whitney test, P < 0.05 after correction for false discovery rate). Points with error bars in (d) indicate the median and interquartile range. Boxes in (a) and (c) indicate the median and interquartile distance, whiskers indicate maximum and minimum data points within 1.5 times the interquartile range, points represent values outside this range. Sample size in all tests was n1 = 64 vaginal birth, n2 = 24 c-section.
Extended Data Fig. 4
Extended Data Fig. 4. Association of breastfeeding with bacterial taxa and gene function.
(a) The number of bacterial species decreased with breastfeeding at 1 month, but not at birth (two-sided Mann-Whitney test). Boxes in indicate the median and interquartile distance, whiskers indicate maximum and minimum data points within 1.5 times the interquartile range, points represent values outside this range. (b) Breastfeeding altered the composition of bacterial species present at 1 month but not at birth (PERMANOVA test). (c) The abundance of Bifidobacterium increased with breastfeeding at birth and 1 month (one-sided Mann-Whitney test). (d) Other genera found to differ in abundance with breastfeeding at 1 month (two-sided Mann-Whitney test, corrected for false discovery rate). (e) KEGG gene orthologs differing in abundance with breastfeeding (two-sided Mann-Whitney test, corrected for false discovery rate). Corrected p-values are shown for statistically significant differences. Points with error bars in (e) indicate the median and interquartile range. Sample size at birth was n1 = 19 formula, n2 = 61 breastfed; sample size at 1 month was n1 = 36 formula, n2 = 52 breastfed.
Extended Data Fig. 5
Extended Data Fig. 5. Negative control samples used in metagenomic DNA sequencing.
(a) Bacterial species abundance in negative control samples. (b) Jaccard distance between negative control samples and meconium samples (n1 = 81 meconium samples, n2 = 15 negative control samples, 7 meconium samples excluded due to no taxonomic assignments). (c) Jaccard distance to centroid of negative control samples. The 95% quantile for distance of negative control samples to their own centroid is indicated with a dashed line; 32 meconium samples fell within this distance. (d) Prevalence of species commonly detected in negative controls. For all but E. coli, the species were more prevalent in negative controls than in meconium samples. (e) Stacked bar charts showing prominent taxa in negative controls, birth, and 1 month samples.
Extended Data Fig. 6
Extended Data Fig. 6. Estimation of bacterial-to-human DNA ratio by qPCR.
(a) Absolute quantification of bacterial DNA by 16S qPCR in meconium and negative control samples. (b) Negative correlation of 16S copy number and human DNA percentage in metagenomic sequencing (two-sided test of Spearman correlation, ρ = −0.6, P = 2×10⁻⁹, n = 88). (c) Positive correlation between beta-actin copy number and human DNA percentage (two-sided test of Spearman correlation, ρ = 0.4, P = 3×10⁻⁴, n = 88). (d) Negative correlation between estimated bacterial-to-human DNA ratio and human DNA percentage (two-sided test of Spearman correlation, ρ = −0.8, P = 2×10⁻¹⁶, n = 48, samples were excluded if either measurement was below the limit of detection). The linear regression estimate is indicated with a solid black line and the 95% confidence interval is indicated by the grey area.
Extended Data Fig. 7
Extended Data Fig. 7. Bacterial-to-human DNA ratio associated with time since birth.
(a) Bacterial 16S copy number per gram feces increased with time since birth (two-sided test of Spearman correlation, ρ = 0.5, P = 6×10⁻⁶, n = 85, 3 samples excluded due to no data on time since birth). (b) Bacterial 16S copy number per μL extracted DNA increases with time since birth (two-sided test of Spearman correlation, ρ = 0.5, P = 7×10⁻⁶, n = 85). (c) The bacterial-to-human DNA ratio is higher in samples collected after 16 hours with low human DNA relative to others (two-sided Mann-Whitney test, P = 4×10⁻¹¹, n1 = 32 samples collected after 16 hours with low human DNA, n2 = 53 others). Samples with a bacterial-to-human DNA ratio above unity are labeled with the subject ID. (d) The bacterial-to-human DNA ratio is higher in samples collected
Extended Data Fig. 8
Extended Data Fig. 8. Acetate concentration in meconium samples.
a) The acetate concentration was higher in samples obtained after 16 hours with low human DNA and other groups, and was not different in samples collected before vs. after 16 hours with high human DNA (two-sided Mann-Whitney test, p-values indicated above bars, n1 = 30 collected before 16 hours, n2 = 21 after 16 hours with human DNA > 75%, n3 = 30 after 16 hours with human DNA < 75%). Boxes in indicate the median and interquartile distance, whiskers indicate maximum and minimum data points within 1.5 times the interquartile range, points represent values outside this range. (b) Acetate concentration increased with 16S copy number per gram feces (two-sided test of Spearman correlation, ρ = 0.33, P = 0.002, n = 84). The blue line indicates the linear regression estimate, and the grey area indicates the 95% confidence interval. The dashed vertical line indicates the lower limit of detection for 16S qPCR measurements. Samples with high acetate concentration are labeled. (c) Acetate concentration increased with time since birth (two-sided test of Spearman correlation, ρ = 0.27, P = 0.02, n = 81). The dashed vertical line indicates 16 hours after birth.
Extended Data Fig. 9
Extended Data Fig. 9. Products of aerobic and anaerobic amino acid metabolism in E. coli.
Simulated metabolic flux in E. coli under aerobic and anaerobic conditions. The arrow thickness for a reaction is proportional to the flux flowing through it, with red being the maximum and grey the minimum (equivalent to zero flux).
Extended Data Fig. 10
Extended Data Fig. 10. Summary of data presented for meconium samples and negative controls.
Samples are ordered from top to bottom by time of collection. An empty set symbol (∅) indicates samples that were not submitted for proteomic and metabolomic analysis, due to availability of specimen. The dashed horizontal line indicates 16 hours after birth.
Figure 1:
Figure 1:. Bacterial and human DNA in meconium samples.
(a) Heatmap of bacterial taxa identified in meconium samples, ordered by time since birth. The gap is positioned at 16 hours. The percentage of human DNA in each fecal sample is indicated at the top. (b) Human DNA percentage as a function of time since birth, showing samples with low levels of human DNA appearing after 16 hours. Grey lines represent the logistic regression estimate on either side of the break point at 16 hours, indicated with a vertical dashed line. (c) Estimation of bacterial-to-human DNA ratio by qPCR.
Figure 2:
Figure 2:. Assembly of E. coli metagenomes from meconium samples.
(a) Pan-genome of E. coli detected in meconium, plotted alongside E. coli reference genomes. Each genome is represented as a ring; black areas represent genes present, grey areas represent genes absent. The purple region indicates genes used in the phylogenetic analysis. (b) Phylogenetic tree of E. coli assembled from meconium, showing placement in multiple clades. (c) Principal coordinates ordination of gene content from E. coli pan-genome. (d) Genes found to be more abundant in assemblies from meconium samples. All are of unassigned function. Sample size: n1=17 genomes from this study, n2=33 reference genomes.
Figure 3:
Figure 3:. Bacterial strains in meconium and their retention at 1 month.
(a) The number of bacterial strains in each sample, as determined by analysis of single-copy core genes in metagenomic assembly results. (b) The time of earliest detection and prevalence of bacterial species in meconium samples. (c) Correlation of bacterial strain number with absolute quantity of bacterial DNA by 16S qPCR. (d) Retention of meconium strains at 1 month.
Figure 4:
Figure 4:. Proteomics of meconium samples.
(a) The relative abundance of bacterial proteins increases with time to collection and bacterial-to-human DNA ratio. (b) Principal components analysis of protein concentrations in meconium samples (n1 = 26 before 16h, n2 = 12 after 16h, human DNA > 75%, n3 = 24 after 16h, human DNA < 75%). Boxes above the ordination show the median and interquartile range of groups along the first principal component; whiskers above the ordination extend to the full range of data points. (c) Proteins differing in abundance between the three groups. Grey arrows indicate samples collected before 16 hours with low levels of host DNA. (d) STRING network of differentially abundant proteins. Circles represent proteins. Colored lines connecting proteins indicate interactions from curated databases (cyan), experimentally verified interactions (magenta), and associations based on text mining (yellow), co-expression (black), and homology (slate blue).
Figure 5:
Figure 5:. Metabolomics of meconium samples and E. coli amino acid utilization.
(a) Heatmap of metabolites found to differ in abundance between the three groups. Arrows at top indicate samples collected before 16 hours with low levels of host DNA. The top part of the chart shows metabolites increased in samples collected after 16 hours with low levels of host DNA, such as succinate and pyruvate. The bottom part of the chart shows metabolites decreasing in abundance, such as serine, and threonine. Grey arrows indicate samples collected before 16 hours with low levels of host DNA. (b) Predicted ATP production and metabolite product flux for substrates identified in meconium samples. (c) Predicted amino acid utilization by E. coli at various concentrations of acetate and succinate. (d and e) Amino acid utilization and acetate/succinate production of E. coli grown under (d) anaerobic and (e) aerobic conditions.

Comment in

Similar articles

Cited by

References

    1. Yatsunenko T et al. Human gut microbiome viewed across age and geography. Nature 486, 222–227 (2012). - PMC - PubMed
    1. Stewart CJ et al. Temporal development of the gut microbiome in early childhood from the TEDDY study. Nature 562, 583–588 (2018). - PMC - PubMed
    1. Yassour M et al. Natural history of the infant gut microbiome and impact of antibiotic treatment on bacterial strain diversity and stability. Sci. Transl. Med 8, 343ra81 (2016). - PMC - PubMed
    1. Bokulich NA et al. Antibiotics, birth mode, and diet shape microbiome maturation during early life. Sci. Transl. Med 8, 343ra82 (2016). - PMC - PubMed
    1. Wang J et al. Dysbiosis of maternal and neonatal microbiota associated with gestational diabetes mellitus. Gut 67, 1614–1625 (2018). - PMC - PubMed

Publication types