. 2020 May;52(5):516-524.
doi: 10.1038/s41588-020-0607-4. Epub 2020 Apr 13.

Genome sequence of Gossypium herbaceum and genome updates of Gossypium arboreum and Gossypium hirsutum provide insights into cotton A-genome evolution

Affiliations

Genome sequence of Gossypium herbaceum and genome updates of Gossypium arboreum and Gossypium hirsutum provide insights into cotton A-genome evolution

Gai Huang et al. Nat Genet. 2020 May.

Abstract

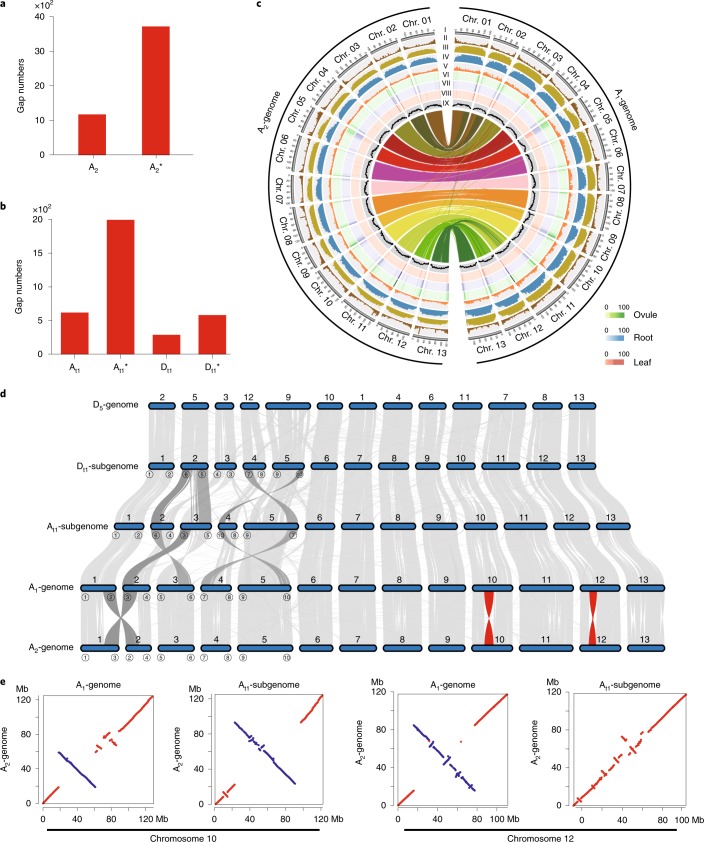
Upon assembling the first Gossypium herbaceum (A1) genome and substantially improving the existing Gossypium arboreum (A2) and Gossypium hirsutum ((AD)1) genomes, we showed that all existing A-genomes may have originated from a common ancestor, referred to here as A0, which was more phylogenetically related to A1 than A2. Further, allotetraploid formation was shown to have preceded the speciation of A1 and A2. Both A-genomes evolved independently, with no ancestor-progeny relationship. Gaussian probability density function analysis indicates that several long-terminal-repeat bursts that occurred from 5.7 million years ago to less than 0.61 million years ago contributed compellingly to A-genome size expansion, speciation and evolution. Abundant species-specific structural variations in genic regions changed the expression of many important genes, which may have led to fiber cell improvement in (AD)1. Our findings resolve existing controversial concepts surrounding A-genome origins and provide valuable genomic resources for cotton genetic improvement.


Conflict of interest statement

The authors declare no competing interests.

Figures

Fig. 1
Fig. 1. Distribution of genomic components of A1 and A2 across chromosomes and chromosomal variant events within the Gossypium lineage.
a,b, Statistics of gap numbers in the assembly of A2- (a) and (AD)1- (b) genomes. A2*, previously released A2-genome; At1* and Dt1* represent the At1- and Dt1-subgenome, respectively, of recently released (AD)1-genome. c, Multi-dimensional display of genomic components of A1- and A2-genomes. The density was calculated per 1 Mb. I, the 13 chromosomes; II, gene density; III−V, coverage by TE, Gypsy and Copia, respectively; VI−VIII, transcriptional state in the ovule at 10 DPA and in root and leaf tissue, respectively. Transcript levels were estimated based on the average depth of mapped RNA reads in nonoverlapping 1-Mb windows. IX, GC content. d, Characterization of genomic variations in Gossypium. Genic synteny blocks are connected by gray lines. Reciprocal translocations and two large inversions are highlighted by dark gray and red links, respectively. e, Synteny maps using whole-genome alignments show that the inversion in chromosome 10 exists in either A1 or At1, whereas the one in chromosome 12 is found only in A1. Genomic homologous blocks ≥ 20 kb are drawn in the plots. Chr, chromosome.
Fig. 2
Fig. 2. The evolution of the allotetraploid cotton genome.
a, Inferred phylogenetic analysis among Gossypium and other eudicot plants. b, Summary of phylogenetic analysis with the approximately unbiased test in 10-kb windows. c, Distribution of Ks values for orthologous genes among cotton genomes. Peak values for each comparison are indicated in the parentheses. d, Comparisons of identical sites in orthologous genes. Violin plots summarize the distribution of identical sites. The center line in each box indicates the median, and the box limits indicate the upper and lower quartiles of divergence (n = 20 types of synonymous mutation). P values were derived with Student’s t-test. e, Phylogenetic and ancestral allele analysis based on SNPs. The red, blue and green triangles represent the collapsed 21 A2 accessions, 14 A1 accessions and 30 (AD)1 accessions, respectively. The percentage value indicates the percentage of ancestral alleles for each species that were identical to those of the D5-genome. f, Number of nucleotide variations in A1 or A2 compared with At1 across the chromosomes. g, A model for the formation of allotetraploid cotton showing fiber phenotypes from the (AD)1 (accession TM-1), the D5, the A1 (var. africanum) and the A2 (cv. Shixiya1). Scale bar, 5 mm. h, A schematic map of the evolution of cotton genomes. Major evolutionary events are shown in dashed boxes. Source data
Fig. 3
Fig. 3. Geographic distribution and population analysis of the A1 and A2 accessions.
a, Geographic distribution of the collected A1 and A2 accessions. Green, red and yellow dots represent A1 accessions and A2 accessions collected in China and outside of China, respectively. The map was drawn using the maptools package (http://maptools.r-forge.r-project.org/). b, PCA plots of the first three components for A1 and A2 accessions. Dot colors are the same as in a. c, Analysis of genetic relationship between all A1 and A2 accessions. The upper and lower panels show the phylogenetic tree based on whole-genome SNP studies and population structure of all accessions based on different numbers of clusters (K = 2–3), respectively. Branch colors are the same as in a. CHG, A2 accessions from the China group; IPG, A2 accessions from the India and Pakistan group. d, Average weightings for the three possible topologies in whole genomes. e, Weightings for all three topologies described in d across chromosome 7 using sliding windows. f, Population divergence (FST) across the three groups described in c. g, Phylogenetic analysis based on SNPs. The yellow and green triangles represent the collapsed 67 A2 accessions and 12 A1 accessions, respectively. Two A1 var. africanum accessions (Ghe01 and Ghe04) gathered at the root of the 12 A1 accessions. PC1, the first principal component (PC); PC2, the second PC; PC3, the third PC.
Fig. 4
Fig. 4. Genome expansions in sequenced Malvales plants, particularly in cotton, and quantitative and comprehensive analysis of LTRs, especially Gypsy-type.
a, Genome size expansion is highly correlated with TE amplification bursts (R2 = 0.978). The red line shows the linear relationship between genome size and TE content. b, Genomic component comparisons among genome-sequenced Malvales plants. c, Analysis of intact LTR numbers and insertion time in Malvales plants. d, Classification of intact LTRs in the A2-genome. LTR families with a copy number of ≥100 are shown. e, Identity distribution pattern of TE hits presented as a dot-plot. The most recent LTR/Gypsy sequence of LTR families was selected as the representative sequence for detecting additional TE hits in the genomes. A total of 262,377 dots in D5, 585,658 in Dt1, 3,541,372 in At1, 4,218,810 in A1 and 5,035,006 in A2 were drawn in the dot-plot. P1–P5 represent the identified five distinct bursts in different cotton genomes. f, Number of TE hits for the representative sequence and their associated identity values. The estimated burst time based on GPDF fitting of each peak is marked. The five peaks, P1–P5, defined in e are highlighted by shaded gray columns. LINE, long interspersed nuclear elements; SINE, short interspersed nuclear elements.
Fig. 5
Fig. 5. SV analysis among At1, A1 and A2.
a, Comparisons of fiber elongation patterns. The center line in each box indicates the median, and the box limits indicate the upper and lower quartiles (n = 30 seeds). b, SVs of two A-genomes compared with the At1-subgenome. c, Annotation of identified common SVs in genic regions. Up-/downstream, 5 kb regions from the start or stop codons. d, Volcano plots for A2~At1 gene expression in elongating fibers at 15 DPA. Each hollow point represents a gene and genes with SVs within 5 kb of their start or stop codons are indicated by a triangle. Dashed lines show the thresholds (P ≤ 0.001 and twofold change between A2 and At1). e, Gene ontology enrichment of significant differentially expressed genes with SVs (P ≤ 0.01). f, Upregulated genes in fatty acid biosynthetic process. Red items, upregulated genes in At1 relative to A2 at 15 DPA. g, RT–qPCR analysis of upregulated genes in fatty acid biosynthetic pathway in elongating fibers at 5–20 DPA. UBQ7 was used as a normalization control (mean ± s.d, n = 3 independent experiments). h, Cotton fibers of the WT (G. hirsutum cv. Zhong24) and the transgenic lines expressing KCS6 gene under control of the CaMV 35S promoter (L241-1, L241-2 and L241-3) or E6 promoter (L245-1). The averaged fiber lengths with standard errors are denoted under each cotton line using Student’s t-test. Scale bar, 5 mm. i, RT–qPCR analysis of three upregulated potential transcription factor genes in elongating fibers at 5–20 DPA (mean ± s.d., n = 3 independent experiments). WT, wild type. Source data
Extended Data Fig. 1
Extended Data Fig. 1. High correlation of chromosome-scale assembled A1, A2 and (AD)1 genomes with Hi-C data.
a, Hi-C contact data from A1 mapped on the assembled A1-genome. b, Hi-C contact data from A2 mapped on the improved A2-genome. c, Hi-C contact data from (AD)1 mapped on the improved (AD)1-genome. The heat map represents the normalised contact matrix. The strongest and weakest contacts are shown in red and grey, respectively.
Extended Data Fig. 2
Extended Data Fig. 2. Gene synteny among our assembled A1, A2, (AD)1 genomes and previously released D5-genome sequences.
a, Dot plot showing gene synteny between A1 and A2 genomes. b, Dot plot showing gene synteny between A1 and D5 genomes. c, Dot plot showing gene synteny between A1 and the two subgenomes of (AD)1. d, Dot plot showing gene synteny between A2 and the two subgenomes of (AD)1. e, Dot plot showing gene synteny between A2 and D5 genomes. f, Dot plot showing gene synteny between D5 and two subgenomes of (AD)1.
Extended Data Fig. 3
Extended Data Fig. 3. Comparisons of the updated At1-subgenome with a previously reported genetic map.
am, Genetic versus physical map distance of the 13 chromosomes of the At1-subgenome in (AD)1. A01−A13 (a to m, respectively), the chromosomes of the At1-subgenome. The x and y axes represent the physical sequences (in megabases) and genetic distances (in centimorgans), respectively.
Extended Data Fig. 4
Extended Data Fig. 4. Comparisons of the updated Dt1-subgenome with a previously reported genetic map.
a-m, Genetic versus physical map distance of the 13 chromosomes of the Dt1-subgenome in (AD)1. D01−D13 (a to m, respectively), the chromosomes of the Dt1-subgenome. The x and y axes represent the physical sequences (in megabases) and genetic distances (in centimorgans), respectively.
Extended Data Fig. 5
Extended Data Fig. 5. Hi-C data and PCR amplification validate the border of two large inversions in chromosomes 10 and 12 between A1 and A2 genomes.
a, b, Identification of the ~42.9-Mb large inversion in chromosome 10 (a) and ~61.6-Mb large inversion in chromosome 12 (b) by Hi-C data. The upper heatmap shows a chromatin interaction matrix that maps Hi-C data from A2 against the A2-genome (A2 map to A2), and maps Hi-C data from A1 against the A2-genome (A1 map to A2). The middle panel shows a diagram of the inversion region with the four red dots representing the inversion borders. The lower heatmap shows a chromatin interaction matrix that maps Hi-C data from A1 against the A1-genome (A1 map to A1) and maps Hi-C data from A2 against the A1-genome (A2 map to A1). c, d, Validation of inversion borders in chromosomes 10 (c) and 12 (d) by PCR amplification. The forward and reverse primer sequences are shown in Supplementary Table 16. The unprocessed gel for the cropped images are presented in source data. Source data
Extended Data Fig. 6
Extended Data Fig. 6. Phylogenetic relationship among A1, A2 and A-subgenome.
a, Distribution of mean recombination rates in protein-coding genes with available recombination rates (n = 240 genes). b, Proportion of genes with 0-20% and 80-100% of recombination rates supporting the three trees. c, Summary of phylogenetic analysis with the AU test in 10 kb windows among A1, A2, At2, D5.
Extended Data Fig. 7
Extended Data Fig. 7. A phylogenetic tree based on SNPs in the genomes with D5-genome as the outgroup.
Units (as measured by the indicated scale) show the percentage of represented polymorphic sites that differed between two individuals. Detail information of cotton accessions were described in Supplementary Table 4.
Extended Data Fig. 8
Extended Data Fig. 8. Topology weighting for A1 and A2 populations.
a, Three possible taxon topologies for A1, A2 from China group (CHG) and A2 mostly from India and Pakistan group (IPG) with D5 as the outgroup. b-n, Weightings for all three topologies plotted across the 13 chromosomes. Colour for each topology corresponds to coloring in a.
Extended Data Fig. 9
Extended Data Fig. 9. The burst of LTR/Gypsy amplification fits a Gaussian distribution and allows time estimation of burst events.
a-e, GPDF modeling data fit well with the actual TE bursts found in A1 with R2 from 0.86–0.99 (a), A2 with R2 from 0.86–0.98 (b), D5 with R2=0.94 (c), At1 with R2 from 0.95–0.99 (d) and Dt1 with R2 from 0.91–0.93 (e). The estimated time of the LTR/Gypsy burst event associated with each genome or subgenome is shown in the graphs. The peak width was defined as 2.58σ that covers >99.5% of the nucleotide substitution events in TEs.
Extended Data Fig. 10
Extended Data Fig. 10. Volcano plots for A1-At1 gene expression in elongating fibers at 15 DPA.
Each hollow point represents a gene and genes with SVs within 5 kb of their start or stop codons are indicated by a triangle. The dashed lines show the thresholds (P-value ≤ 0.001 and two-fold change).

References

    1. Wu Z, et al. Cotton functional genomics reveals global insight into genome evolution and fiber development. J. Genet. Genomics. 2017;44:511–518. - PubMed
    1. Ma Z, et al. Resequencing a core collection of upland cotton identifies genomic variation and loci influencing fiber quality and yield. Nat. Genet. 2018;50:803–813. - PubMed
    1. Senchina DS, et al. Rate variation among nuclear genes and the age of polyploidy in Gossypium. Mol. Biol. Evol. 2003;20:633–643. - PubMed
    1. Webber JM. Cytogenetic notes on cotton and cotton relatives. II. Science. 1936;84:378. - PubMed
    1. Zahn LM. Unraveling the origin of cotton. Science. 2012;335:1148.

Publication types