. 2020 Aug;38(8):980-988.
doi: 10.1038/s41587-020-0480-9. Epub 2020 Apr 13.

Sci-fate characterizes the dynamics of gene expression in single cells

Affiliations

Sci-fate characterizes the dynamics of gene expression in single cells

Junyue Cao et al. Nat Biotechnol. 2020 Aug.

Abstract

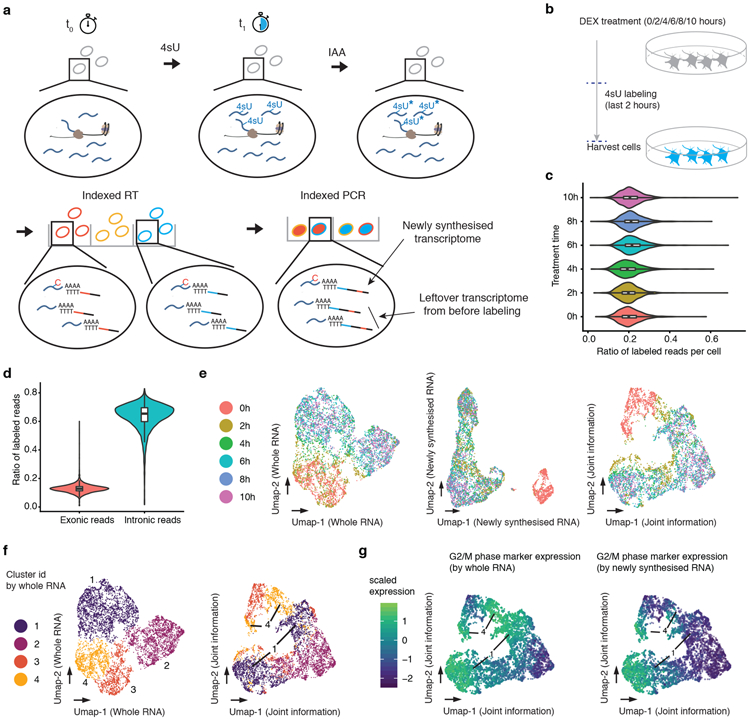
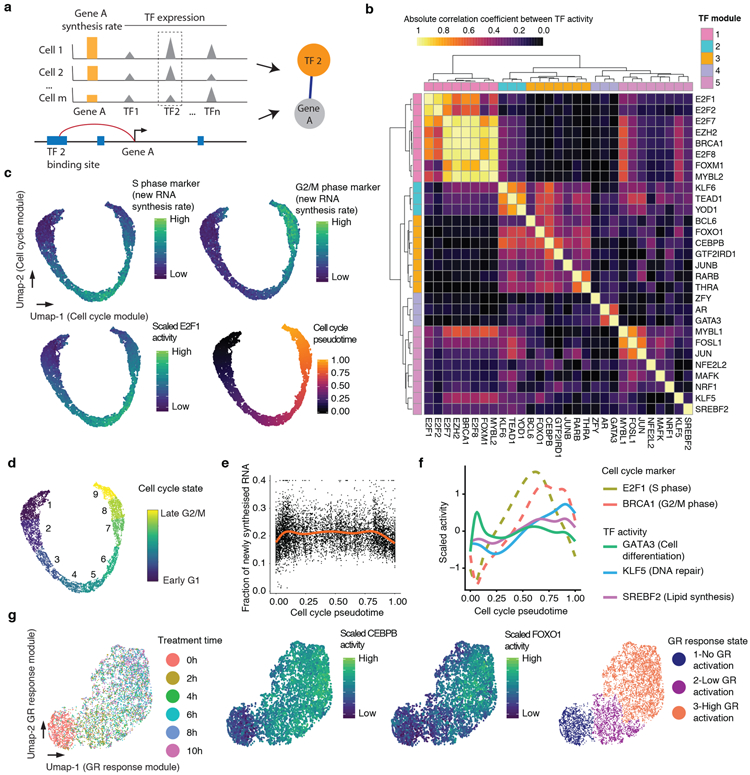
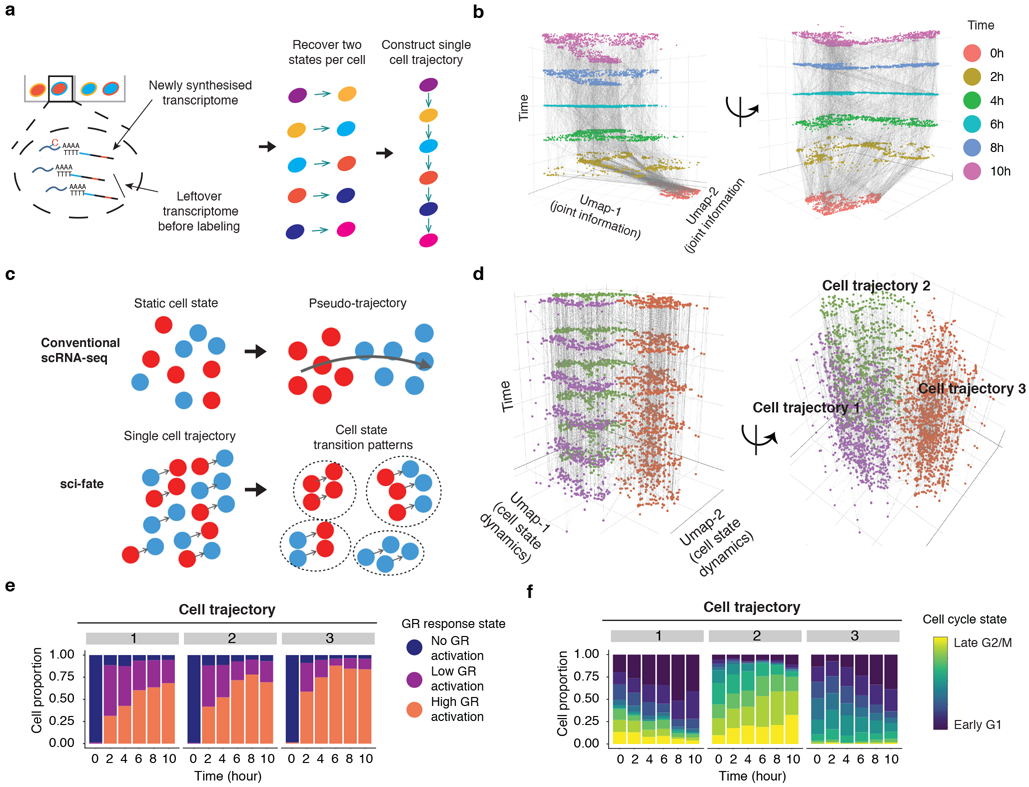
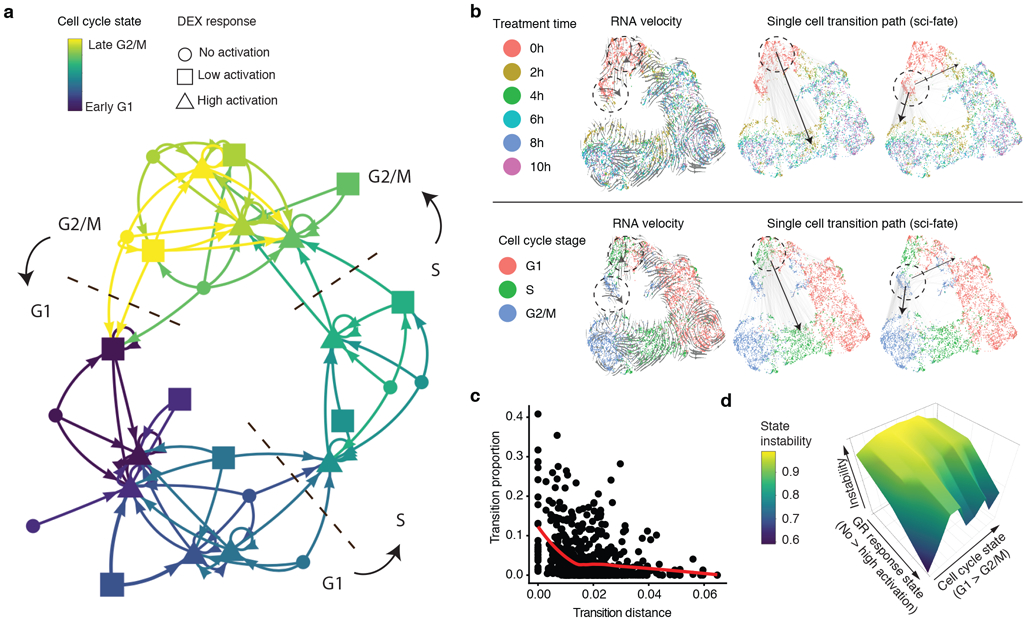
Gene expression programs change over time, differentiation and development, and in response to stimuli. However, nearly all techniques for profiling gene expression in single cells do not directly capture transcriptional dynamics. In the present study, we present a method for combined single-cell combinatorial indexing and messenger RNA labeling (sci-fate), which uses combinatorial cell indexing and 4-thiouridine labeling of newly synthesized mRNA to concurrently profile the whole and newly synthesized transcriptome in each of many single cells. We used sci-fate to study the cortisol response in >6,000 single cultured cells. From these data, we quantified the dynamics of the cell cycle and glucocorticoid receptor activation, and explored their intersection. Finally, we developed software to infer and analyze cell-state transitions. We anticipate that sci-fate will be broadly applicable to quantitatively characterize transcriptional dynamics in diverse systems.


Figures

Fig. 1.
Fig. 1.. Sci-fate enables joint profiling of whole and newly synthesized transcriptomes.
(a) The sci-fate workflow. Key steps are outlined in text. (b) Experimental scheme. A549 cells were treated with dexamethasone for varying amounts of time ranging from 0 to 10 hrs. Cells from all treatment conditions were labeled with 4sU two hours before harvest for sci-fate. (c) Violin plot showing the fraction of 4sU labeled reads per cell for each of the six treatment conditions. Cell number n = 1,054 (0h), 1,049 (2h), 949 (4h), 1,262 (6h), 1,041 (8h), and 1,325 (10h). For all violin plots in this figure: thick lines in the middle, medians; upper and lower box edges, first and third quartiles, respectively; whiskers, 1.5 times the interquartile range; circles, outliers. (d) Violin plot showing the fraction of 4sU labeled reads per cell (n = 6,680), split out by the subsets that map to exons vs. introns. (e) UMAP visualization of A549 cells (n = 6,680) based on their whole transcriptomes (left), newly synthesized transcriptomes (middle) or with joint analysis, i.e. combining the top PCs from each (right). (f) Same as left and right of panel e, respectively, but colored by cluster id from UMAP based on whole transcriptomes. (g) Same as right of panel e, but colored by normalized expression of G2/M marker genes by their overall expression levels (left) or their levels of newly synthesized transcripts (right). UMI counts for these genes are scaled by library size, log-transformed, aggregated and then mapped to Z-scores.
Fig. 2.
Fig. 2.. Characterizing TF modules driving concurrent, dynamic gene regulatory processes in populations of single cells.
(a) Schematic of approach used to identify links between TFs and their regulated genes. (b) Heatmap showing the absolute Pearson’s correlation coefficient between the activities of pairs of TFs (Cell number n = 6,680). (c) UMAP visualization of A549 cells (n = 6,680) based on the activity of cell cycle-related TF module, colored by levels of newly synthesized mRNA corresponding to S phase markers (top left), G2/M phase markers (top right), and E2F1 activity (bottom left). Bottom right panel is colored by pseudotime based on point position on the principal curve estimated by princurve package. (d) Same as panel c, but colored according to nine cell cycle states defined by unsupervised clustering analysis. In broad terms, cell cycle states 1-3 correspond to G1 phase, 4-6 to S phase, and 7-9 to G2/M phase. (e) Scatter plot showing the changes in the fraction of newly synthesized mRNA in each cell (n = 6,680) along cell cycle progression. The red line is the smoothed curve estimated by the geom_smooth function. (f) Similar to panel e, but showing smoothed activity of selected TF modules as a function of cell cycle pseudotime. (g) UMAP visualization of A549 cells (n = 6,680) based on the activity of GR response-related TF module, colored by DEX treatment time (left), CEBPB or FOXO1 activity (middle panels), or cluster id from unsupervised clustering (right). Throughout figure, to calculate TF module activity, newly synthesized UMI counts for genes linked to module-assigned TFs are scaled by library size, log-transformed, aggregated and then mapped to Z-scores.
Fig. 3.
Fig. 3.. Inferring single cell transcriptional dynamics with sci-fate.
(a) Schematic of approach for linking cells based on estimated past transcriptional states to reconstruct single cell transition trajectories. (b) 3D plot of all cells (cell number n = 6,680). The x and y coordinates correspond to the joint information UMAP space shown in the rightmost panel of Fig. 1e. The z coordinate as well as colors correspond to DEX treatment time. Linked parent and child cells are connected with grey lines. (c) Schematic comparing conventional scRNA-seq and sci-fate for cell trajectory analysis. (d) Similar to panel b, except the x and y coordinates correspond to the UMAP space based on the single cell transition trajectories across the six time points (cell number n = 6,680). (e-f) Barplots showing the contributions of the 3 GR response states (e) and the 9 different cell cycle states (f) to each of three cell trajectory clusters.
Fig. 4.
Fig. 4.. Constructing a state transition network for GR response and cell cycle.
(a) Cell state transition network. The nodes are 27 cell states characterized by combinations of cell cycle and GR activation states. The links represents frequent cell state transition trajectories (transition proportion > 10%) between cell states. This threshold for defining a link corresponds to approximately two standard deviations from the mean transition proportion calculated after permuting cell transition links (n = 729). (b) The x and y coordinates correspond to the joint information UMAP space shown in the rightmost panel of Fig. 1e, colored by DEX treatment time (top) or inferred cell cycle state (bottom). Grey lines represent inferred cell state transition links between parent and child cells (left: cell state transition links starting from cells at the S phase and no GR activation stage (Link number n = 433); right: cell state transition links starting from cells at G2/M phase and no GR activation stage (Link number n = 365)). Black arrows show main cell state transition directions. (c) Scatter plot showing the relationship between transition distance (Pearson’s distance) and transition proportion (n = 729), together with the red LOESS smoothed line by ggplot2. (d) 3D plot showing the cell state stability landscape. X-axis represents GR response states (from no to low to high activation state). Y-axis represents the cell cycle states ordered from G1 to G2/M. Z-axis represents cell state instability, defined as the proportion of cells inferred to be moving out of a given state between time points.

References

    1. Trapnell C et al. The dynamics and regulators of cell fate decisions are revealed by pseudotemporal ordering of single cells. Nat. Biotechnol 32, 381–386 (2014). - PMC - PubMed
    1. Qiu X et al. Reversed graph embedding resolves complex single-cell trajectories. Nat. Methods 14, 979–982 (2017). - PMC - PubMed
    1. Wolf FA et al. PAGA: graph abstraction reconciles clustering with trajectory inference through a topology preserving map of single cells. Genome Biol. 20, 59 (2019). - PMC - PubMed
    1. Haghverdi L, Büttner M, Wolf FA, Buettner F & Theis FJ Diffusion pseudotime robustly reconstructs lineage branching. Nat. Methods 13, 845–848 (2016). - PubMed
    1. Setty M et al. Wishbone identifies bifurcating developmental trajectories from single-cell data. Nat. Biotechnol 34, 637–645 (2016). - PMC - PubMed

Methods-only References

    1. Muhar M et al. SLAM-seq defines direct gene-regulatory functions of the BRD4-MYC axis. Science 360, 800–805 (2018). - PMC - PubMed
    1. Dobin A et al. STAR: ultrafast universal RNA-seq aligner. Bioinformatics 29, 15–21 (2013). - PMC - PubMed
    1. Lindenbaum P JVarkit: java-based utilities for Bioinformatics. figshare (2015).
    1. FelixKrueger. FelixKrueger/TrimGalore. GitHub https://github.com/FelixKrueger/TrimGalore.
    1. Li H et al. The Sequence Alignment/Map format and SAMtools. Bioinformatics 25, 2078–2079 (2009). - PMC - PubMed

Publication types