. 2020 May;26(5):769-780.
doi: 10.1038/s41591-020-0815-6. Epub 2020 Apr 13.

Large-scale proteomic analysis of Alzheimer's disease brain and cerebrospinal fluid reveals early changes in energy metabolism associated with microglia and astrocyte activation

Affiliations

Large-scale proteomic analysis of Alzheimer's disease brain and cerebrospinal fluid reveals early changes in energy metabolism associated with microglia and astrocyte activation

Erik C B Johnson et al. Nat Med. 2020 May.

Abstract

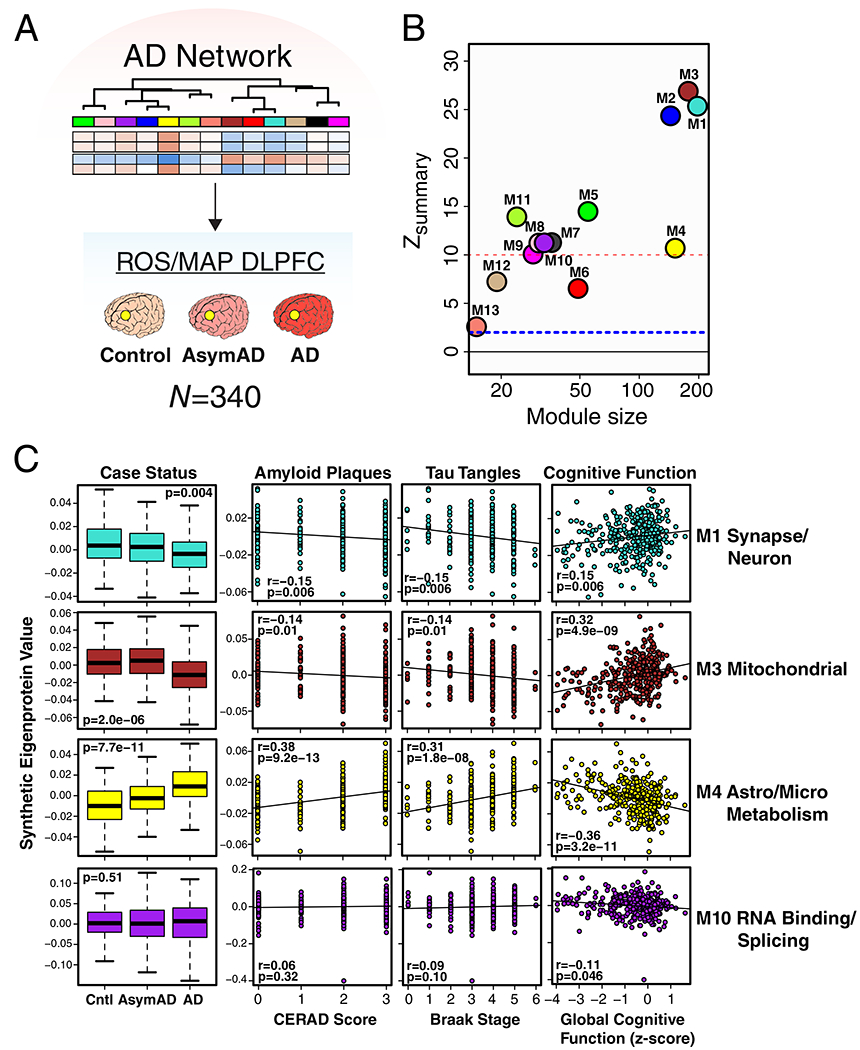
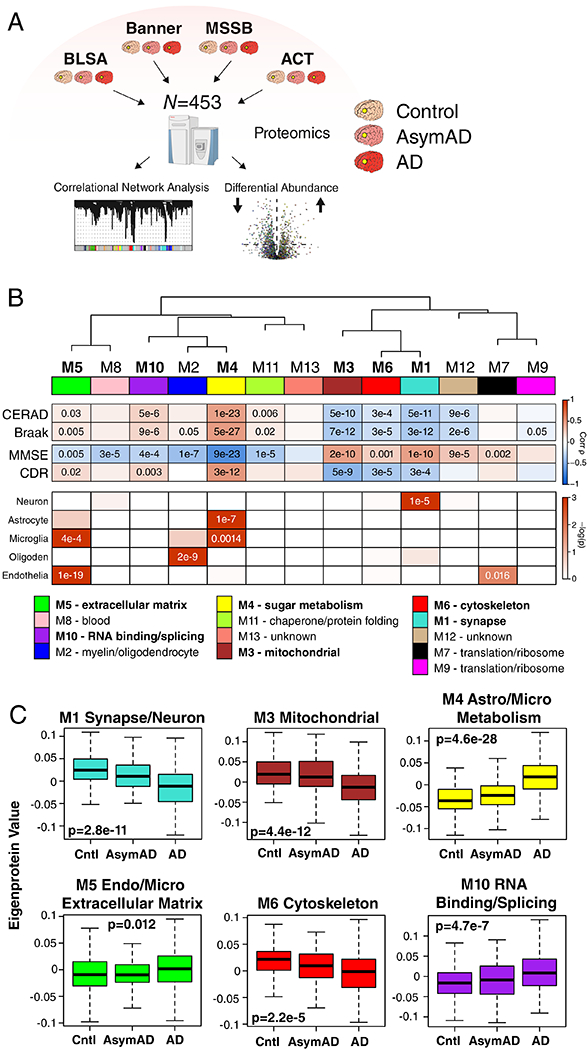
Our understanding of Alzheimer's disease (AD) pathophysiology remains incomplete. Here we used quantitative mass spectrometry and coexpression network analysis to conduct the largest proteomic study thus far on AD. A protein network module linked to sugar metabolism emerged as one of the modules most significantly associated with AD pathology and cognitive impairment. This module was enriched in AD genetic risk factors and in microglia and astrocyte protein markers associated with an anti-inflammatory state, suggesting that the biological functions it represents serve a protective role in AD. Proteins from this module were elevated in cerebrospinal fluid in early stages of the disease. In this study of >2,000 brains and nearly 400 cerebrospinal fluid samples by quantitative proteomics, we identify proteins and biological processes in AD brains that may serve as therapeutic targets and fluid biomarkers for the disease.


Conflict of interest statement

Competing Interests

The authors declare no competing interests.

Figures

Extended Data Figure 1.
Extended Data Figure 1.. Analysis of Missing Protein Quantitative Measurements and their Effect on the AD Network.
(A-D) The percentage of quantified proteins with a given level of missing quantitative measurements was analyzed for both the consensus LFQ and ROS/MAP TMT networks (A). Each bar represents a bin of 2%. The red line indicates the 50% missing measurement threshold used in this study. The total number of quantified proteins for each dataset, and the percentage of quantified proteins removed due to ≥50% missing measurements prior to construction of the respective protein networks, is provided in the legend. (B) The effect of missing value threshold on AD network modules. The AD network was constructed using different allowed levels of missing protein measurements. Preservation of AD network modules (50% missingness threshold) in each network generated using a more stringent threshold (10–40% missingness) was assessed by Zsummary score. Module preservation Zsummary was calculated as described by Langfelder et al. The dashed blue line indicates a zsummary score of 1.96, or FDR q value <0.05, above which module preservation was considered statistically significant. The dashed red line indicates a zsummary score of 10, or FDR q value ~ 1e−23, above which module preservation was considered highly statistically significant. Each module is color coded as shown in Figure 1. Module memberships are provided in Supplementary Table 2. (C) Percentage of total quantified proteins with ≥50% missing measurements in each cohort used for the AD consensus network. The total number of quantified proteins, and the percentage removed by applying the ≥50% missingness threshold, is provided in the legend for each cohort. (D) Percentage of total quantified proteins with ≥50% missing measurements in each cohort used in this study. The total number of quantified proteins, and the percentage removed by applying the ≥50% missingness threshold, is provided in the legend for each cohort. For the consensus LFQ cohort, the dotted line indicates the percent removed (41.3%) when missingness is controlled separately in each cohort prior to combination for construction of the AD network, as was done in this study. The solid bar is provided for direct method comparison to other cohorts used in the study. LFQ, label-free quantitation; TMT, tandem-mass tag; BLSA, Baltimore Longitudinal Study of Aging, Banner, Banner Sun Health Research Institute; MSSB, Mount Sinai School of Medicine Brain Bank; ACT, Adult Changes in Thought Study; ROS/MAP, Religious Orders Study and Memory and Aging Project; PC, precuneus; TC, temporal cortex.
Extended Data Figure 2.
Extended Data Figure 2.. Covariate Effects on AD Network Protein Quantitative Values and Modules.
(A, B) Principal component analysis was performed on AD network protein quantitative values after batch correction but prior to regression for age, sex, and post-mortem interval (PMI) covariates (n=418 case samples after network connectivity outlier removal) (A). Correlation values between case status (control, AsymAD, or AD), age, sex, PMI, and the first five principal components of the data are shown. The covariate most strongly correlated to each principal component is highlighted in bold. The percentage of variance in the data explained by each principal component is given in parentheses. (B) Effects of sex on AD network modules shown in Figure 1C. The AD network was built without regression for sex, and module eigenprotein levels were compared between male and female sex for each case group (n=123 AD, 54 AsymAD, 44 control females; n=103 AD, 45 AsymAD, 49 control males). Statistically significant differences are highlighted in red. Correlations were performed using Spearman’s rank correlation. Differences in protein levels were assessed by Kruskal-Wallis one-way ANOVA. Boxplots represent the median, 25th, and 75th percentiles, and whiskers represent measurements to the 5th and 95th percentiles. PC, principal component; PMI, post-mortem interval; Cntl, control; AsymAD, asymptomatic Alzheimer’s disease; AD, Alzheimer’s disease.
Extended Data Figure 3.
Extended Data Figure 3.. Relationship of AD Network Proteins by t-SNE Analysis.
Dimensionality reduction and visualization by t-distributed stochastic neighbor embedding (t-SNE) was applied to proteins that were in the top 25% by kME value within each AD network module. Proteins are color coded as shown in Figure 1B according to the network module in which they reside. Network module ontologies and cell type enrichments are provided as shown in Figure 1B. Ontologies are highlighted based on the most robust AD trait correlations as shown in Figure 1B.
Extended Data Figure 4.
Extended Data Figure 4.. AD Protein Network Module Trait and Pathology Correlations.
(A-C) The eigenprotein of each protein network module was correlated with neuropathological, molecular, and cognitive/functional traits (n=419 independent case sample traits after network connectivity outlier removal except for cognitive measures, where n=167 MMSE, n=159 CDR, and n=56 CASI) (A). Protein modules are bolded as in Figure 1B using CERAD, Braak, MMSE, and CDR correlations. Strength of positive (red) or negative (blue) correlation is shown by two-color heatmap, with p values provided for all correlations with p < 0.05. (B) Correlation between CERAD plaque score and Aβ levels measured by label free quantification (LFQ) mass spectrometry. (C) Correlation between Braak score (NFT, neurofibrillary tangle) and tau levels measured by LFQ of the microtubule binding region (MTBR). Correlations were performed using biweight midcorrelation and corrected by the Benjamini-Hochberg method. CERAD, Consortium to Establish a Registry for Alzheimer’s disease Aβ plaque score (higher scores represent greater plaque burden); Braak, tau neurofibrillary tangle staging score (higher scores represent greater extent of tangle burden); Aβ, amyloid-β; α-Syn, alpha synuclein; TDP-43, TAR DNA-binding protein 43; MMSE, mini-mental status examination score (higher scores represent better cognitive function); CDR, clinical dementia rating score (higher scores representing worse functional status); CASI, Cognitive Abilities Screening Instrument (higher scores represent better cognitive function). MMSE is from Banner, CDR is from MSSB, and CASI is from ACT.
Extended Data Figure 5.
Extended Data Figure 5.. AD Protein Network Validation in a Longitudinal Cohort of Aging.
(A-C) Preservation of AD protein network modules and trait correlations in the Religious Orders Study and Memory and Aging Project (ROS/MAP) cohorts. (A) Protein levels from dorsolateral prefrontal cortex (DLPFC) in a total of 340 control, AsymAD, and AD cases (control, n=84; AsymAD, n=148; AD, n=108) from the ROS/MAP cohorts were measured using a different mass spectrometry platform and quantification approach compared to the cases used to generate the AD network as shown in Figure 1. The resulting data were used to assess conservation of the AD brain protein network in the ROS/MAP cohorts. (B) AD brain protein network module preservation in the ROS/MAP cohorts. Module preservation was calculated using a composite zsummary score as described by Langfelder et al. The dashed blue line indicates a zsummary score of 1.96, or FDR q value <0.05, above which module preservation was considered statistically significant. The dashed red line indicates a zsummary score of 10, or FDR q value ~ 1e−23, above which module preservation was considered highly statistically significant. (C) Case status and trait preservation in the ROS/MAP cohorts. The top 20% of proteins by kME value in each AD brain protein network module was used to create a synthetic eigenprotein, which was then measured by case status in ROS/MAP and correlated with amyloid plaque load (CERAD score), tau neurofibrillary tangle burden (Braak stage), and cognitive function (global cognitive function composite z score). Synthetic eigenprotein analyses for modules M1, M3, M4, and M10 are shown. Analyses for all modules, with additional trait correlations, are provided in Supplementary Figure 4. Differences in module synthetic eigenproteins by case status were assessed by Kruskal-Wallis one-way ANOVA. Module synthetic eigenprotein correlations were performed using biweight midcorrelation with Benjamini-Hochberg correction. Boxplots represent the median, 25th, and 75th percentiles, and whiskers represent measurements to the 5th and 95th percentiles. Cntl, control; AsymAD, asymptomatic Alzheimer’s disease; AD, Alzheimer’s disease.
Extended Data Figure 6.
Extended Data Figure 6.. AD Protein Network Module Changes in Other Neurodegenerative Diseases by PRM Analysis.
(A-C) Protein levels for 323 proteins across 108 brains from the UPenn cohort were measured by parallel reaction monitoring targeted mass spectrometry (PRM-MS) (A). Targeted peptides and individual protein measurements by disease group are provided in Supplementary Table 4 and Supplementary Figure 11, respectively. (B) Protein levels across all cases were highly correlated between LFQ and PRM measurements (n=307 paired protein measurements). Correlation was performed by Pearson’s rho and Student’s significance (p). (C) A synthetic eigenprotein was created from proteins that mapped to an AD network module and measured across the different disease groups (control case samples n=46, AD n=49, ALS n=59, FTLD-TDP n=29, PSP n=27, CBD n=17, PD/PDD n=80, and MSA n=23 after network connectivity outlier removal). Analyses for all modules are provided in Supplementary Figure 12. Differences in module synthetic eigenproteins were assessed by Kruskal-Wallis one-way ANOVA. Differences between AD and other case groups were assessed by two-sided Dunnett’s test, the results of which are provided in Supplementary Table 4. Boxplots represent the median, 25th, and 75th percentiles, and whiskers represent measurements to the 5th and 95th percentiles.
Extended Data Figure 7.
Extended Data Figure 7.. Protein Differential Abundance in AD Brain.
(A-C) Differential protein abundance for AD versus control (A), AD versus AsymAD (B), and AsymAD versus control (C) brain, represented by fold-change versus t statistic for the given comparison (n=230 AD, n=98 AsymAD, n=91 control case samples after network connectivity outlier removal). Differential abundance data are from the consensus analysis described in Figure 1A. Proteins are colored by the module in which they reside according to the scheme shown in Figure 1B. For instance, proteins that reside in module M4 are colored yellow. Pairwise comparisons were performed using one-way ANOVA with Tukey test. The bold horizontal dashed line represents p < 0.05. AsymAD, asymptomatic Alzheimer’s disease; AD, Alzheimer’s disease.
Extended Data Figure 8.
Extended Data Figure 8.. Differential Abundance of Reactive Astrocyte Protein Markers in AD Brain.
(A-C) Proteins expressed in different astrocytic response states to acute injury were analyzed for changes in AD. Astrocyte mRNAs that were upregulated greater than four-fold after acute injury by LPS administration (“A1” Inflammatory) (A), middle cerebral artery occlusion (“A2” Tissue Repair) (B), or both (“A1/A2 Mixed”) (C) were analyzed for changes in abundance between AD and control. Results are shown as protein fold-change versus t statistic for the given comparison (n=230 AD, n=98 AsymAD, n=91 control case samples after network connectivity outlier removal). Pairwise comparisons were performed using one-way ANOVA with Tukey test. The bold horizontal dashed line represents p < 0.05. Proteins are colored by the module in which they reside according to the scheme shown in Figure 1B. AD, Alzheimer’s disease.
Extended Data Figure 9.
Extended Data Figure 9.. Differential Abundance of Microglial Phenotypic Protein Markers in AD Brain.
(A-C) Proteins corresponding to microglial mRNAs that were found to be associated with different microglial phenotypic states were analyzed for changes in AD. Proteins from microglial co-expression modules corresponding to a disease-associated anti-inflammatory (A), disease-associated pro-inflammatory (B), and homeostatic (C) response phenotype were analyzed for changes in abundance between AD and control. Results are shown as protein fold-change versus t statistic for the given comparison (n=230 AD, n=98 AsymAD, n=91 control case samples after network connectivity outlier removal). Pairwise comparisons were performed using one-way ANOVA with Tukey test. The bold horizontal dashed line represents p < 0.05. Proteins are colored by the module in which they reside according to the scheme shown in Figure 1B. AD, Alzheimer’s disease.
Extended Data Figure 10.
Extended Data Figure 10.. M4 Astrocyte/Microglial Metabolism Module Members Increased at the Transcript Level in Microglia Undergoing Active Amyloid-β Plaque Phagocytosis.
mRNA transcripts increased in microglia undergoing active amyloid-β plaque phagocytosis (XO4+) were overlapped with cognate proteins in the M4 module. There were 23 transcripts that overlapped with M4 module members. Proteins that also overlapped with the top 30 disease-associated microglia (DAM) markers in the M4 module (Figure 5D) are shown in blue. Proteins that did not overlap with the top 30 DAM markers are shown in cyan. Proteins in cyan are therefore M4 members that may be more specifically elevated in microglia undergoing active amyloid-β plaque phagocytosis.
Figure 1.
Figure 1.. Protein Network Analysis of Asymptomatic and Symptomatic Alzheimer’s Disease Brain.
(A-C) Protein levels in brain tissue from control, asymptomatic Alzheimer’s disease (AsymAD), and Alzheimer’s disease (AD) patients (N=453) were measured by label-free mass spectrometry and analyzed by weighted correlation network analysis (WGCNA) and differential abundance (A). Brain tissue was analyzed from postmortem dorsolateral prefrontal cortex (DLPFC, highlighted in yellow) in the Baltimore Longitudinal Study of Aging (BLSA, n=11 control, n=13 AsymAD, n=20 AD, n=44 total), Banner Sun Health Research Institute Brain Bank (Banner, n=26 control, n=58 AsymAD, n=94 AD, n=178 total), Mount Sinai School of Medicine Brain Bank (MSSB, n=46 control, n=17 AsymAD, n=103 AD, n=166 total), and the Adult Changes in Thought Study (ACT, n=11 control, n=14 AsymAD, n=40 AD, n=65). (B) A protein correlation network consisting of 13 protein modules was generated from 3334 proteins measured across four separate cohorts. (Top) Module eigenproteins, which represent the first principle component of the protein expression within each module, were correlated with neuropathological hallmarks of Alzheimer’s disease (CERAD, Consortium to Establish a Registry for Alzheimer’s disease amyloid-β plaque score, higher scores represent greater plaque burden; Braak, tau neurofibrillary tangle staging score, higher scores represent greater extent of tangle burden), cognitive function (MMSE, mini-mental status examination score, higher scores represent better cognitive function), and overall functional status (CDR, clinical dementia rating score, higher scores represent worse functional status). CERAD and Braak measures were from all cohorts, while MMSE was from Banner and CDR was from MSSB. Strength of positive (red) or negative (blue) correlation is shown by two-color heatmap, with p values provided for all correlations with p < 0.05. Modules that showed a significant correlation with all four traits are highlighted in bold. (Middle) The cell type nature of each protein module was assessed by module protein overlap with known neuron, astrocyte, microglia, oligodendrocyte (oligoden), and endothelia cell markers. Significance of overlap is shown by one-color heatmap, with p values provided for overlaps with p < 0.05. (Bottom) Gene ontology (GO) analysis of the proteins within each module clearly identified, for most modules, the biological processes associated with the module. (C) Module eigenprotein level by case status for each protein module that had significant correlation to all four traits in (B). Case status is from all cohorts (control, n=91; AsymAD, n=98; AD, n=230 after network connectivity outlier removal). APOE genotype effects and other trait correlations for all modules are provided in Supplementary Figure 1. Module eigenprotein correlations were performed using biweight midcorrelation and corrected by the Benjamini-Hochberg method. Protein module cell type overlap was performed using one-sided Fisher’s exact test with Benjamini-Hochberg correction. Differences in eigenprotein values were assessed by Kruskal-Wallis one-way ANOVA. Boxplots represent the median, 25th, and 75th percentiles, and whiskers represent measurements to the 5th and 95th percentiles. Cntl, control; AsymAD, asymptomatic Alzheimer’s disease; AD, Alzheimer’s disease.
Figure 2.
Figure 2.. AD Protein Network Is Preserved in Different Brain Regions.
(A-E) Preservation of AD protein network modules derived from analysis of DLPFC in other brain regions affected by AD. (A) Protein levels in temporal cortex from a total of 111 control and AD cases (control, n=28; AD, n=83) from the Mayo Brain Bank, and in precuneus from a total of 46 cases from the BLSA (control, n=12; AsymAD, n=14; AD, n=20) were measured by label-free mass spectrometry and used to assess conservation of the AD brain protein network derived from DLPFC. (B, C) AD brain protein network preservation in temporal cortex (B) and precuneus (C). Module preservation was calculated using a composite zsummary score as described by Langfelder et al. The dashed blue line indicates a zsummary score of 1.96, or FDR q value <0.05, above which module preservation was considered statistically significant. The dashed red line indicates a zsummary score of 10, or FDR q value ~ 1e−23, above which module preservation was considered highly statistically significant. (D, E) Case status preservation in temporal cortex and precuneus. A synthetic eigenprotein was created for each AD network module as described in Extended Data Figure 5 and measured by case status in temporal cortex (D) and precuneus (E). Asymptomatic AD was not assessed in the Mayo cohort, and is therefore not included in the temporal cortex analyses. Synthetic eigenprotein analyses for modules M1, M3, M4, and M10 are shown. Analyses for all modules, with additional trait correlations, are provided in Supplementary Figures 7 and 8. Differences in module synthetic eigenproteins by case status were assessed by two-sided Welch’s t test (D) or Kruskal-Wallis one-way ANOVA (E). Boxplots represent the median, 25th, and 75th percentiles, and whiskers represent measurements to the 5th and 95th percentiles. Cntl, control; AsymAD, asymptomatic Alzheimer’s disease; AD, Alzheimer’s disease.
Figure 3.
Figure 3.. Effects of Aging on AD Protein Network Modules.
(A, B) Protein levels were measured in DLPFC from cognitively normal people who died at different ages (age 30–39, n=20; age 40–49, n=34; age 50–59, n=17; age 60–69, n=13), and used to analyze AD protein network module changes with age. Brains were obtained from Johns Hopkins University. (B) A synthetic eigenprotein was created for each AD network module as described in Extended Data Figure 5 and measured by age group (left boxplot) as well as correlated with age (right scatterplot) in the aging brain cohort. Synthetic eigenprotein analyses for modules M1, M3, M4, and M10 are shown. Analyses for all modules are provided in Supplementary Figure 9. Differences in module synthetic eigenproteins by age grouping were assessed by Kruskal-Wallis one-way ANOVA. Synthetic eigenprotein correlations were performed using biweight midcorrelation. Boxplots represent the median, 25th, and 75th percentiles, and whiskers represent measurements to the 5th and 95th percentiles.
Figure 4.
Figure 4.. AD Protein Network Module Changes in Other Neurodegenerative Diseases.
(A, B) Protein levels were measured in DLPFC from control (n=46), AD (n=49), amyotrophic lateral sclerosis (ALS, n=59), frontotemporal lobar degeneration with TAR DNA-binding protein 43 inclusions (FTLD-TDP, n=29), progressive supranuclear palsy (PSP, n=27), corticobasal degeneration (CBD, n=17), Parkinson’s disease and Parkinsons’s disease dementia (PD/PDD, n=81), and multiple system atrophy (MSA, n=23) cases from the University of Pennsylvania Brain Bank, and used to analyze AD protein network module changes in different neurodegenerative diseases. (B) A synthetic eigenprotein was created for each AD network module as described in Extended Data Figure 5 and measured by disease group in the UPenn cohort. Synthetic eigenprotein analyses for modules M1, M3, M4, and M10 are shown. Analyses for all modules are provided in Supplementary Figure 10. Differences in module synthetic eigenproteins were assessed by Kruskal-Wallis one-way ANOVA. Differences between AD and other case groups were assessed by two-sided Dunnett’s test, the results of which are provided in Supplementary Table 4. Boxplots represent the median, 25th, and 75th percentiles, and whiskers represent measurements to the 5th and 95th percentiles.
Figure 5.
Figure 5.. The M4 Astrocyte/Microglial Metabolism Module is Enriched in AD Genetic Risk Factors and Markers of Anti-Inflammatory Disease-Associated Microglia.
(A-D) Enrichment of proteins contained within genomic regions identified by genome wide association studies (GWAS) as risk factors for AD, autism spectrum disorder, and schizophrenia was calculated for each module in the AD protein network (A). Modules highlighted in dark red were significantly enriched for AD risk factors, and not for risk factors associated with autism spectrum disorders or schizophrenia. The horizontal dotted line indicates a z score level of enrichment of 1.96, or false discovery rate (FDR) q value <0.05, above which enrichment was considered statistically significant. Enrichment was calculated using the MAGMA algorithm, as previously described, using module proteins provided in Supplementary Table 2 and 1234 genes identified as risk factors for AD. (B) Enrichment of astrocyte (top) and microglia (bottom) phenotypic markers in AD protein network modules. (Top) Astrocyte phenotype markers indicating upregulation in response to acute injury with lipopolysaccharide (LPS) (A1 Inflammatory), middle cerebral artery occlusion (MCAO) (A2 Tissue repair), or both types of acute injury (A1/A2 Shared) in a mouse model were assessed for enrichment in AD network modules. (Bottom) Microglia markers from an mRNA co-expression analysis that are altered after challenge with LPS and/or amyloid-β plaque deposition in mouse models were assessed for enrichment in AD network modules (Anti-inflammatory, decrease with LPS administration and increase with plaque deposition; Pro-inflammatory, increase with LPS administration and increase with plaque deposition; Homeostatic, decrease with LPS administration and decrease with plaque deposition). Module enrichment was determined by one-sided Fisher’s exact test with Benjamini-Hochberg correction. Cell phenotype marker lists and protein module membership lists used for enrichment calculations are provided in Supplementary Table 5 and Supplementary Table 2, respectively. *P < 0.05, **P < 0.01, ***P < 0.01, **** P < 0.0001. Exact P values are provided in Supplementary Table 5. (C) The top 100 proteins by module eigenprotein correlation value (kME) in module M4. The size of each circle indicates the relative kME. Those proteins with the largest kME are considered “hub” proteins within the module. Proteins highlighted in blue are upregulated in A2 tissue repair astrocyte and anti-inflammatory microglia; proteins highlighted in red are upregulated in A1 inflammatory astrocyte and pro-inflammatory microglia. Additional such proteins are provided in Supplementary Table 5. (D) The top 30 most differentially abundant microglial transcripts in an AD mouse model that overlap with proteins in the M4 module, colored as shown in (C) (n=7 APP/PS1 (AD) mice, n=7 wildtype (Cntl) mice). M4 proteins that overlap with transcripts elevated in microglia undergoing active amyloid-β plaque phagocytosis are provided in Extended Data Figure 10. (Inset) Transcript elevations validated at the protein level in microglia undergoing active amyloid-β plaque phagocytosis (n=4 5xFAD (AD) mice, n=4 wildtype (Cntl) mice). Boxplots represent the median, 25th, and 75th percentiles, and whiskers represent measurements to the 5th and 95th percentiles.
Figure 6.
Figure 6.. M4 Astrocyte/Microglial Metabolism Module Protein Levels Are Elevated in AsymAD and AD CSF.
(A-C) Approach to analysis of M4 proteins in CSF from two different cohorts (A). CSF in Cohort 1 (n=297 biologically independent case samples) was obtained from subjects with normal CSF amyloid-β and tau levels (controls, n=150 case samples) and patients with low amyloid-β, elevated tau levels, and cognitive impairment (AD, n=147 case samples). CSF in Cohort 2 (n=96 biologically independent case samples) was obtained from control subjects (n=32 case samples) and AD patients (n=33 case samples) as defined in Cohort 1, as well as subjects with CSF amyloid-β and tau levels that met criteria for AD but who were cognitively normal at the time of collection (AsymAD, n=31 case samples). CSF was analyzed without prior pre-fractionation or depletion of highly abundant proteins; relative protein levels were measured by TMT-MS. (B) Relative CSF protein levels of selected M4 module members in Cohort 1. Protein names are colored according to pro-inflammatory (red) or anti-inflammatory (blue) classification. Proteins that are considered neither pro- nor anti-inflammatory are in black. Additional M4 protein measurements, as well as trait correlations for the measured proteins, are provided in Supplementary Figure 13. (C) Relative CSF protein levels of selected M4 module members in Cohort 2. Protein names are colored as in (B). Additional measurements and trait correlations are provided in Supplementary Figure 14. Differences in protein levels were assessed by two-sided Welch’s t test (B) or Kruskal-Wallis one-way ANOVA (C). Correlations were performed using biweight midcorrelation. Boxplots represent the median, 25th, and 75th percentiles, and whiskers represent measurements to the 5th and 95th percentiles. Cntl, control; AsymAD, asymptomatic Alzheimer’s disease; AD, Alzheimer’s disease; TMT, tandem mass tag; MoCA, Montreal Cognitive Assessment (higher scores represent better cognitive function).

Comment in

References

    1. Prince M , et al. World Alzheimer Report 2015: The Global Impact of Dementia. (Alzheimer’s Disease International, London, 2015).
    1. Jack CR Jr., et al. NIA-AA Research Framework: Toward a biological definition of Alzheimer’s disease. Alzheimers Dement 14, 535–562 (2018). - PMC - PubMed
    1. Miller JA, Oldham MC & Geschwind DH A systems level analysis of transcriptional changes in Alzheimer’s disease and normal aging. J Neurosci 28, 1410–1420 (2008). - PMC - PubMed
    1. Oldham MC, et al. Functional organization of the transcriptome in human brain. Nat Neurosci 11, 1271–1282 (2008). - PMC - PubMed
    1. Clarke C, et al. Correlating transcriptional networks to breast cancer survival: a large-scale coexpression analysis. Carcinogenesis 34, 2300–2308 (2013). - PubMed

Publication types

MeSH terms

Grants and funding