. 2020 May;23(5):676-689.
doi: 10.1038/s41593-020-0618-6. Epub 2020 Apr 13.

Profiling peripheral nerve macrophages reveals two macrophage subsets with distinct localization, transcriptome and response to injury

Affiliations

Profiling peripheral nerve macrophages reveals two macrophage subsets with distinct localization, transcriptome and response to injury

Elke Ydens et al. Nat Neurosci. 2020 May.

Abstract

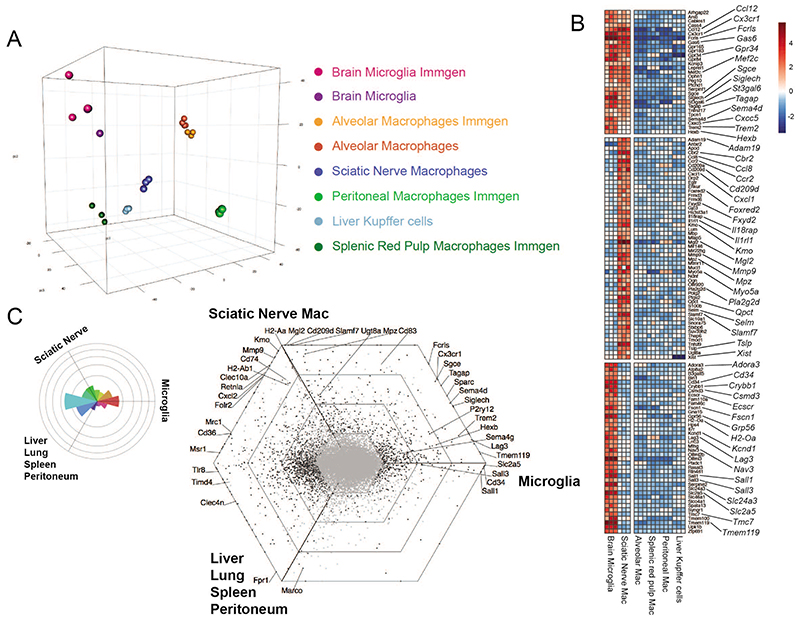
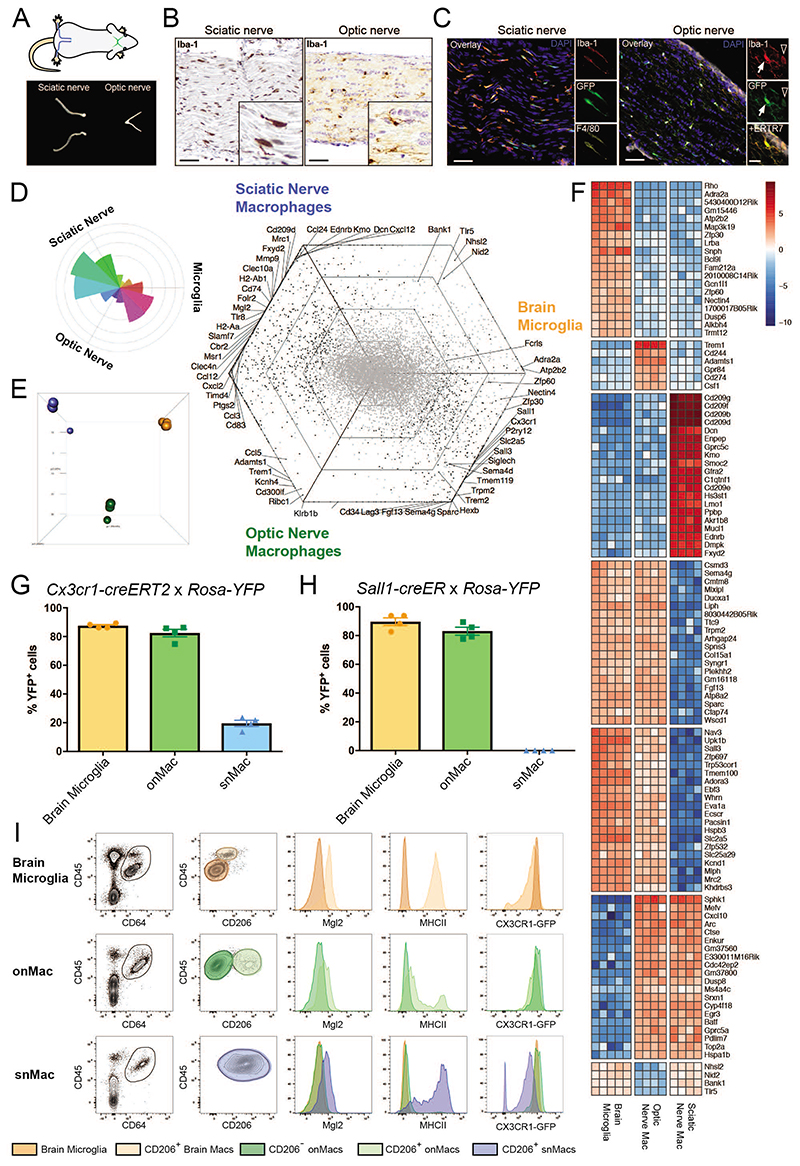
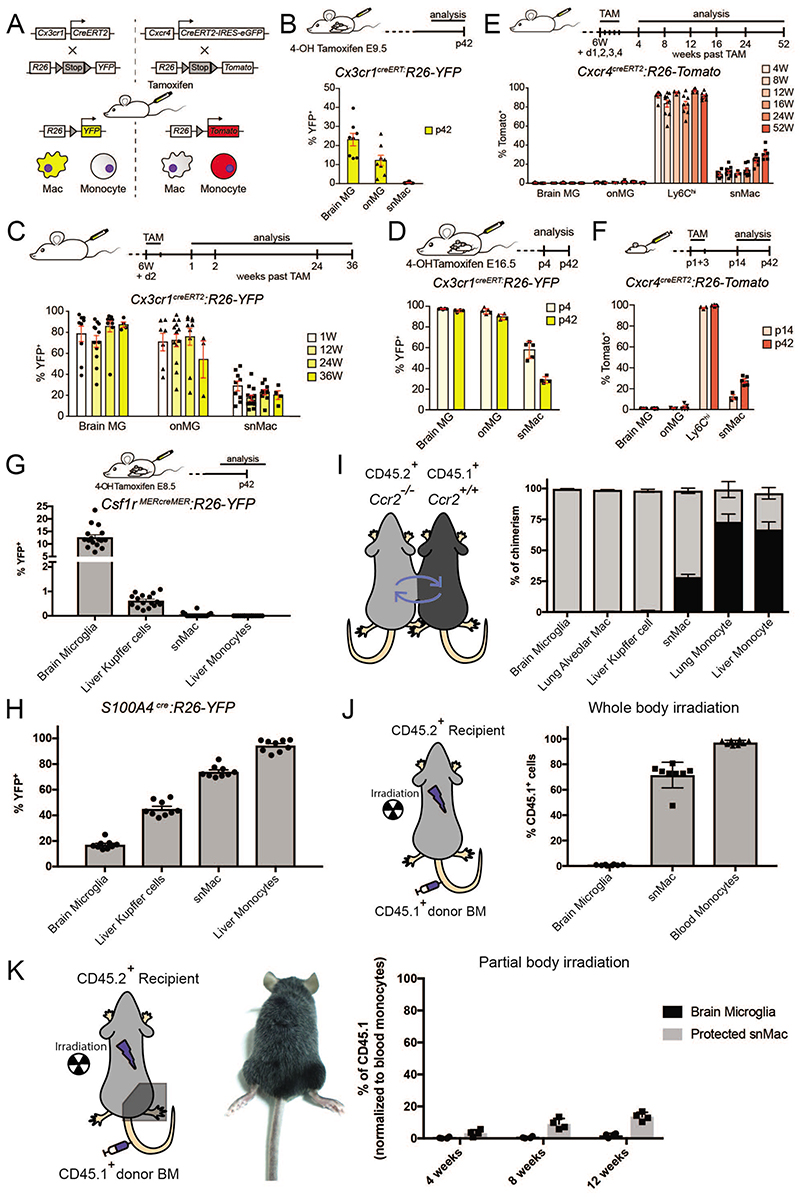
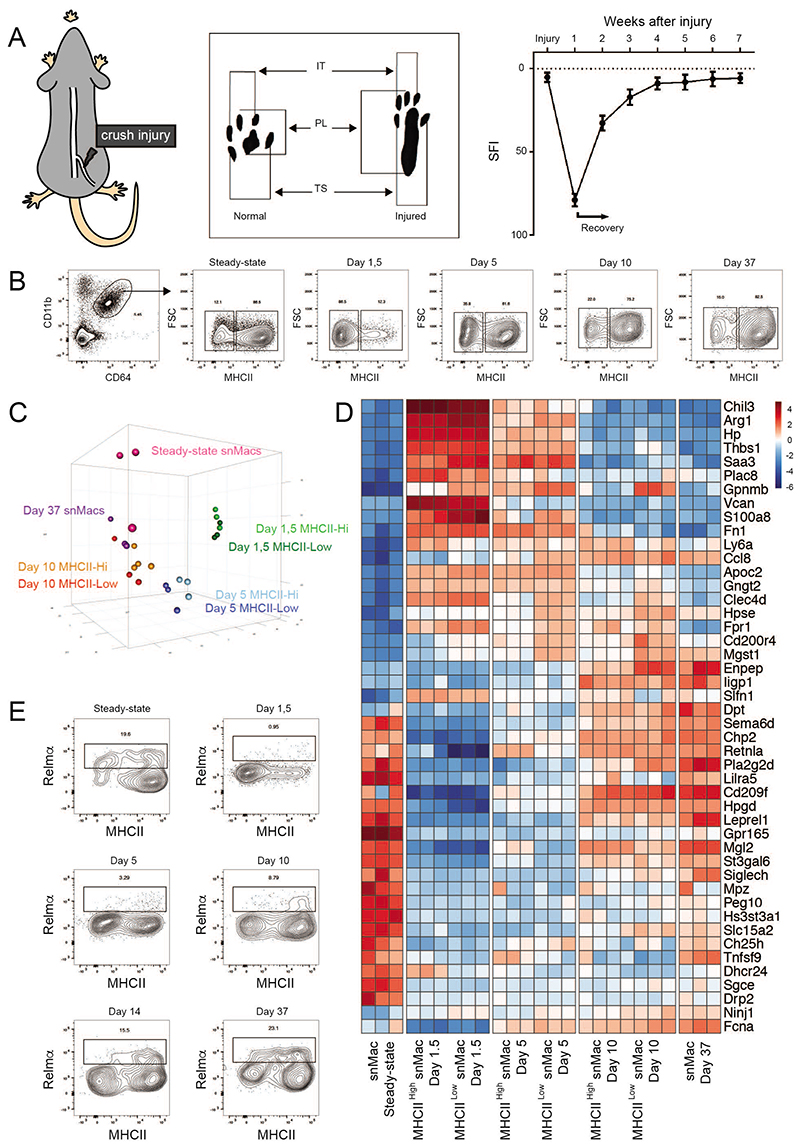
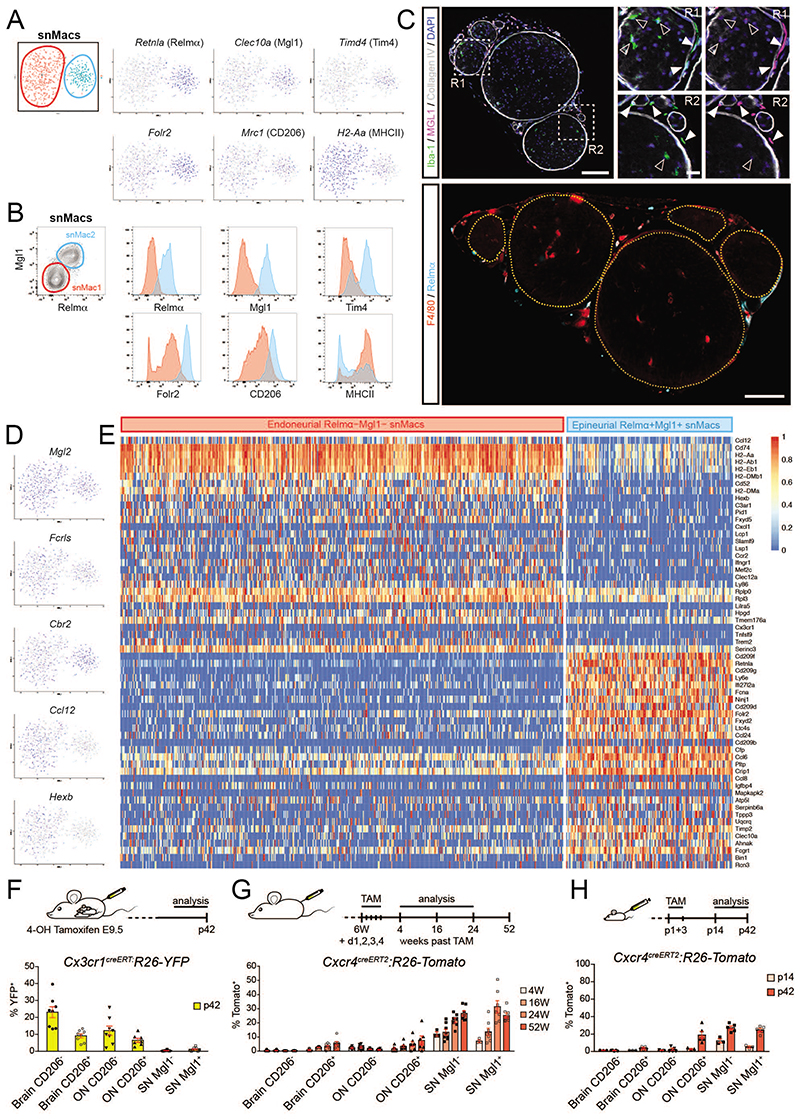
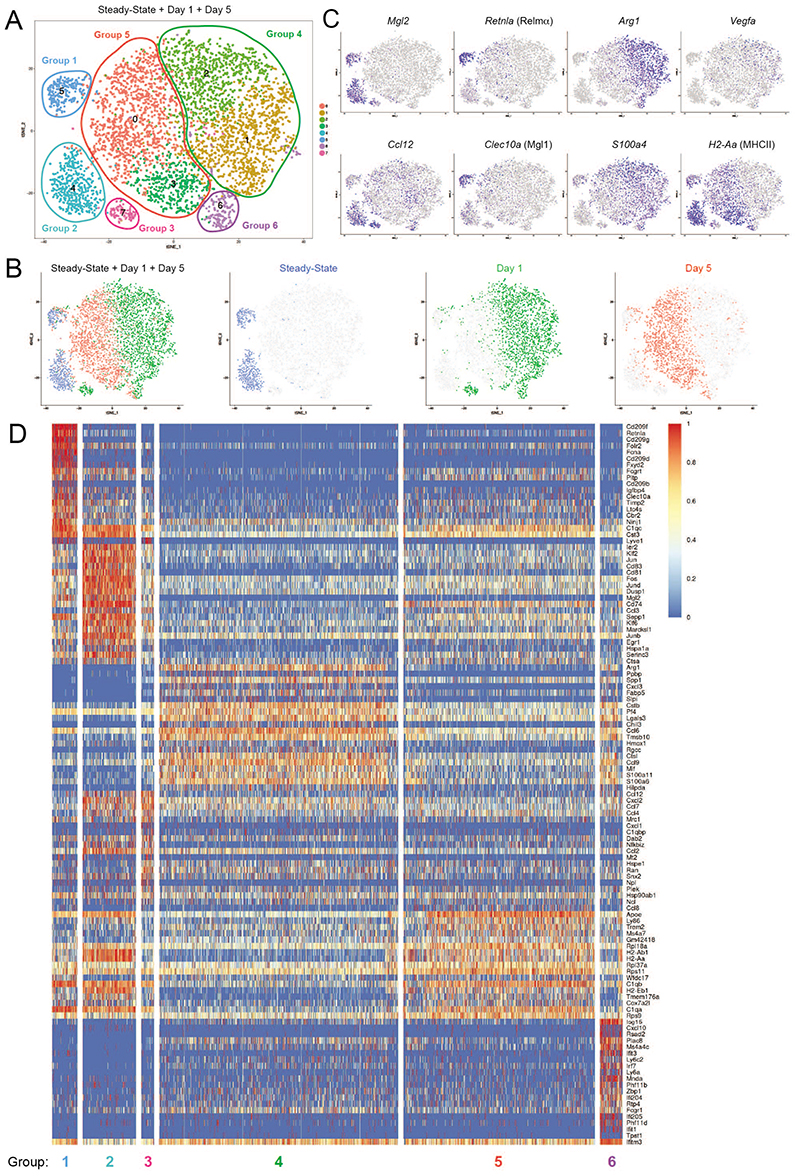
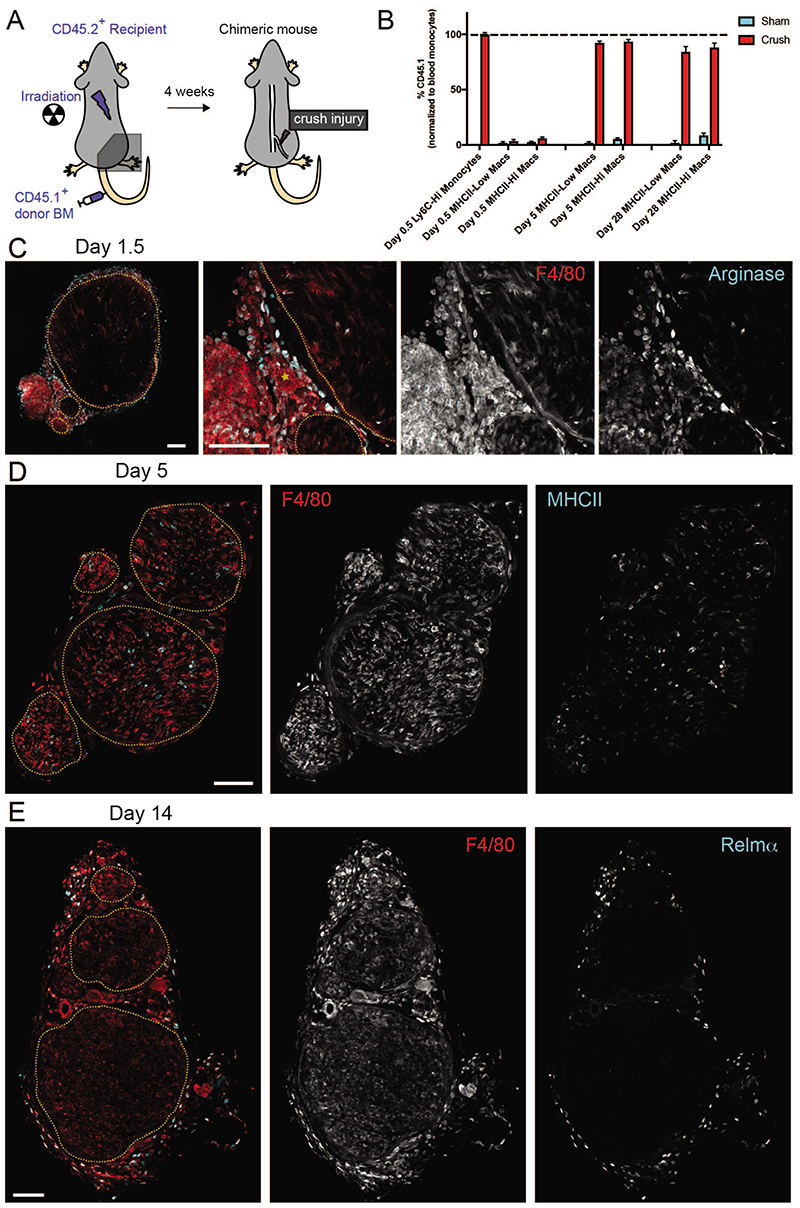
While CNS microglia have been extensively studied, relatively little is known about macrophages populating the peripheral nervous system. Here we performed ontogenic, transcriptomic and spatial characterization of sciatic nerve macrophages (snMacs). Using multiple fate-mapping systems, we show that snMacs do not derive from the early embryonic precursors colonizing the CNS, but originate primarily from late embryonic precursors and become replaced by bone-marrow-derived macrophages over time. Using single-cell transcriptomics, we identified a tissue-specific core signature of snMacs and two spatially separated snMacs: Relmα+Mgl1+ snMacs in the epineurium and Relmα-Mgl1- snMacs in the endoneurium. Globally, snMacs lack most of the core signature genes of microglia, with only the endoneurial subset expressing a restricted number of these genes. In response to nerve injury, the two resident snMac populations respond differently. Moreover, and unlike in the CNS, monocyte-derived macrophages that develop during injury can engraft efficiently in the pool of resident peripheral nervous system macrophages.


Figures

Figure 1
Figure 1. Sciatic nerve macrophages possess a unique gene expression profile.
A. PCA analysis of transcriptional profiles of brain microglia, alveolar macrophages, sciatic nerve (SN) macrophages, liver Kupffer cells, peritoneal macrophages or splenic red pulp macrophages. Transcriptional profiles were obtained from cells sorted in-house or from the Immgen consortium (www.immgen.com). snMacs were sorted as CD45+F4/80+CD64+ live cells. B. Heat map showing differentially expressed (DE) genes in brain microglia versus sciatic nerve macrophages, or alveolar macrophages, liver Kupffer cells, peritoneal macrophages or splenic red pulp macrophages. Top panel shows genes shared between brain microglia and snMacs, middle panel and bottom panel show genes enriched in either brain microglia or snMacs. The heatmap displays the relative log2 normalized expression per gene. This was determined by calculating the mean expression value per gene over all cell types in the heatmap and then subtracting this mean from each cell type’s particular gene expression value. C. Rose plot and hexagonal “triwise” plot showing a visualization of DE genes between brain microglia, snMacs and all other macrophage populations analyzed in A and B. Bulk microarray data (A-B-C) were obtained from three independent replicates from three different experiments. The gating strategy for sorting snMacs is depicted in Supplementary Figure 1A.
Figure 2
Figure 2. Optic nerve macrophages are closer to brain microglia than snMacs.
A. Scheme of sciatic nerves (blue) and optic nerves (green) and representative pictures of isolated nerves. B. Light microscopy images showing Iba1+ macrophages (brown) in sciatic nerve and optic nerve. Scale bar, 50μm. C. Immunofluorescence microscopy images showing Iba1+F4/80+Cx3cr1gfp+ sciatic nerve macrophages and Iba1+Cx3cr1gfp+ optic nerve macrophages both inside the optic nerve (arrow) and within the surrounding ERTR7+ meninges (arrowhead). Scale bar, 50μm, insets 20μm. D. Rose and hexagon “triwise” plots of genes detected by bulk RNA sequencing in snMacs, onMacs and brain microglia. snMacs were sorted as CD45+F4/80+CD64+ live cells, onMacs and microglia were sorted as CD45LoCD11bhi live cells. E. Principle component analysis (PCA) of the bulk RNA-sequencing transcriptome profiles. Sciatic nerve macrophages in blue, optic nerve macrophages in green and brain microglia in orange. F. Heatmap of the top genes differentially expressed or shared between the brain microglia, optic nerve macrophages or sciatic nerve macrophages. The heatmap displays the relative log2 normalized expression per gene. This was determined by calculating the mean expression value per gene over all cell types in the heatmap and then subtracting this mean from each cell type’s particular gene expression value. G, H. Adult Cx3cr1creER:R26-YFP (G) or Sall1creER:R26-YFP (H), were injected with TAM and YFP expression was analyzed after two weeks by flow cytometry. Each symbol represents one mouse. I. Expression of CD206, CD45, Mgl2, MHCII and CX3CR1-GFP by CD45+CD64+ macrophages measured by flow cytometry. Plots are depicting CD206- brain microglia (orange) and CD206+ brain macrophages (light orange) as well as CD206- (green) and CD206+ (light green) onMacs. Sciatic nerve macrophages (blue). Histograms show the expression levels of MGL2, MHCII and Cx3cr1-GFP in the individual populations. Each histogram comes from four pooled mice. (B, C) Representative data from two independent microscopy or flow cytometry experiments. (D, E, F) Bulk RNA-sequencing data were obtained from four to five independent replicates from at least three different experiments. For snMacs and onMacs, cells from five mice were pooled per replicate. (G, H) Pooled data coming from 2 independent experiments (4 mice in total). (I) Representative data from two independent flow cytometry experiments. The gating strategy for sorting snMacs is depicted in Supplementary Figure 1B.
Figure 3
Figure 3. Ontogeny of sciatic nerve macrophages and brain microglia is completely different.
A. Scheme of the TAM induced recombination in either macrophages or monocytes in the Cx3cr1CreERT2:R26-YFP and Cxcr4CreERT2: R26- Tomato reporter mouse lines. B. YFP expression in yolk sac derived macrophages was induced by 4-OH TAM injection in pregnant Cx3cr1CreERT2:R26-YFP mice at embryonic day (E)9.5. The percentage of YFP+ brain microglia (MG), onMacs and sciatic nerve macrophages (snMac) was quantified by flow cytometry at postnatal day (p)42. C. YFP expression was induced by TAM injection in six weeks (6W) old Cx3cr1CreERT2:R26-YFP mice. The percentage of YFP+ brain MG, onMacs, and snMacs was quantified by flow cytometry. D. YFP expression in embryonic macrophages was induced by 4-OH TAM injection in pregnant Cx3cr1CreERT2:R26-YFP mice at E16.5. The percentage of YFP+ brain MG, onMacs and snMacs was quantified by flow cytometry. E. F. Tomato expression was induced by injecting TAM at 6W of age (E) or at postnatal days (p)1+3 (F) in Cxcr4CreERT2:R26-Tomato mice. The percentage of Tomato+ brain MG, onMacs, Ly6Chi blood monocytes (Ly6Chi) and snMacs was quantified by flow cytometry. G. YFP expression in yolk sac derived macrophages was induced by 4-OH TAM injection in pregnant Csf1rMERcreMER:R26-YFP mice at E8.5. The percentage of YFP+ brain MG, ON MG, Ly6Chi and snMacs was quantified by flow cytometry at p42. H. The percentage of YFP+ brain MG, Kupffer cells, snMacs and liver monocytes was quantified by flow cytometry in adult S100A4Cre:R26-YFP mice. I. Parabiotic mice were generated by suturing together CD45.1+ WT and CD45.2+CCR2-/- mice. The percentage of cells of CD45.1+ WT donor origin was determined in the macrophages and monocytes from indicated tissues from the CD45.2+CCR2-/- parabionts. Data represent two independent experiments involving four independent parabionts. J. K. CD45.2+ recipient mice underwent full-body irradiation (J) or partial-body irradiation with one leg protected by a lead shield (K). Mice were reconstituted with CD45.1+ donor BM and percentage of CD45.1+ brain MG, snMacs and blood monocytes was quantified by flow cytometry. All data are shown as mean ±SEM. Symbols represent individual animals. (B) Pooled data coming from 3 independent experiments (8 mice in total). (C) Pooled data from 3 independent experiments (at least 9 mice in total), except for week 36 (2 independent experiments with at least 3 mice). (D) Data from 2 pregnant females. Offspring divided over 2 time points (p4 (5 mice), p42 (4 mice). (E) Pooled data from 2 independent experiments (with at least 6 mice), except for week 12 (1 experiment with 4 mice). (F) P14 time point: 1 experiment with 3 mice; p42: data pooled from 2 independent experiments with 6 mice in total. (G) Pooled data from 2 independent experiments with 16 mice in total. (H) Pooled data from 2 independent experiments with 9 mice in total. (I) Data represent two independent experiments involving four independent parabionts. (J) Pooled data of two independent experiments with 8 mice in total. (K) One experiment shown of two independent experiments with 4 mice per experiment.
Figure 4
Figure 4. Peripheral nerve injury strongly affects snMacs gene expression.
A. Graphical representation showing the crush injury model (left panel) and an example of a footprint diagram (middle panel), which is analysed at different time points upon the crush injury and results in a typical SFI (sciatic functional index) score (right panel). B. Gating strategy to identify MHCIIlow and MHCIIhi macrophages that were sorted at different time points upon crush injury. C. PCA analysis showing clustering of the different transcriptional profiles obtained from microarray analysis of different sorted macrophage populations at different time points upon injury. D. Heat map analysis showing DE genes between the MHCIIlow and MHCIIhi populations isolated at different time points upon analysis. The heatmap displays the relative log2 normalized expression per gene. This was determined by calculating the mean expression value per gene over all cell types in the heatmap and then subtracting this mean from each cell type’s particular gene expression value. E. Flow cytometry analysis showing Relmα expression in SN MHCIIlow and MHCIIhi populations at different time points upon injury. The replicate bulk transcriptomic profiles (C,D) of each individual time-point were acquired during 3 independent experiments. The flow cytometry plots in (B) are representative plots of at least 3 mice per time-point performed in 3 independent experiments. (E) Flow cytometry plots are representative for at least two independent experiments, except for d10 (1 experiment with 3 mice).
Figure 5
Figure 5. Single-cell sequencing reveals the presence of two macrophage subsets in the sciatic nerve.
snMacs were sorted for single-cell RNA sequencing as F4/80+CD64+ cells. A. tSNE plots of about 600 snMacs revealing the presence of two snMac subsets (red and blue) with distinct gene expression patterns. B. Representative flow cytometry of snMacs confirming the identification of two snMac subsets at the protein level. snMac1 (red) were Relmα+Mgl1+, whereas snMac2 (blue) were Relmα-Mgl1-. Other markers are shown in histograms. Representative plots are shown from 2 independent experiments. C. Confocal microscopy of sciatic nerve vibratome cross sections from C547BL/6 mice. Top: Location of Iba-1+Mgl1- snMac1 (filled arrowheads) and Iba-1+Mgl+ snMac2 (open arrowheads) is depicted. The perineurium and basal membranes of blood vessels were stained with Collagen IV. Nuclei were counterstained with DAPI. Images are representative of at least five individual mice. Bottom: Nerve fascicle boundaries are marked by dashed yellow delineations. Location of F4/80+Relmα- snMac1 and F4/80+Relmα+ snMac2 is depicted. Scale bar: overview 100μm, insets 20μm. D. E Single-cell tSNE plot showing the expression profile of individual genes (D) and heatmap of the differentially expressed genes between Relmα+Mgl1+ snMacs and Relmα-Mgl1- snMacs (E). The heatmap shows the scaled log2 normalised expression values. The log2 normalised expression values were scaled using the ‘scale_quantile’ function of the SCORPIUS package with default parameters (v1.0). F. YFP expression in yolk sac derived macrophages was induced by 4-OH TAM injection in pregnant Cx3cr1CreERT2:R26-YFP mice at 9.5. The percentage of YFP positive CD206- brain microglia, CD206+ brain Macs, CD206- onMacs, CD206+ ON Macs, Mgl1- snMac1 and Mgl1+ snMac2 was quantified by flow cytometry at postnatal day (p)42. G, H. Tomato expression was induced by injecting TAM at 6W of age (G) or at postnatal days (p)1+3 (H) in Cxcr4CreERT2:R26-Tomato mice. The percentage of Tomato+ CD206- brain microglia, CD206+ brain Macs, CD206- ON microglia, CD206+ ON macrophages, Mgl1- snMac1 and Mgl1+ snMac2 was quantified by flow cytometry. All data are shown as mean ±SEM. Symbols represent individual animals. (F) Data pooled from 3 independent experiments with in total 8 mice. (G) Data from 2 independent experiments with at least 7 mice, except for week 4 (1 experiment with 3 mice). (H) P14 time point: 1 experiment with 3 mice; p42: data pooled from 2 independent experiments with 6 mice in total.
Figure 6
Figure 6. Epineurial and endoneurial snMacs respond differently to peripheral nerve injury.
A. tSNE analysis of sc-RNA-Seq data reveals the presence of 6 major groups during nerve injury. B. tSNE plot as in A) with an overlay of different colors corresponding to cells isolated at different days post sciatic nerve injury. Steadystate macrophages cluster in Group 1 and Group 2. snMacs retrieved at day 1 postcrush cluster mainly in Group 3 and Group 4, but also (partially) in Group 1 and Group 6. snMacs retrieved at day 5 post-crush cluster mainly in Group 5 and partially in Group 6. C. tSNE plots showing expression of individual genes in the different clusters. D. Heat map showing the top differentially genes in each of the individual groups of the tSNE plot shown in (A). The heatmap shows the scaled log2 normalised expression values. The log2 normalised expression values were scaled using the ‘scale_quantile’ function of the SCORPIUS package with default parameters (v1.0).
Figure 7
Figure 7. The sciatic nerve is permissive to long-term monocyte engraftment after peripheral nerve injury.
A. Schematic representation of the partial-body irradiation experiment in which the right leg and its sciatic nerve were protected from irradiation. B. CD45.2+ recipient mice underwent partial-body irradiation with one leg protected by a lead shield. Mice were reconstituted with CD45.1+ donor BM and 4 weeks later the nerve that was protected from irradiation underwent a crush injury. The percentage of CD45.1+ snMacs and blood monocytes was quantified by flow cytometry at the indicated time-point post injury. All data are shown as mean ±SEM. Data represent 4 mice per time-point from two independent experiments. C. Arginase positive macrophages are present both in- and outside the nerve fascicles at 1.5 days after nerve crush. Overview image (left) and higher zoom (3 rightmost) images are shown. A blood vessel is marked by a yellow asterisk. D. MHCIIHi and MHCIILow macrophages are present both in and outside the nerve fascicles at 5 days after nerve crush. E. Relmα+ macrophages are excluded from the nerve fascicles and reside mostly in the perineurium and epineurium connective tissues at 14 days after nerve crush. In (C), (D) and (E), nerve fascicle boundaries are marked by yellow dashed delineations and F4/80 is used as a pan macrophage marker. Images are representative of nerves of 2 (C) or 3-5 mice. Scale bar = 100μm.

References

    1. Giladi A, Amit I. Single-Cell Genomics: A Stepping Stone for Future Immunology Discoveries. Cell. 2018;172:14–21. - PubMed
    1. Wynn TA, Chawla A, Pollard JW. Macrophage biology in development, homeostasis and disease. Nature. 2013;496:445–455. - PMC - PubMed
    1. Ginhoux F, et al. Fate mapping analysis reveals that adult microglia derive from primitive macrophages. Science. 2010;330:841–845. - PMC - PubMed
    1. Mass E, et al. Specification of tissue-resident macrophages during organogenesis. Science. 2016;353:aaf4238. - PMC - PubMed
    1. Schulz C, et al. A Lineage of Myeloid Cells Independent of Myb and Hematopoietic Stem Cells. Science. 2012;336:86–90. - PubMed

Publication types