. 2020 May;23(5):638-650.
doi: 10.1038/s41593-020-0617-7. Epub 2020 Apr 13.

Orexin signaling in GABAergic lateral habenula neurons modulates aggressive behavior in male mice

Affiliations

Orexin signaling in GABAergic lateral habenula neurons modulates aggressive behavior in male mice

Meghan E Flanigan et al. Nat Neurosci. 2020 May.

Abstract

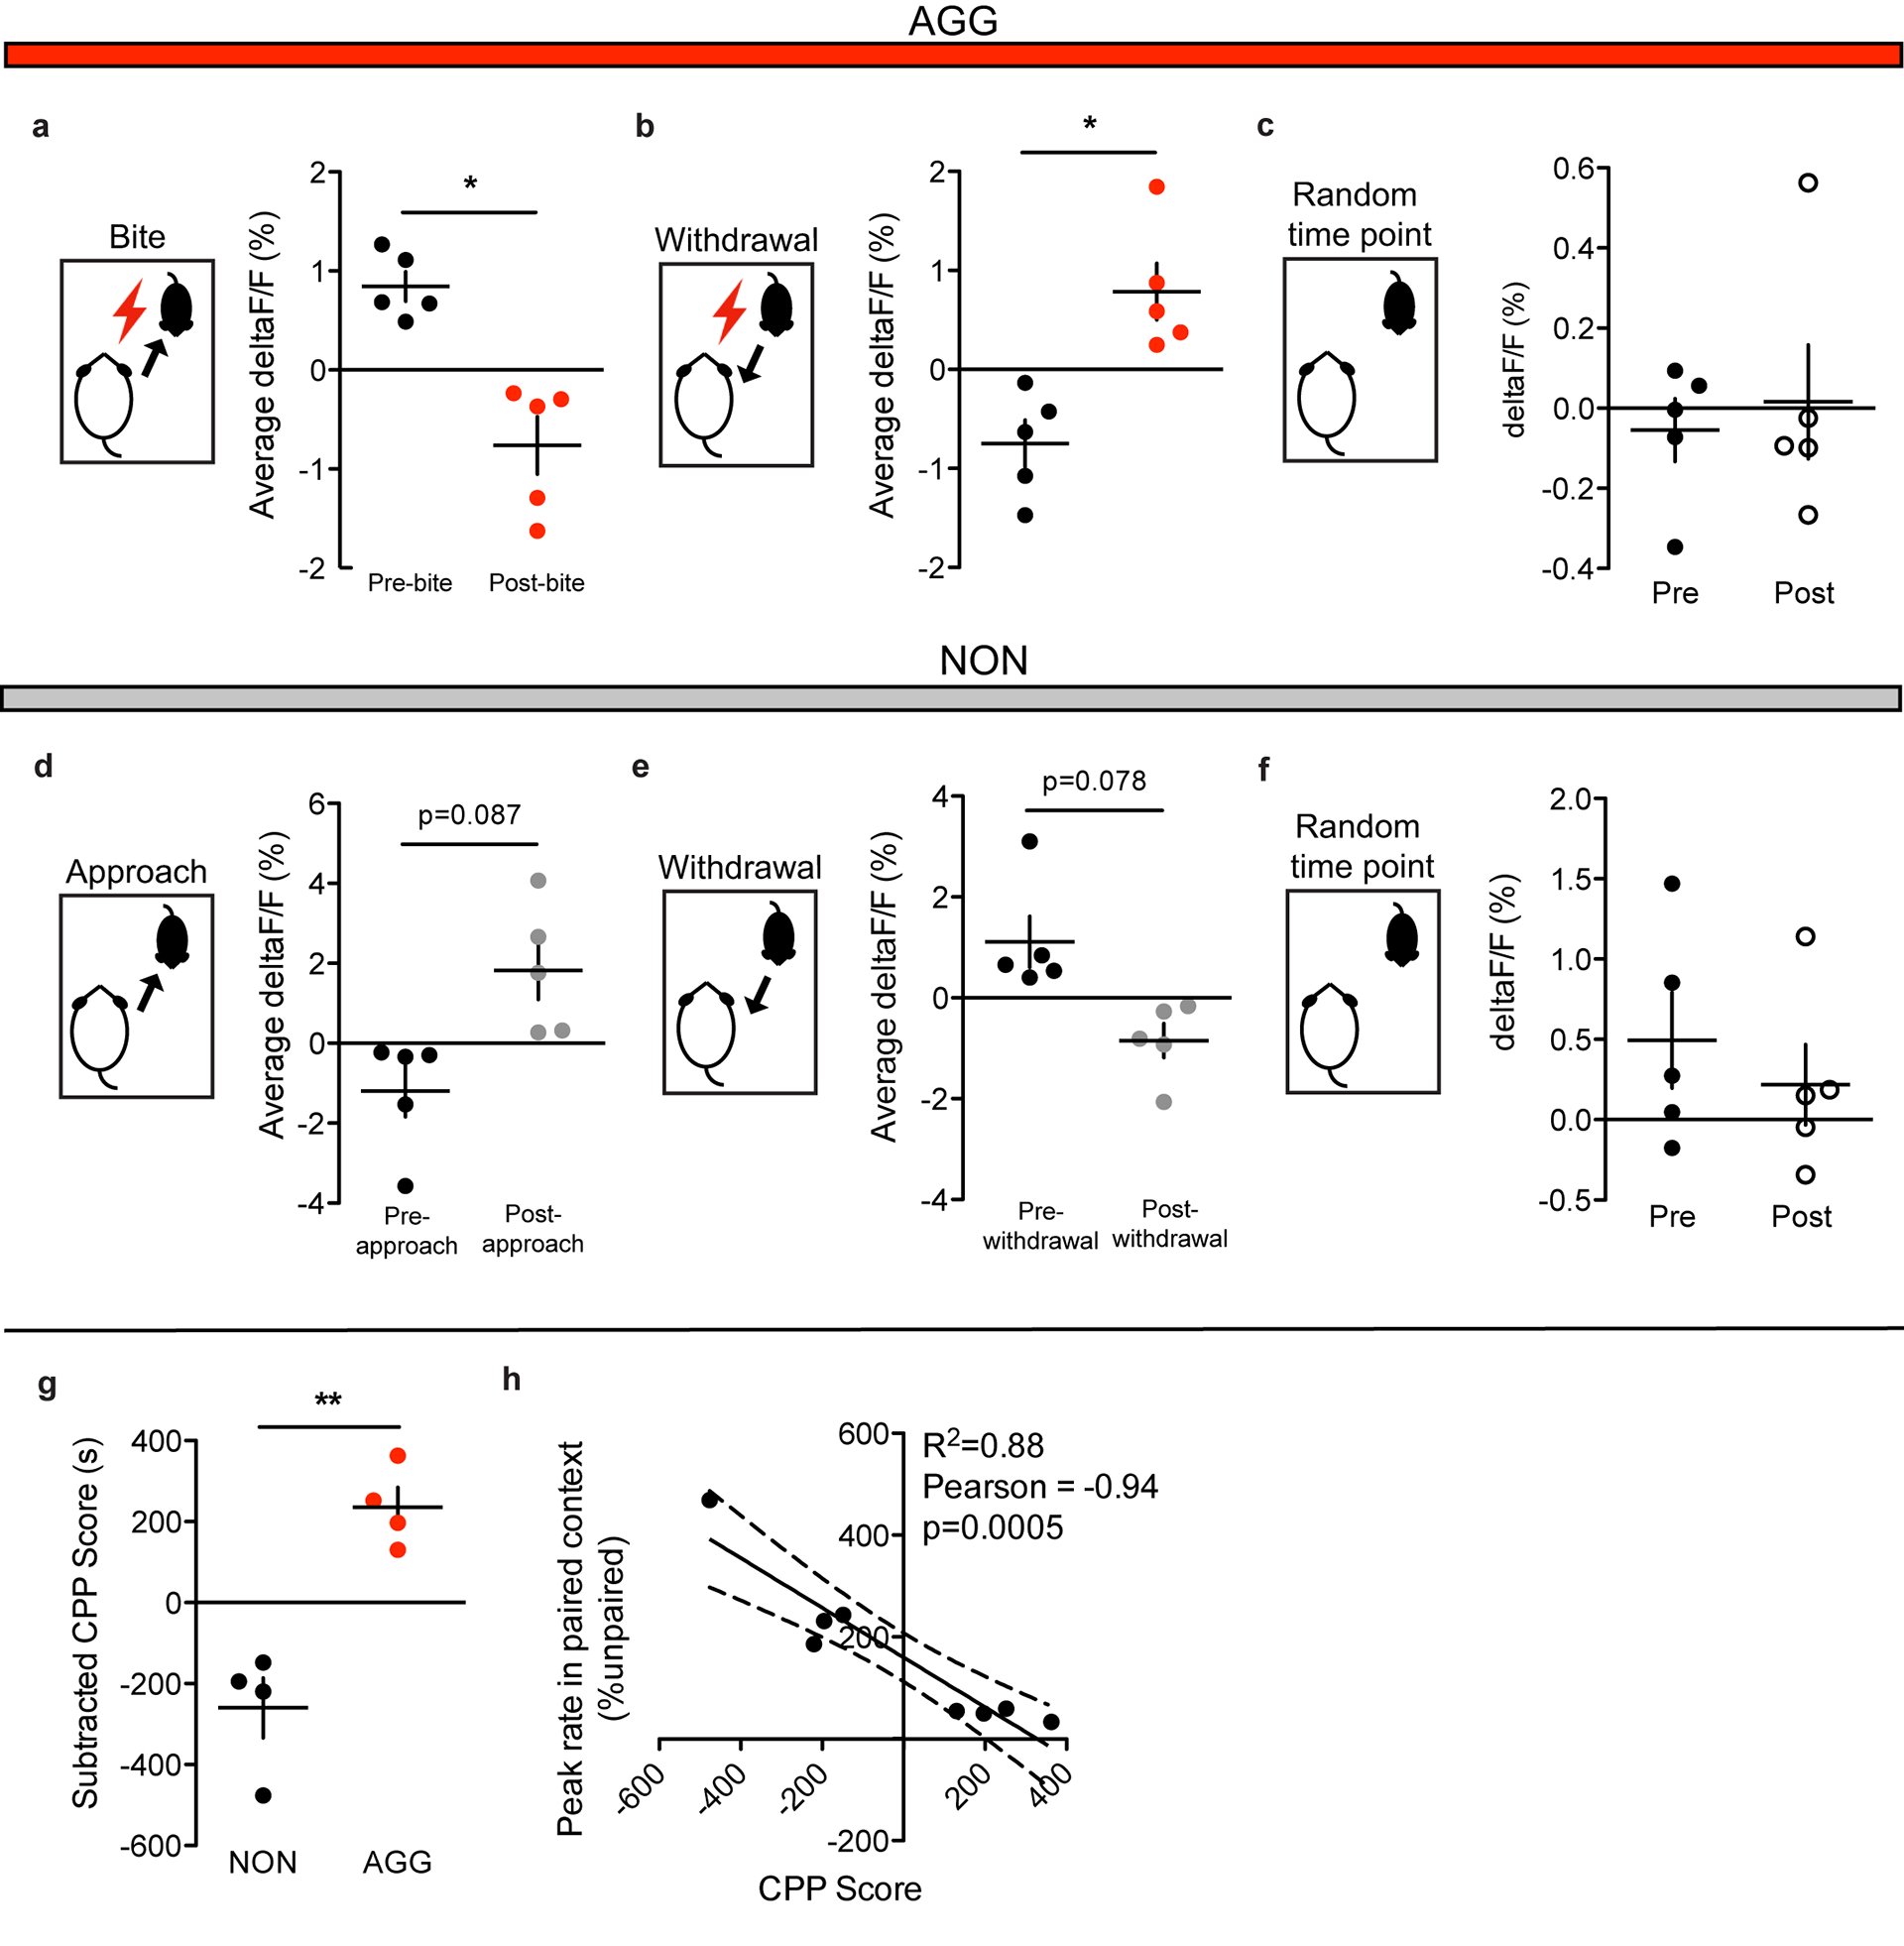
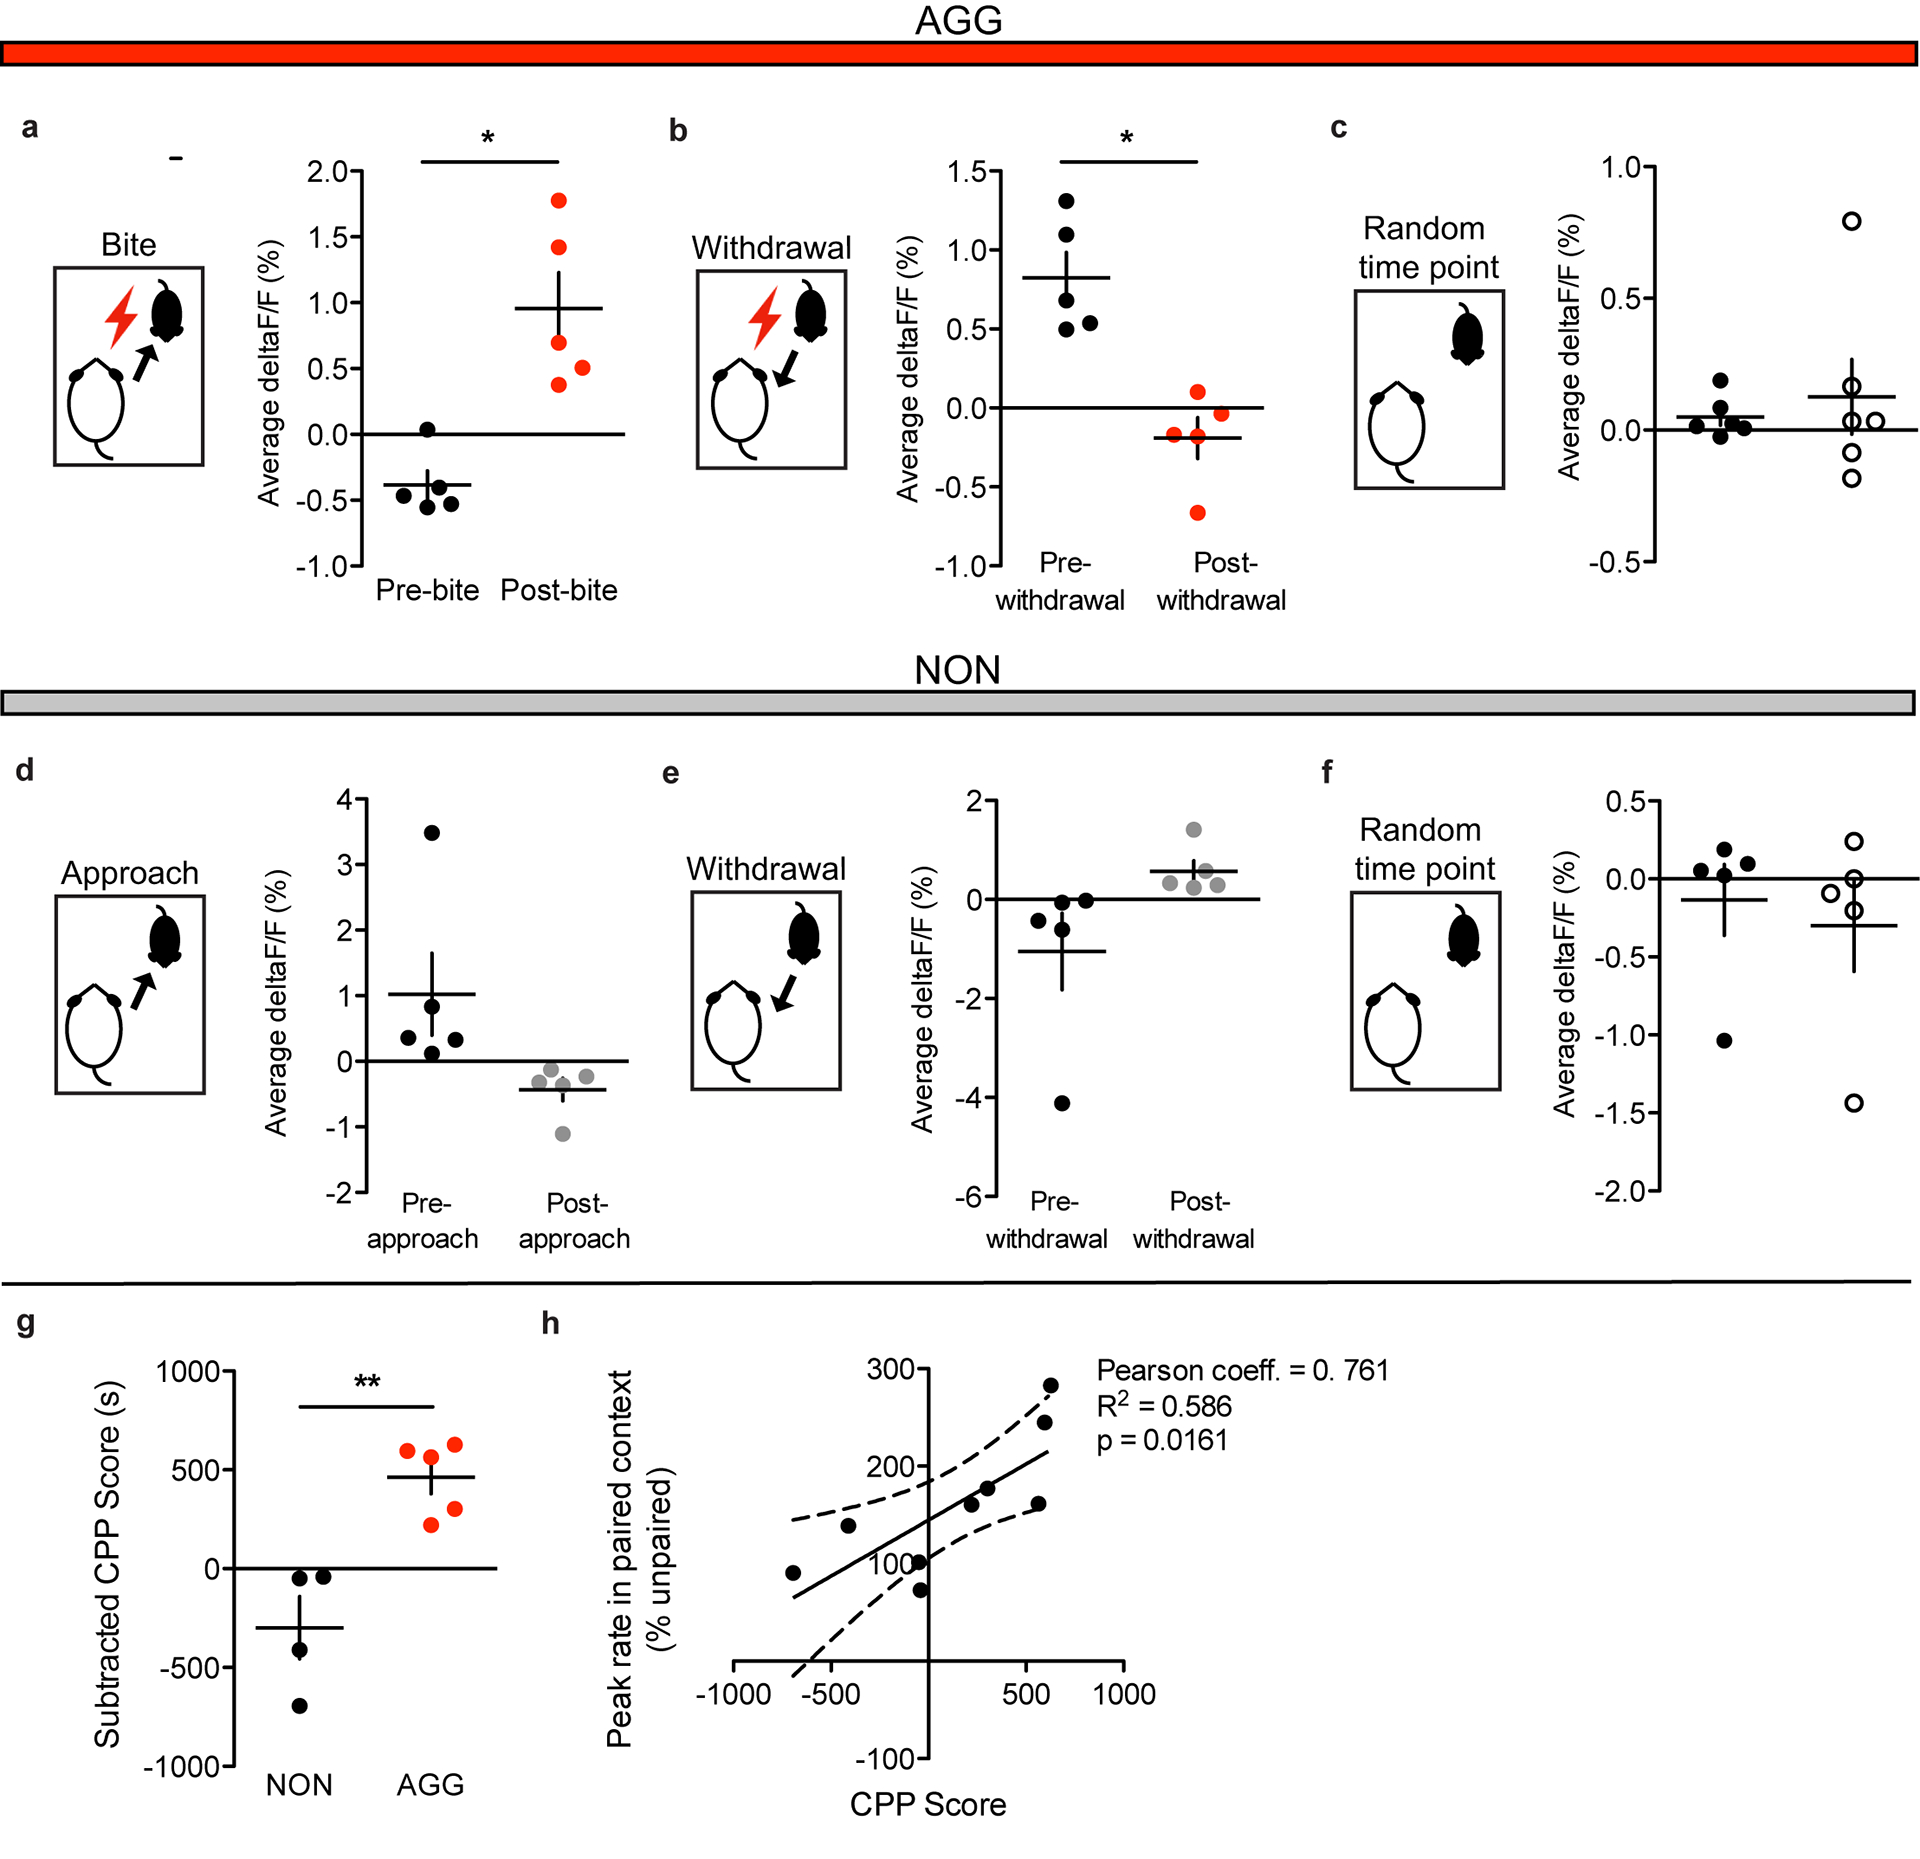
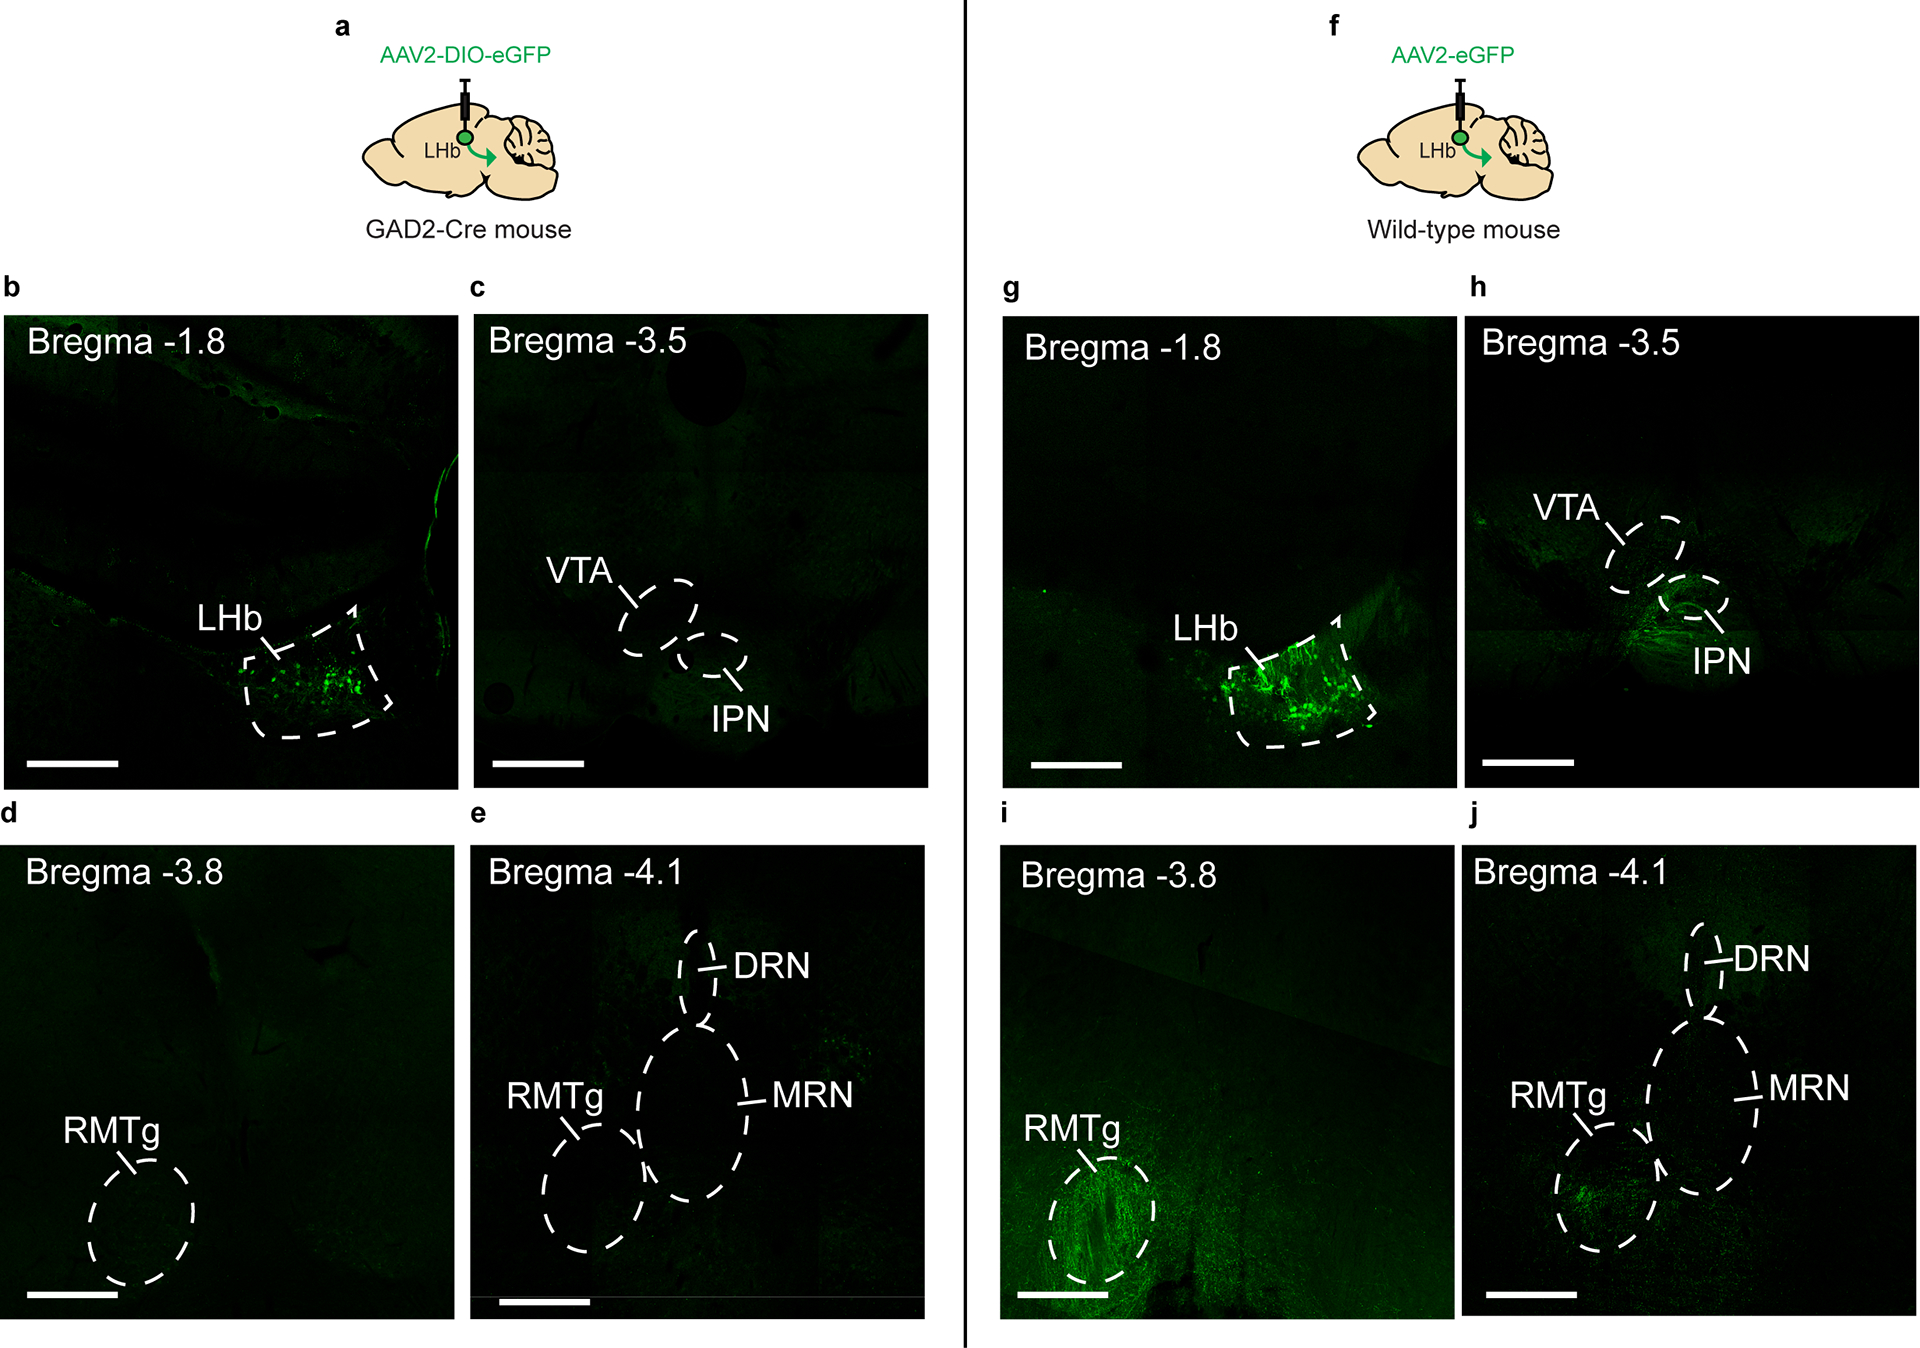
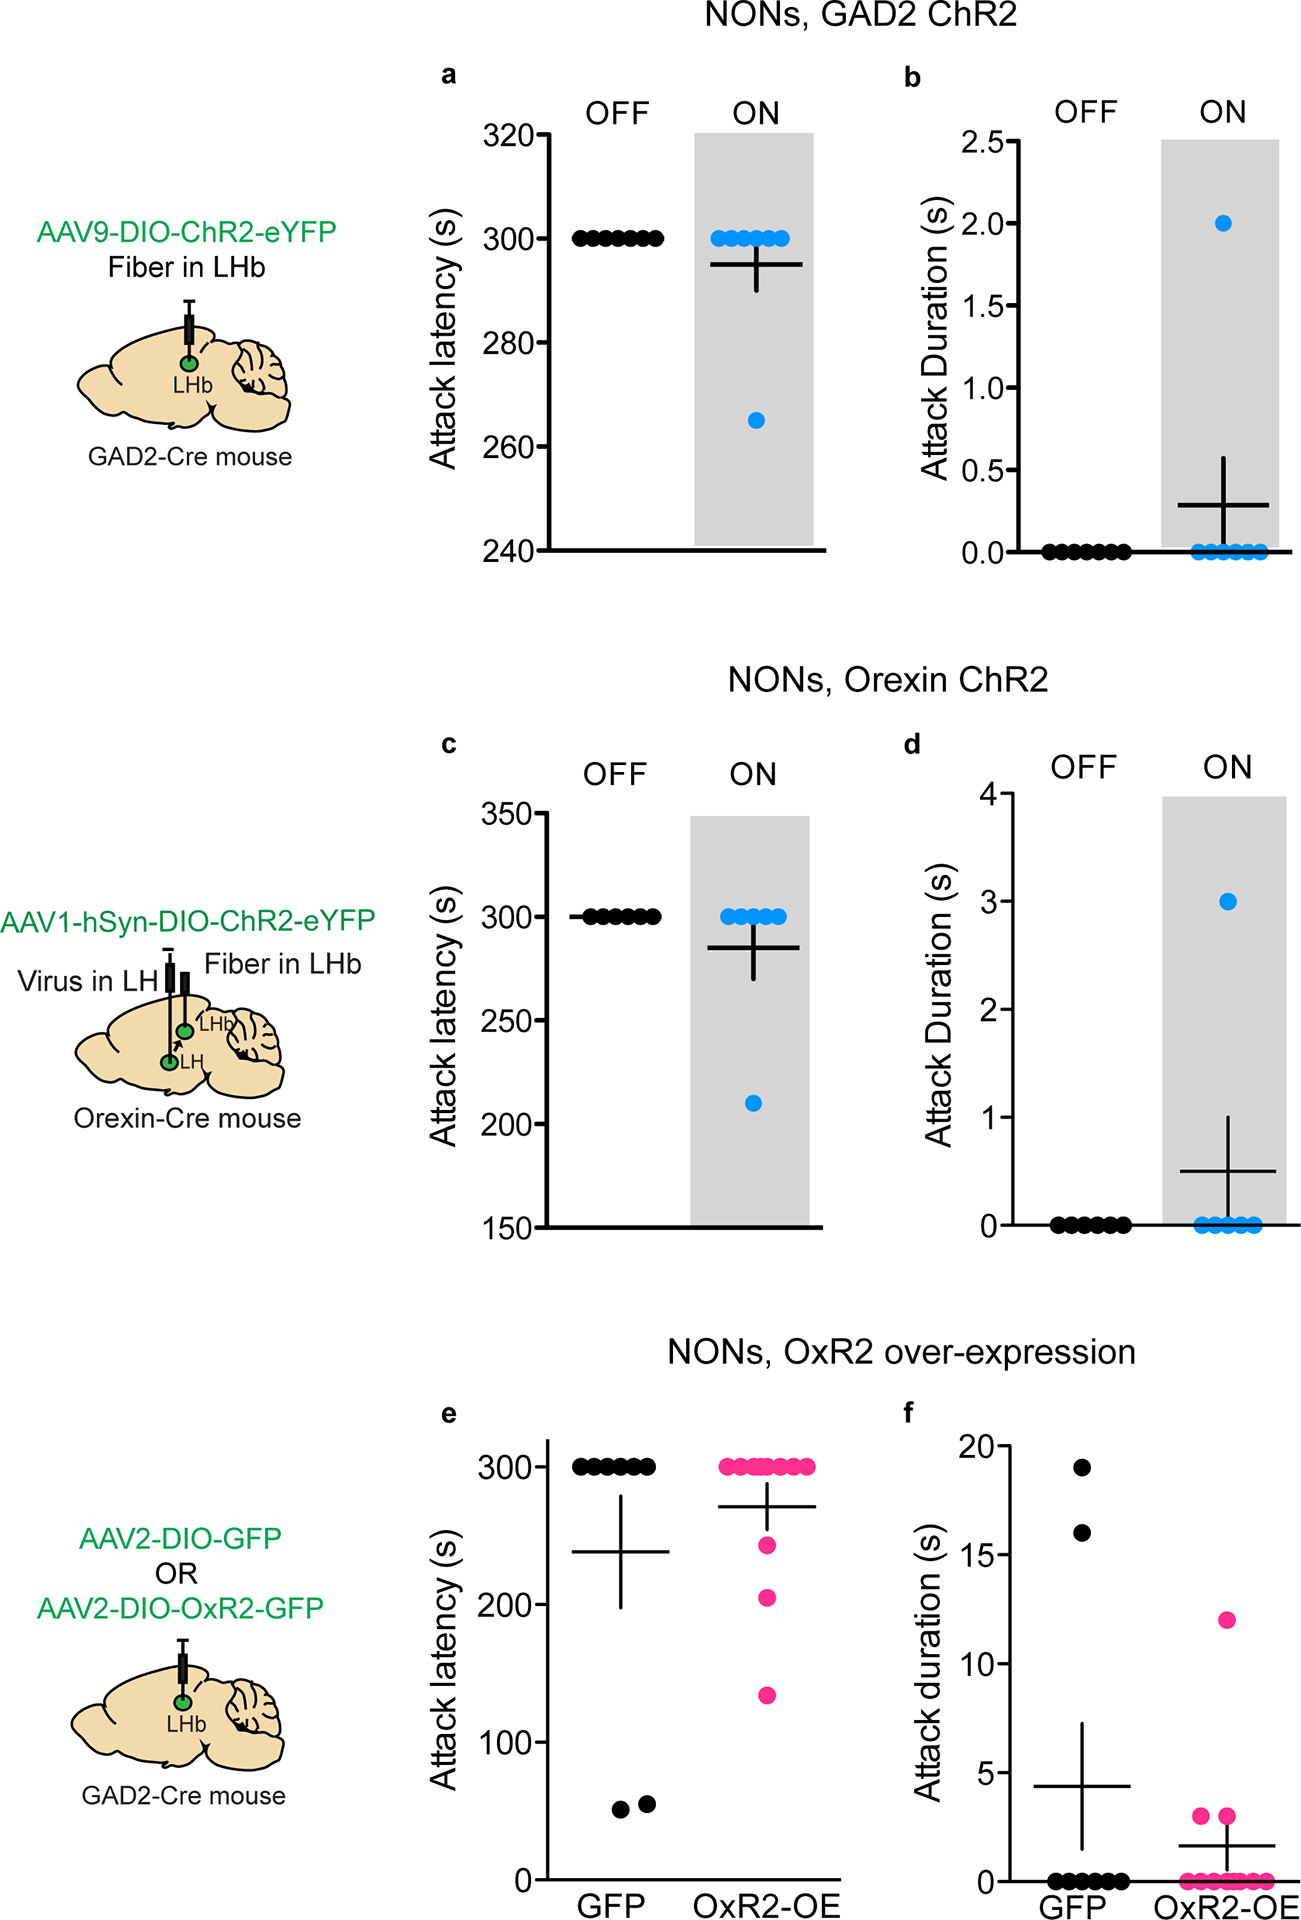
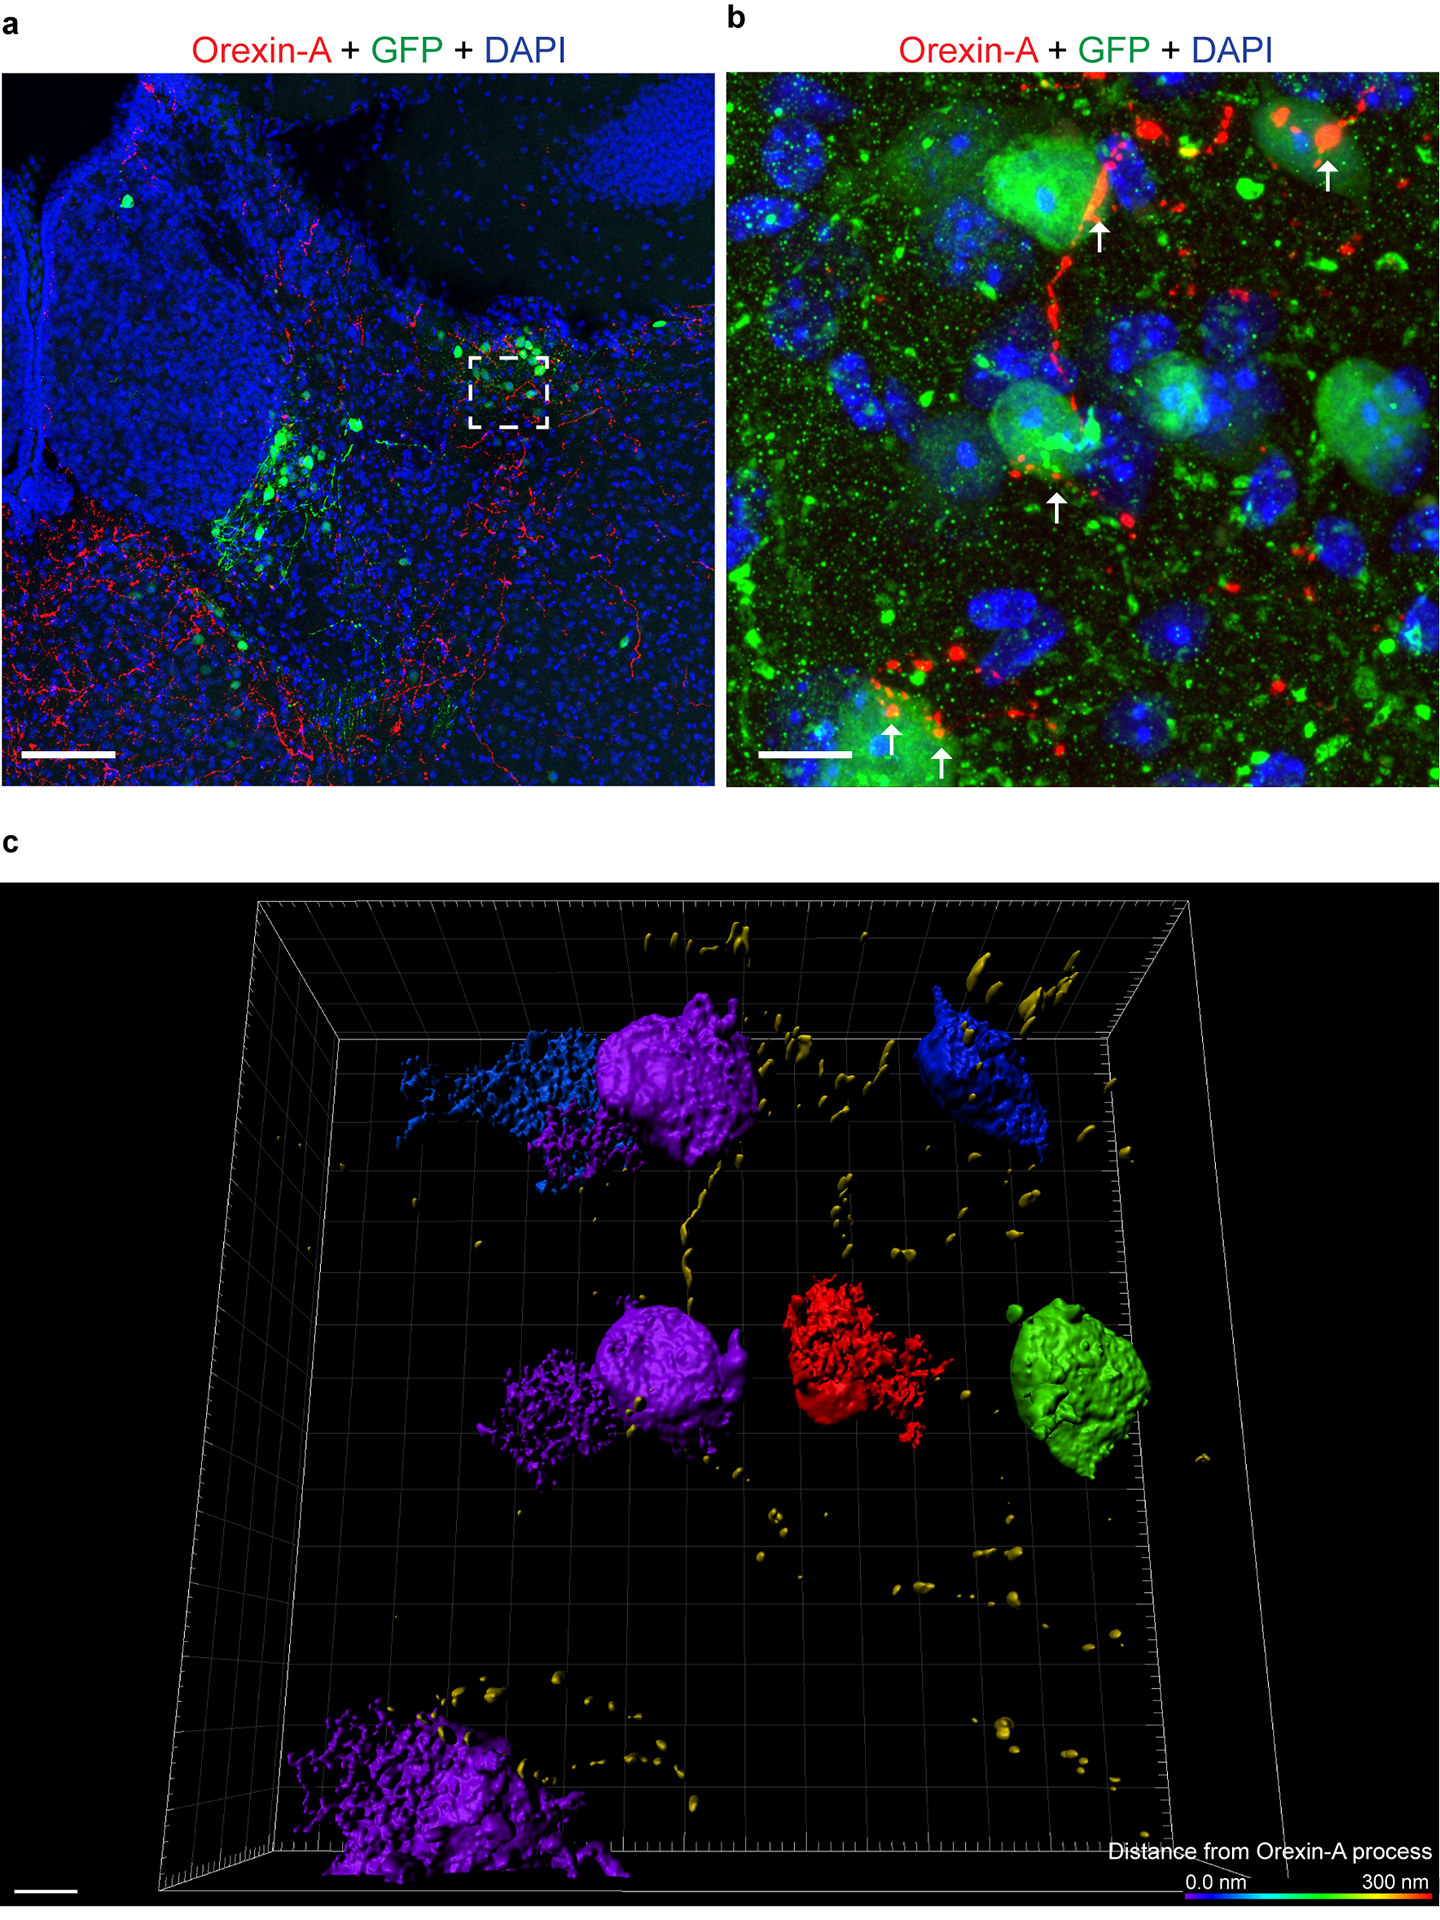
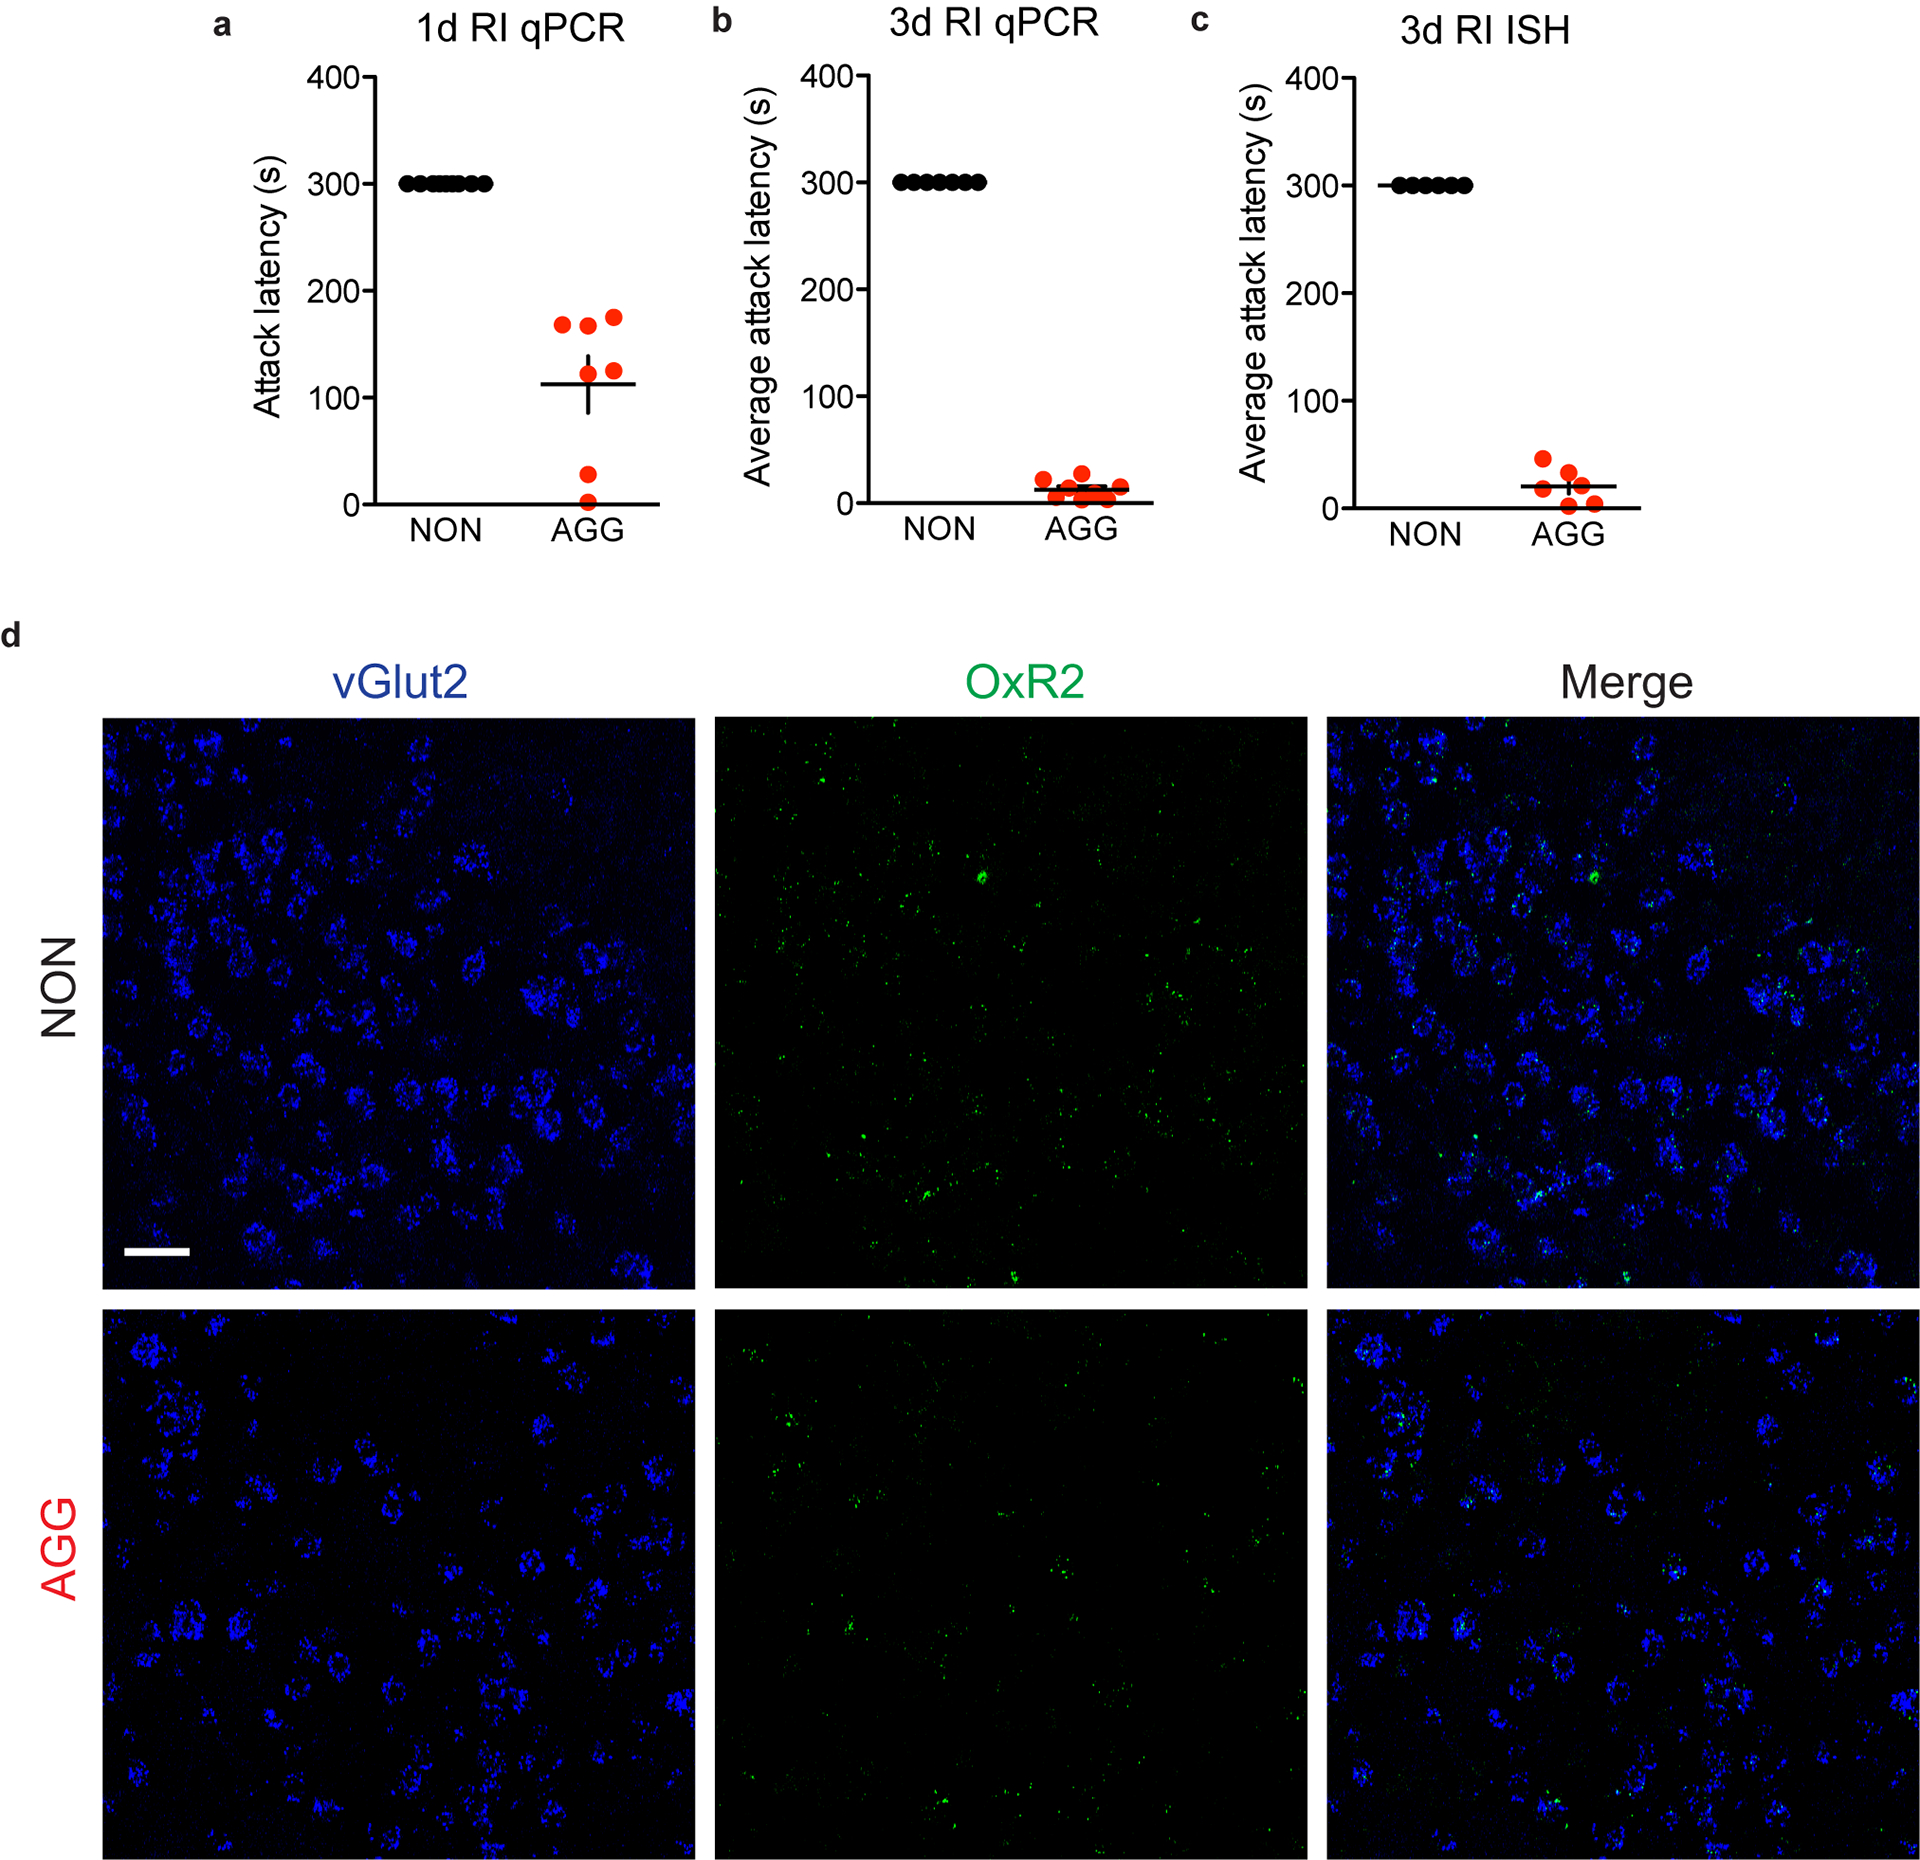
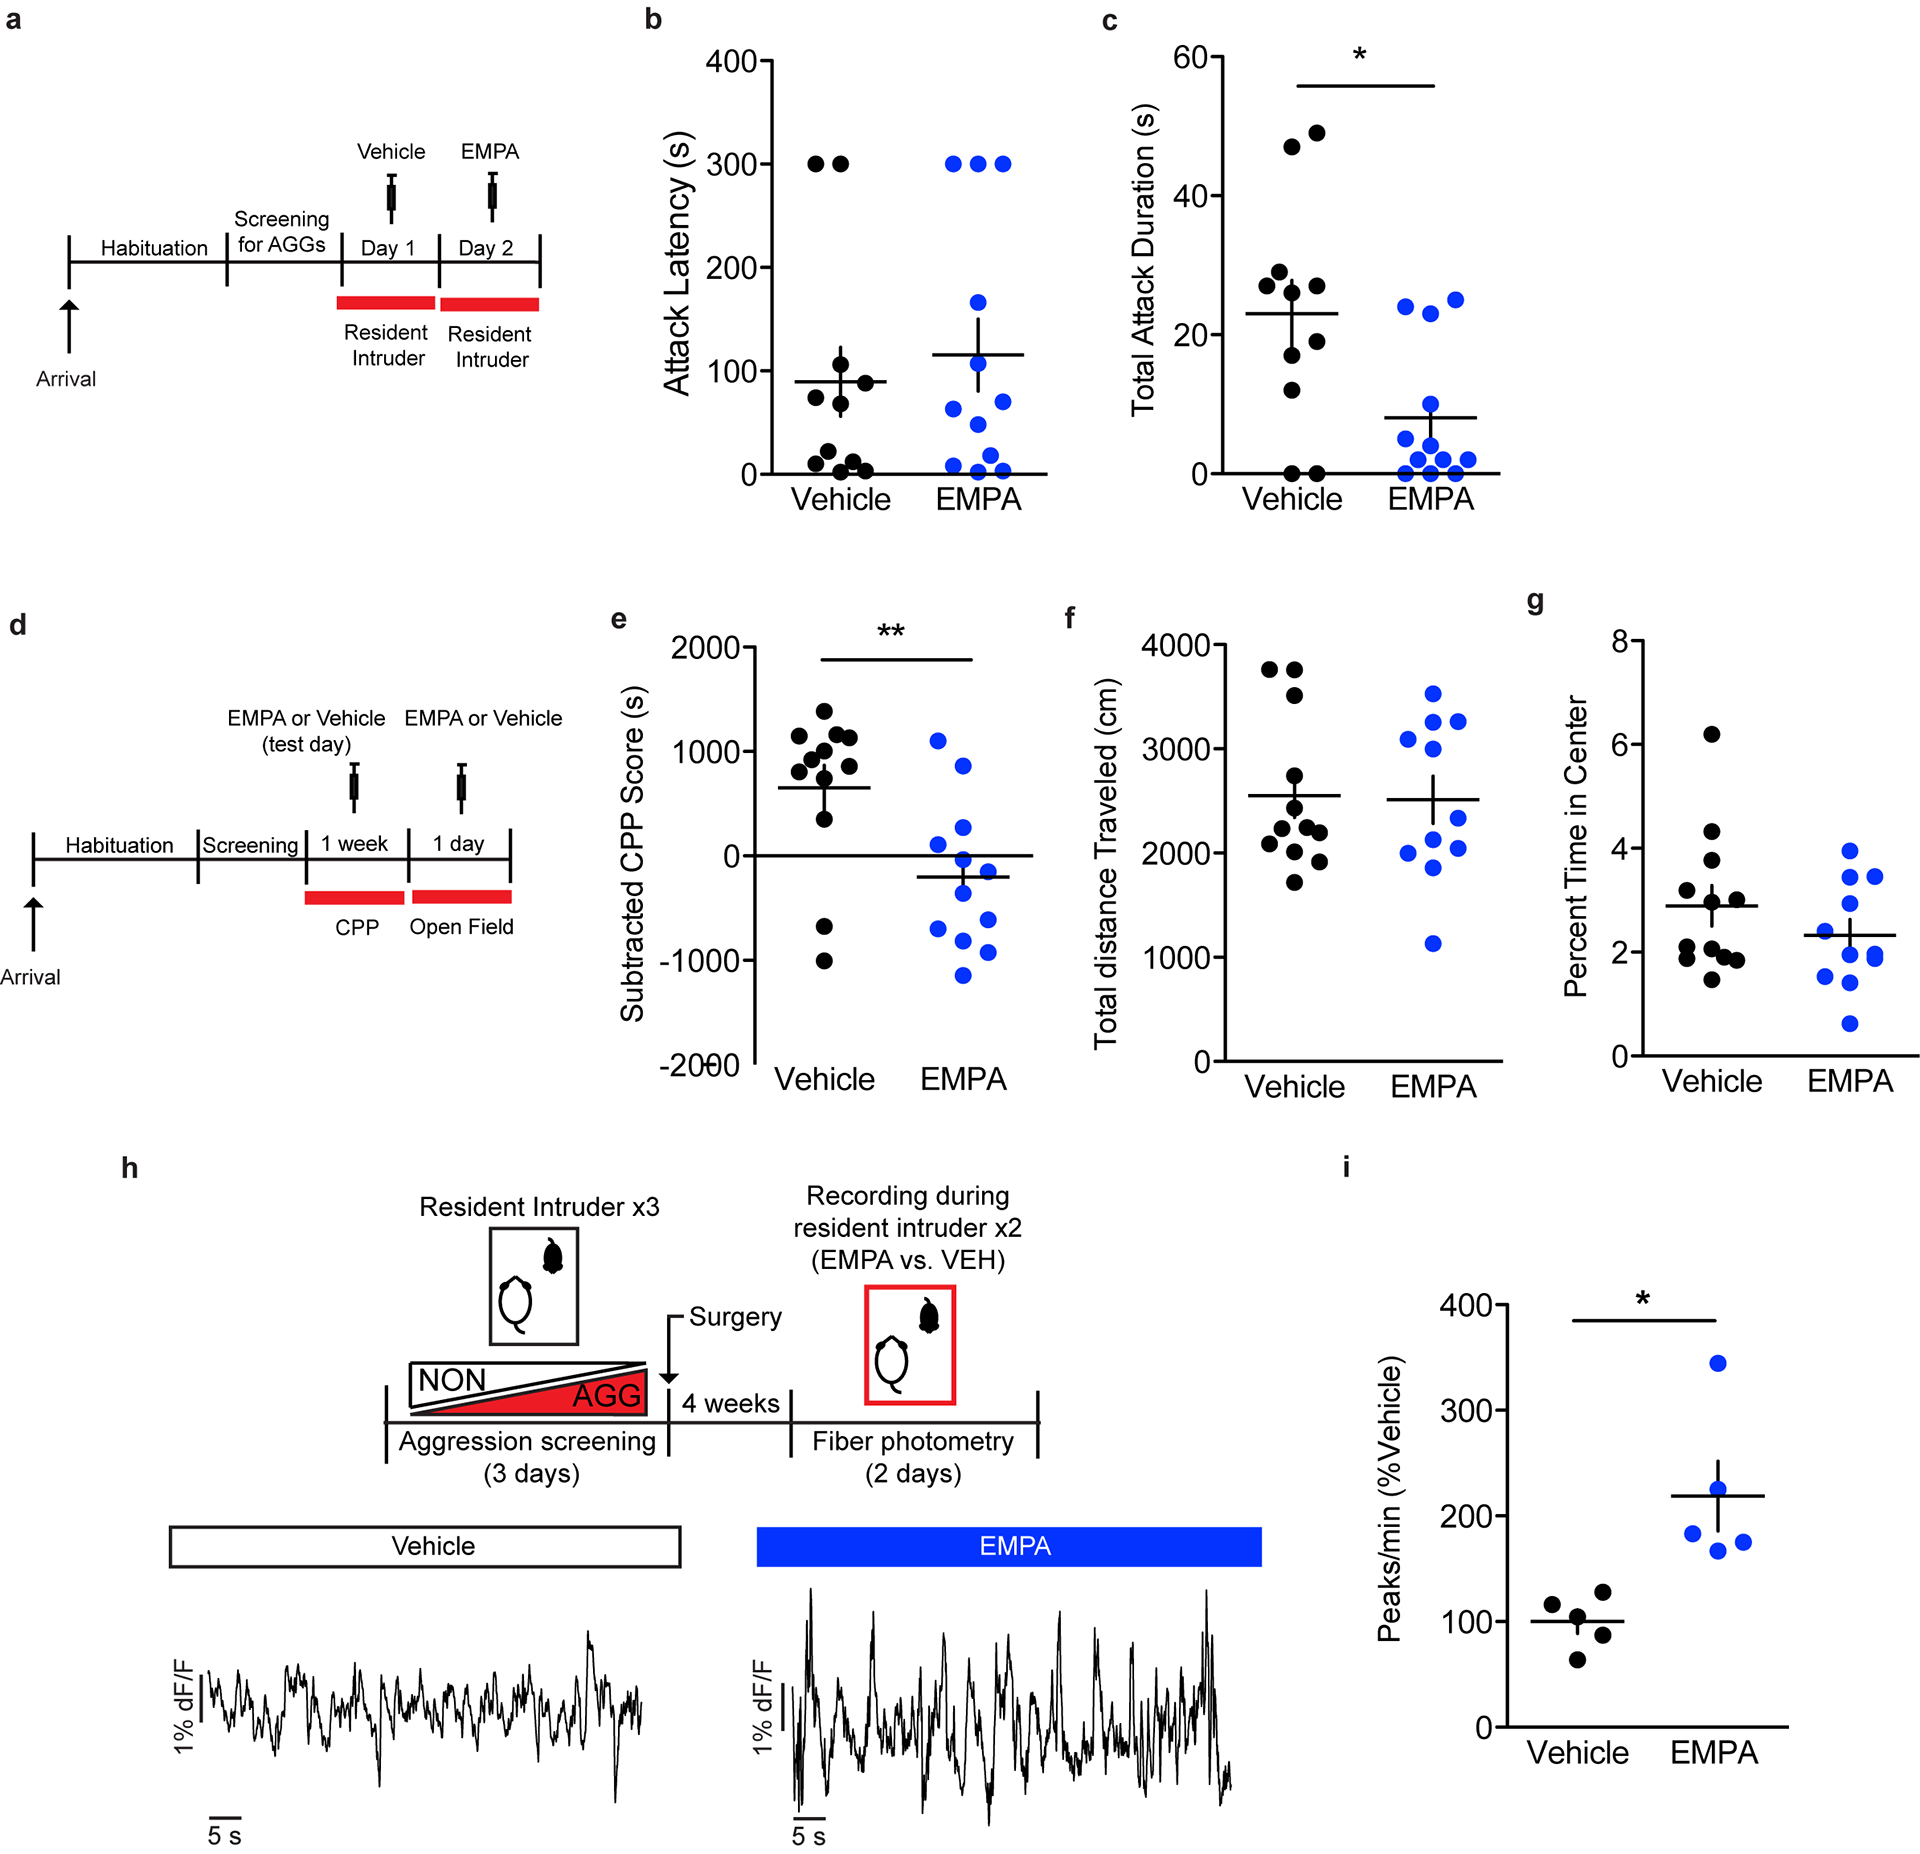
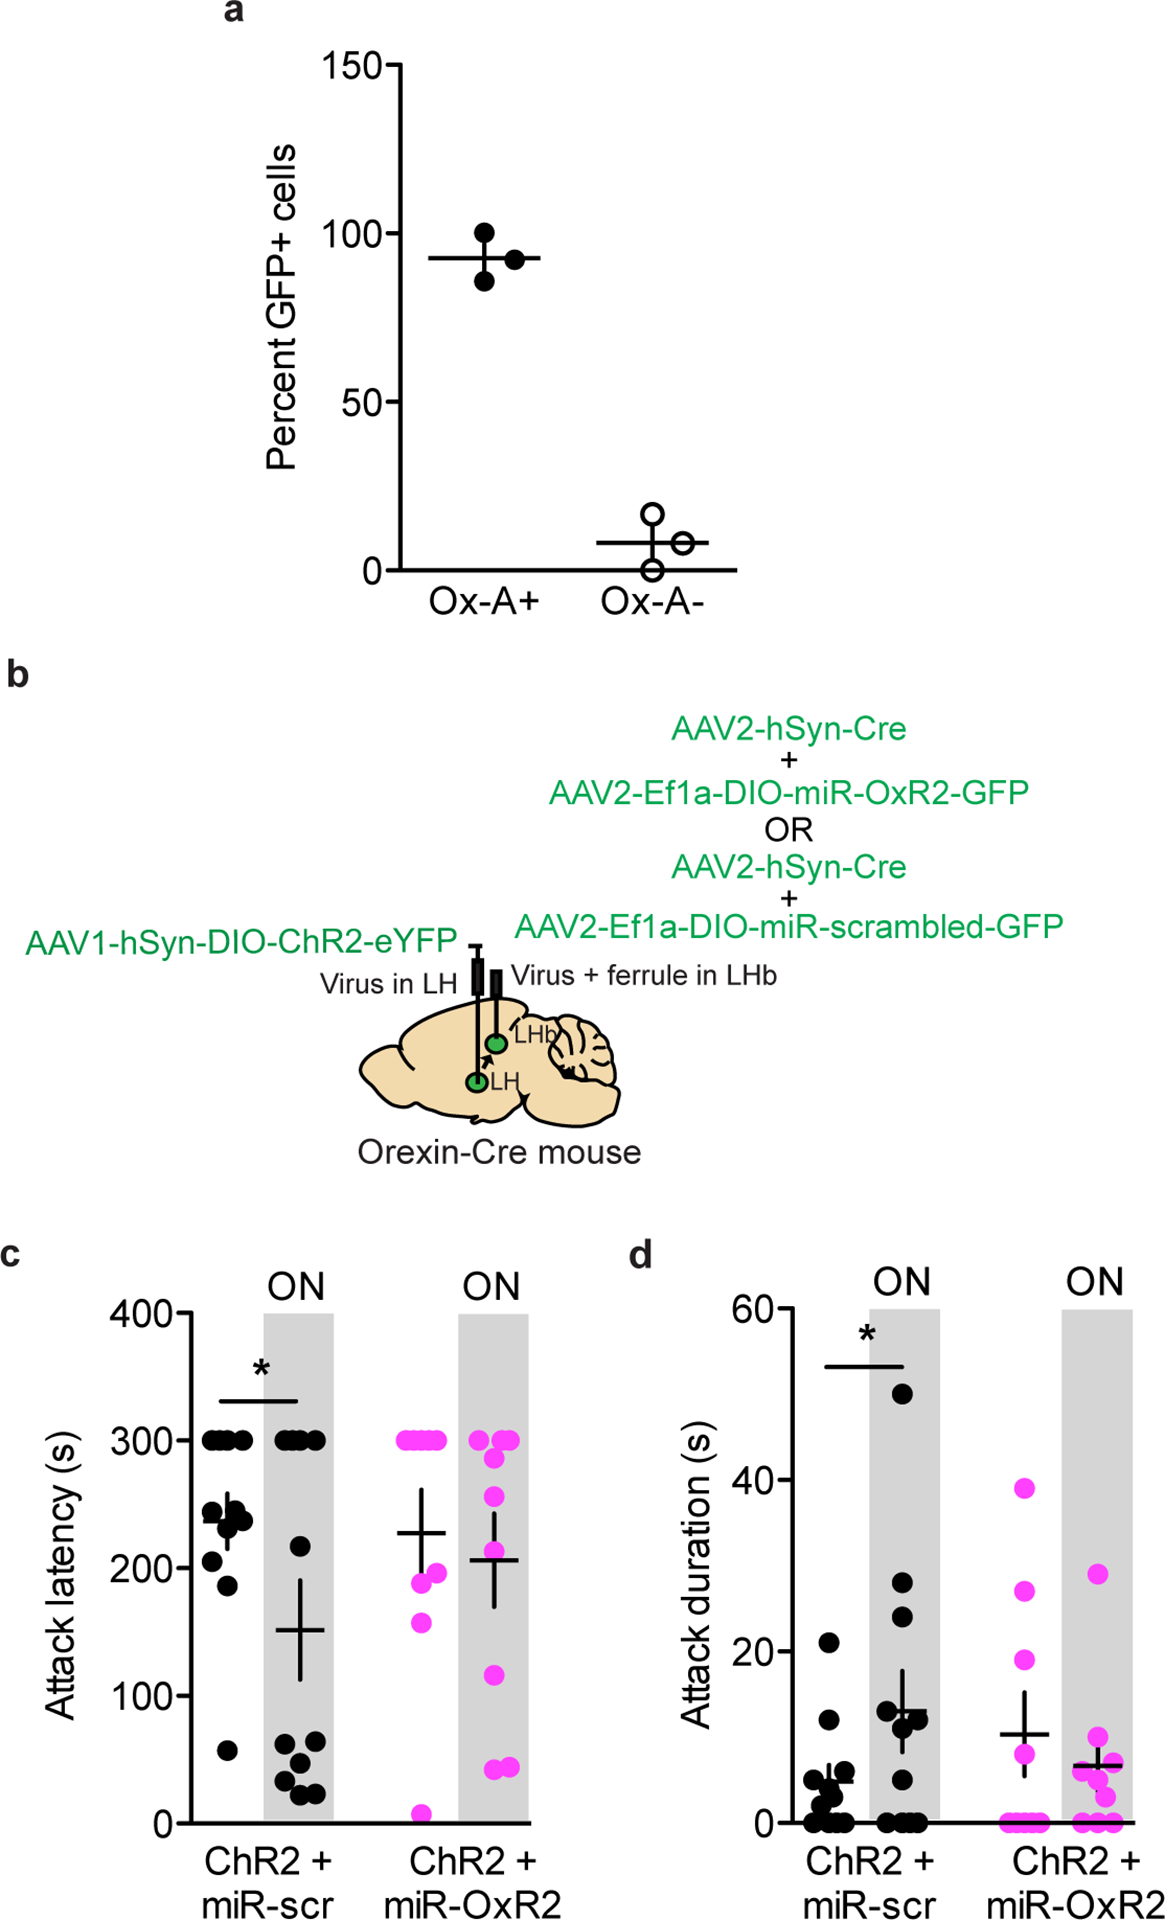
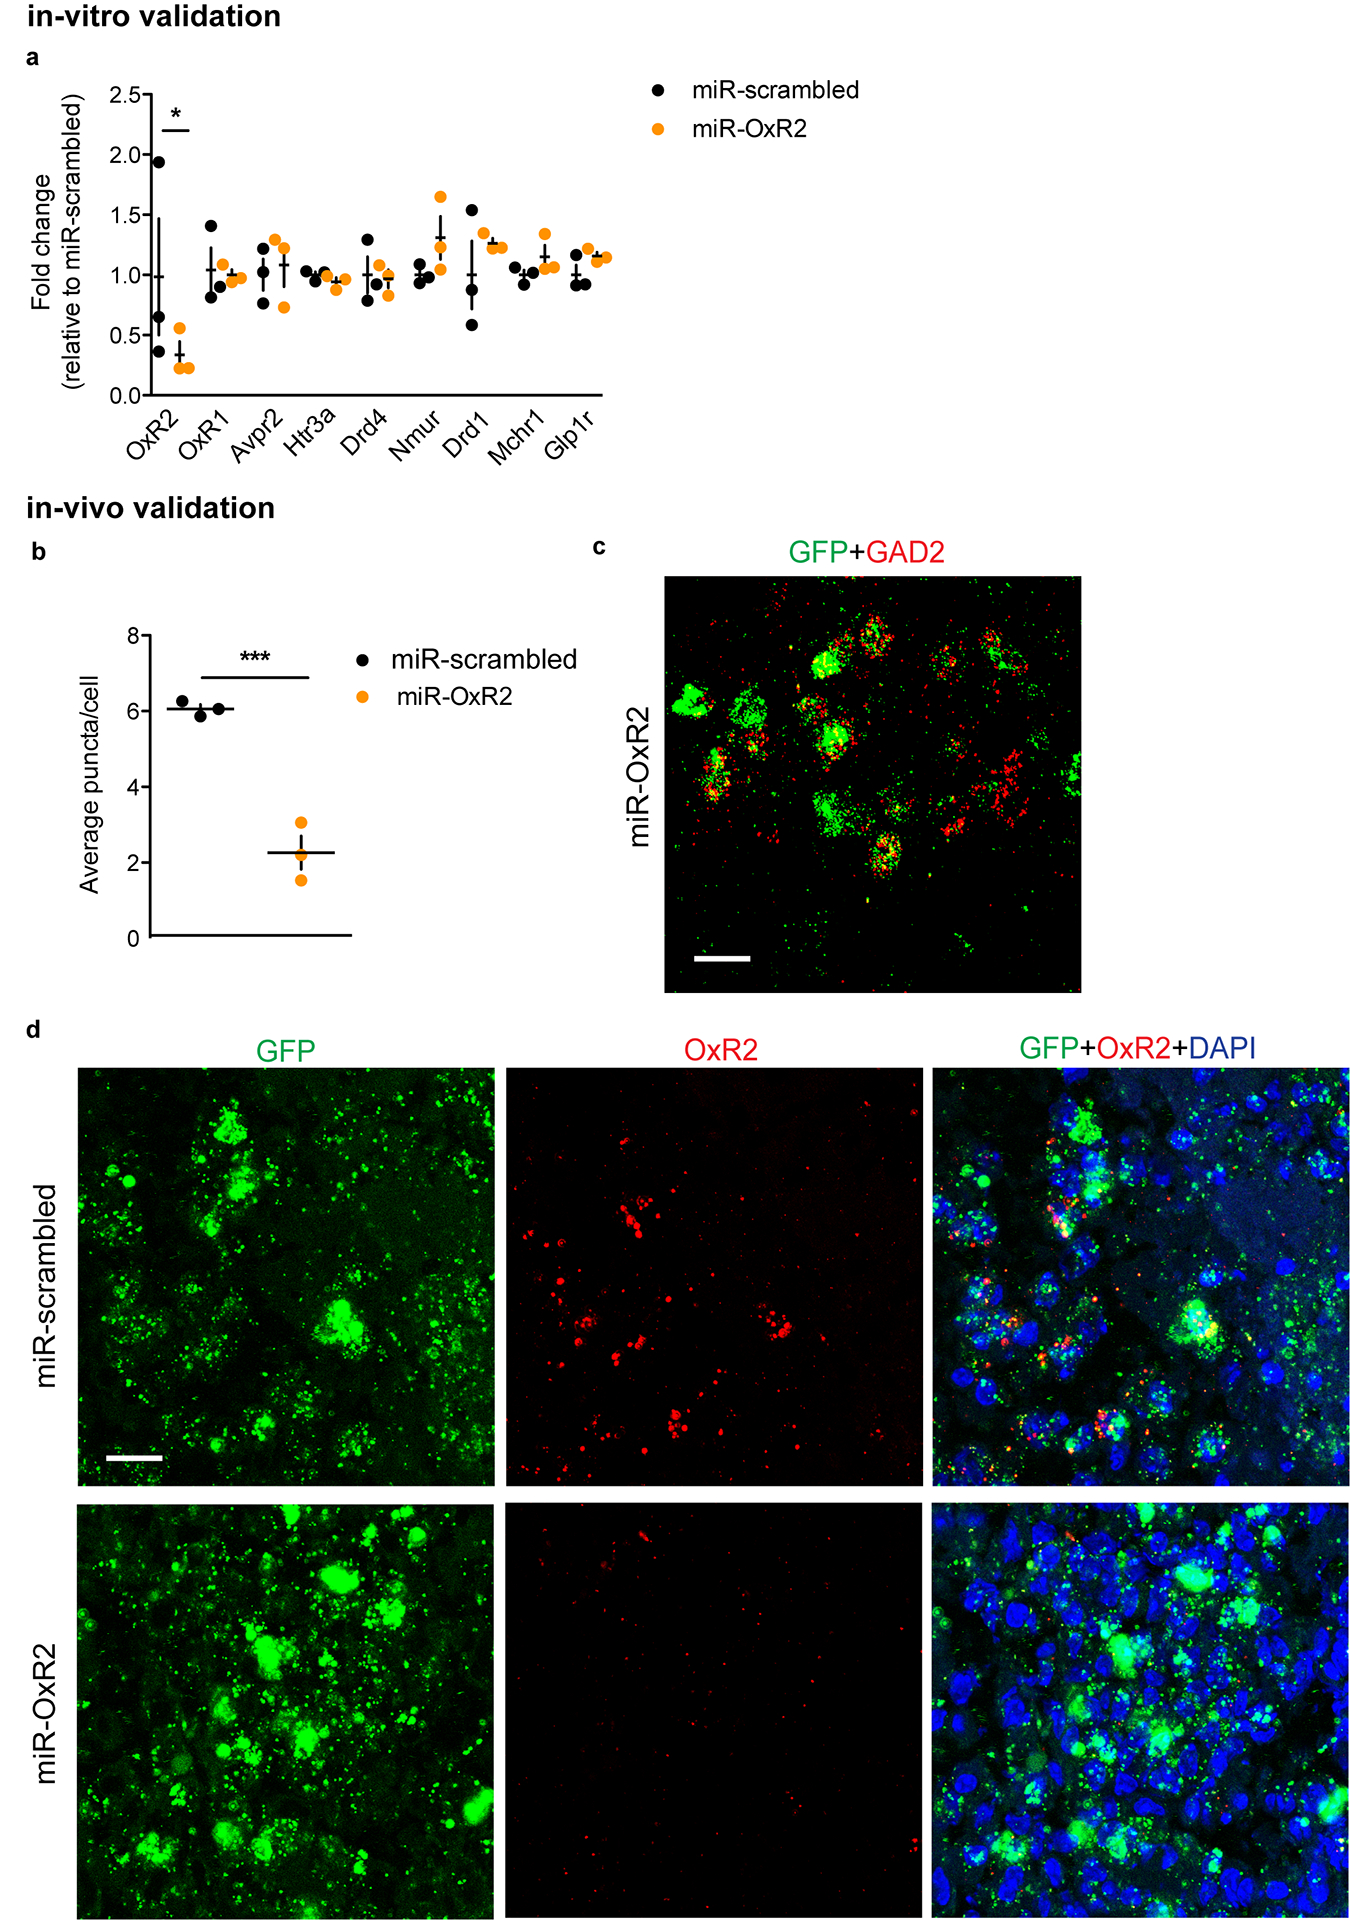
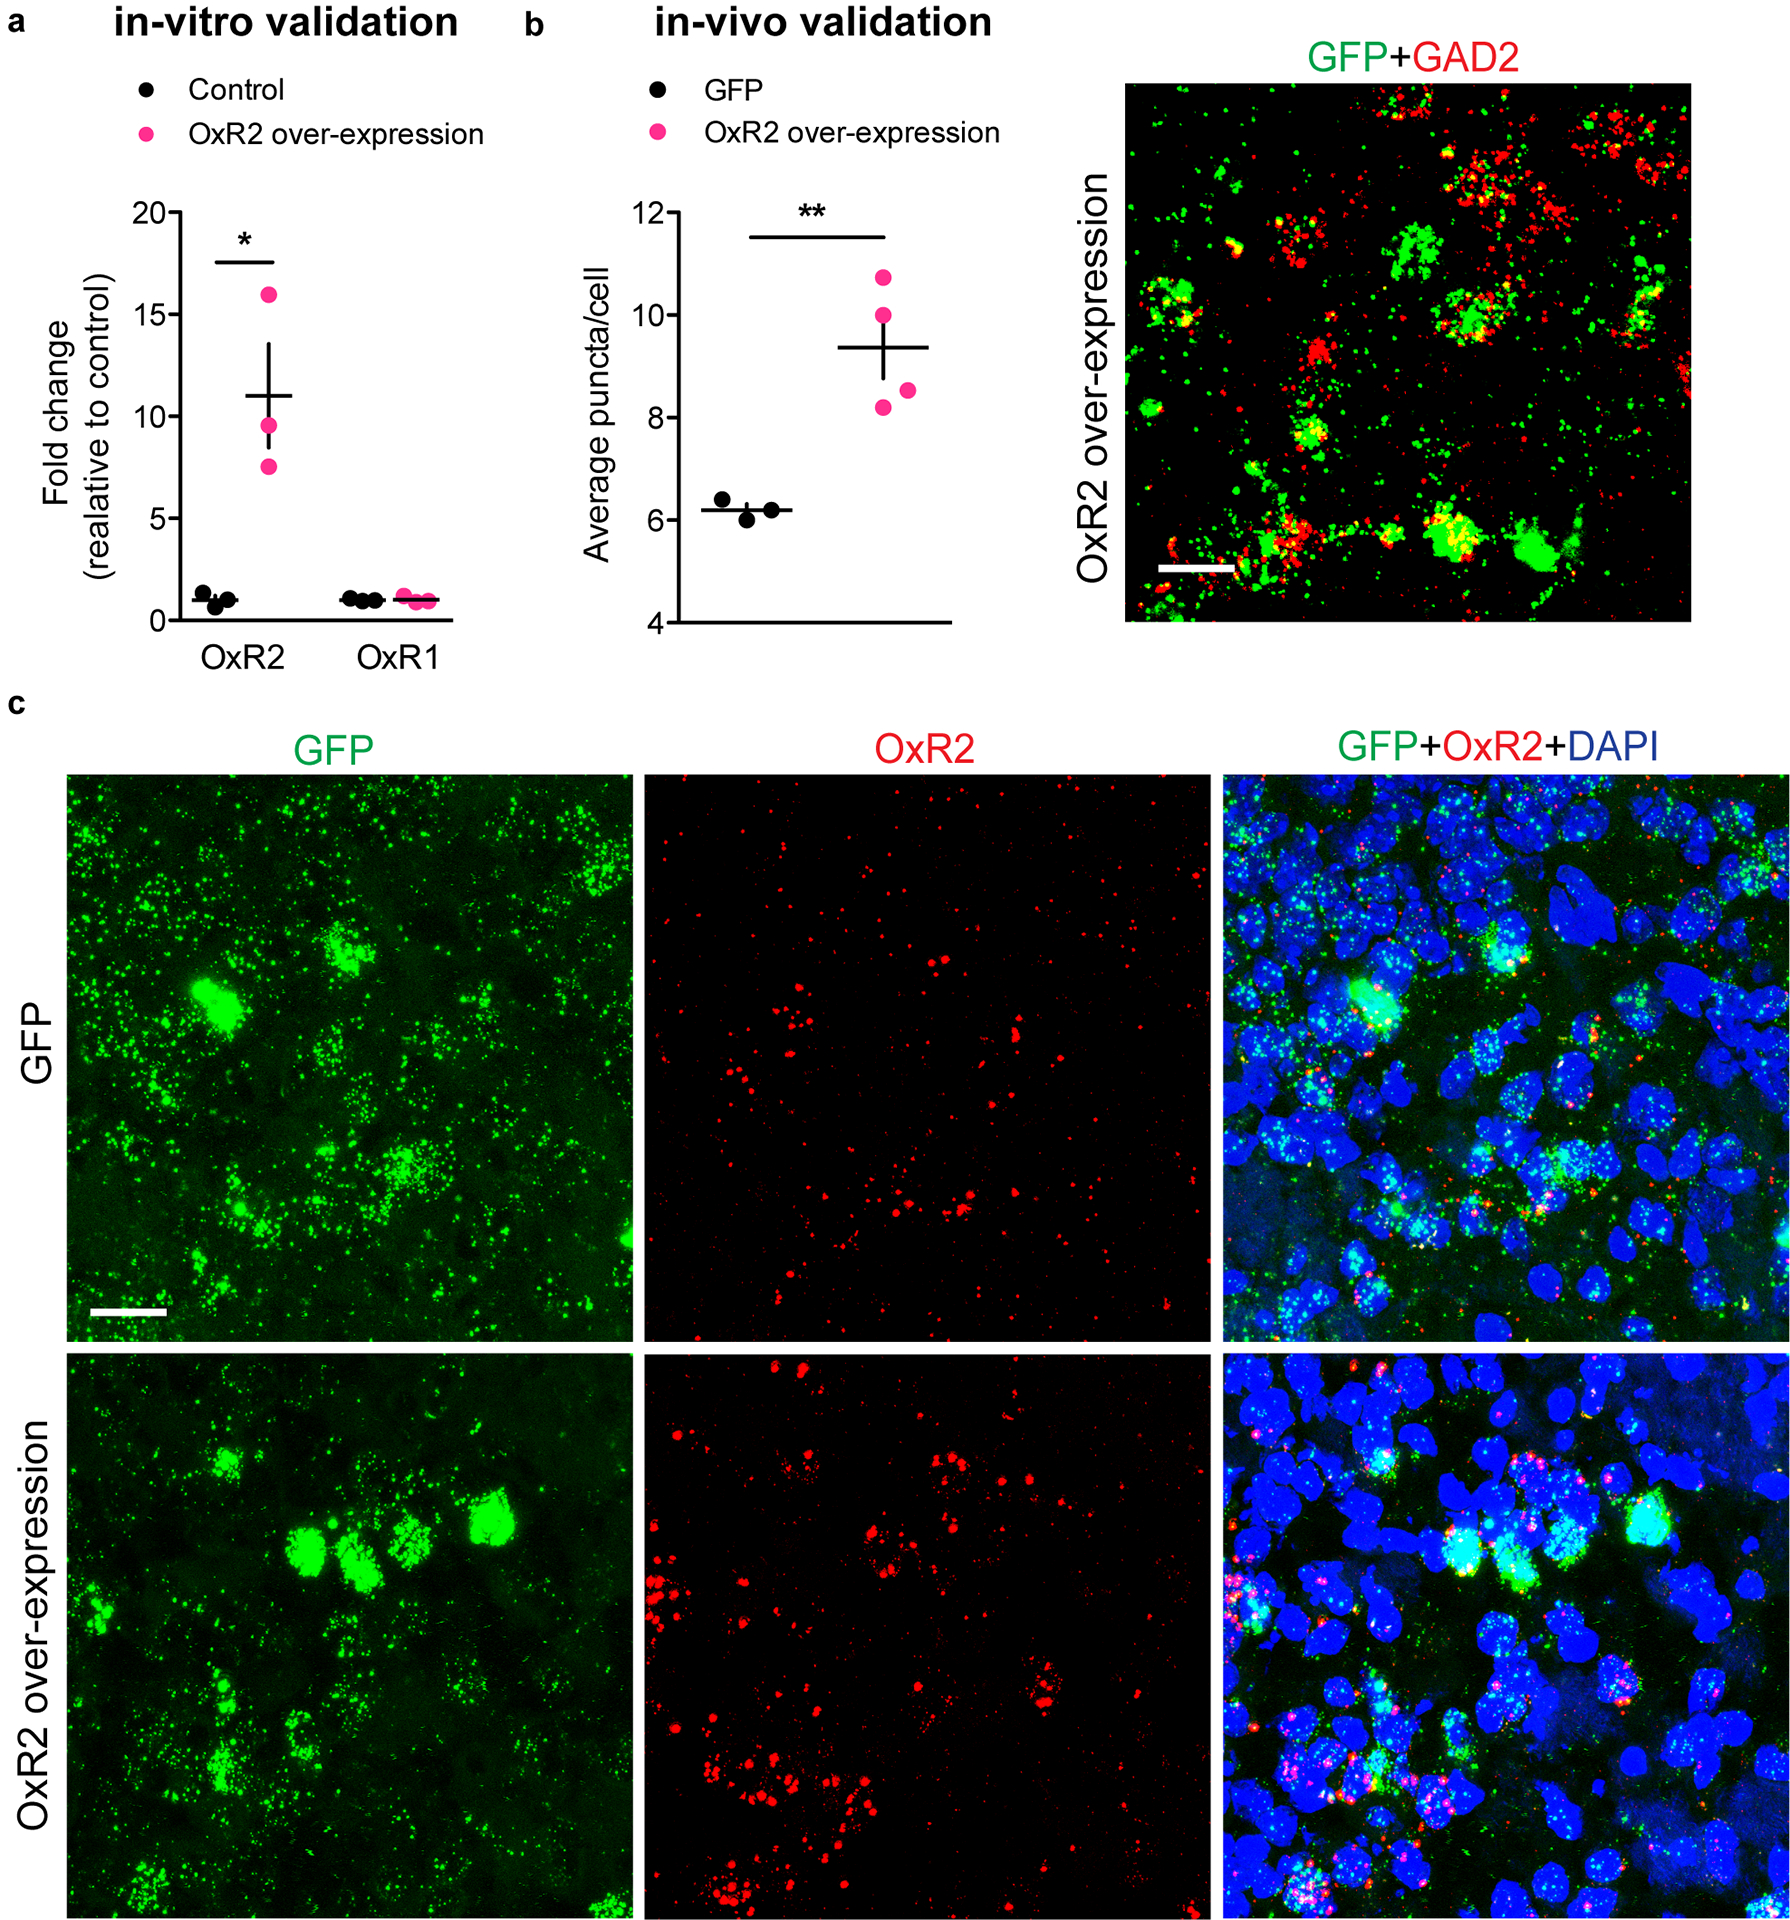
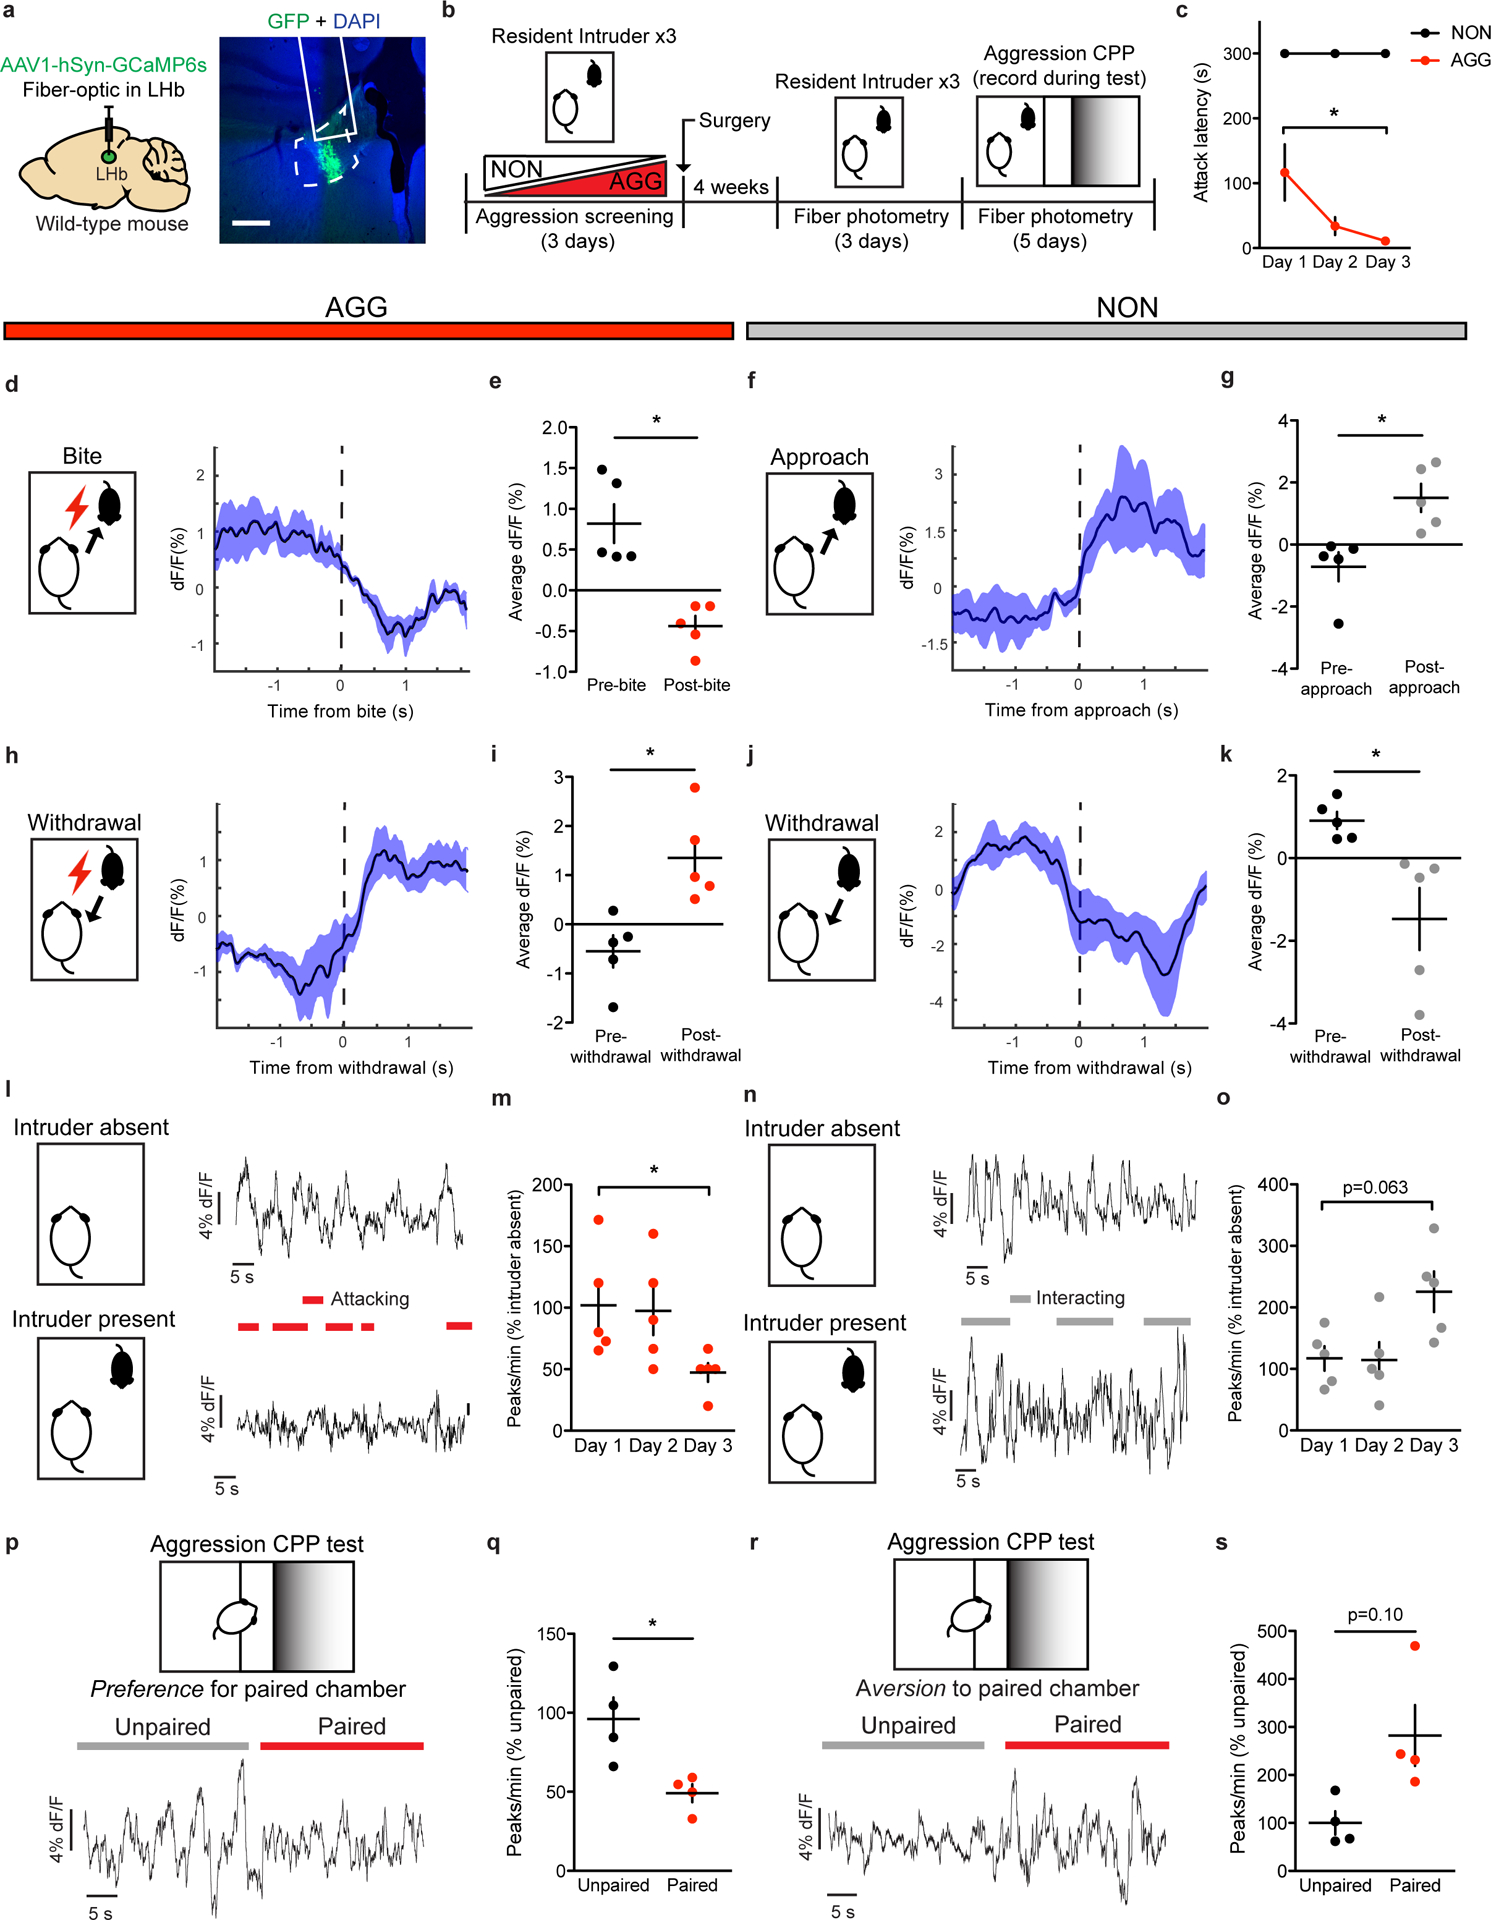
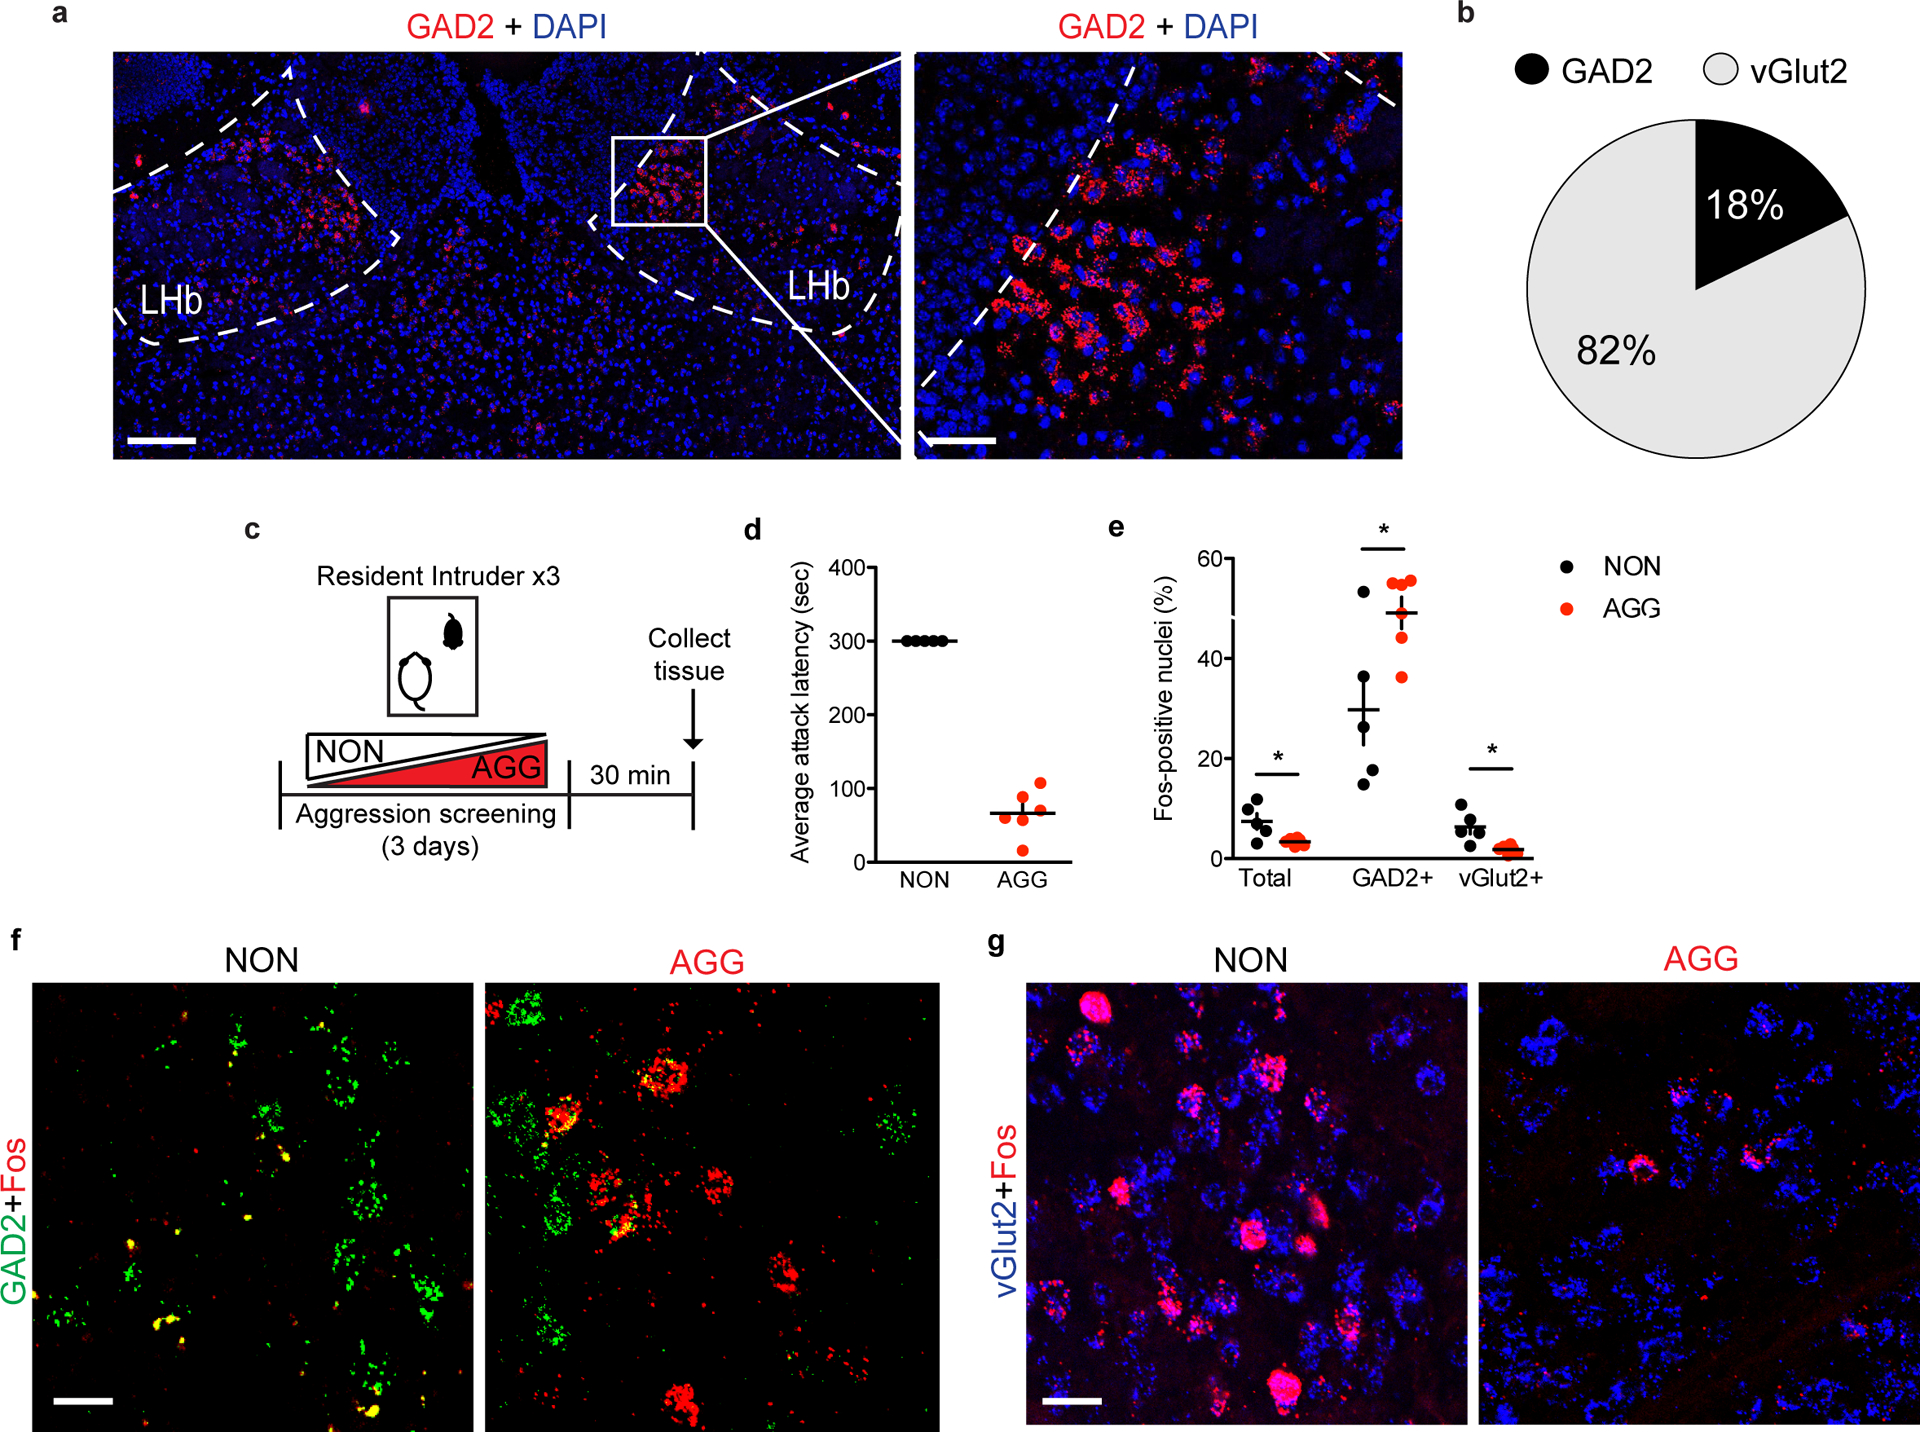
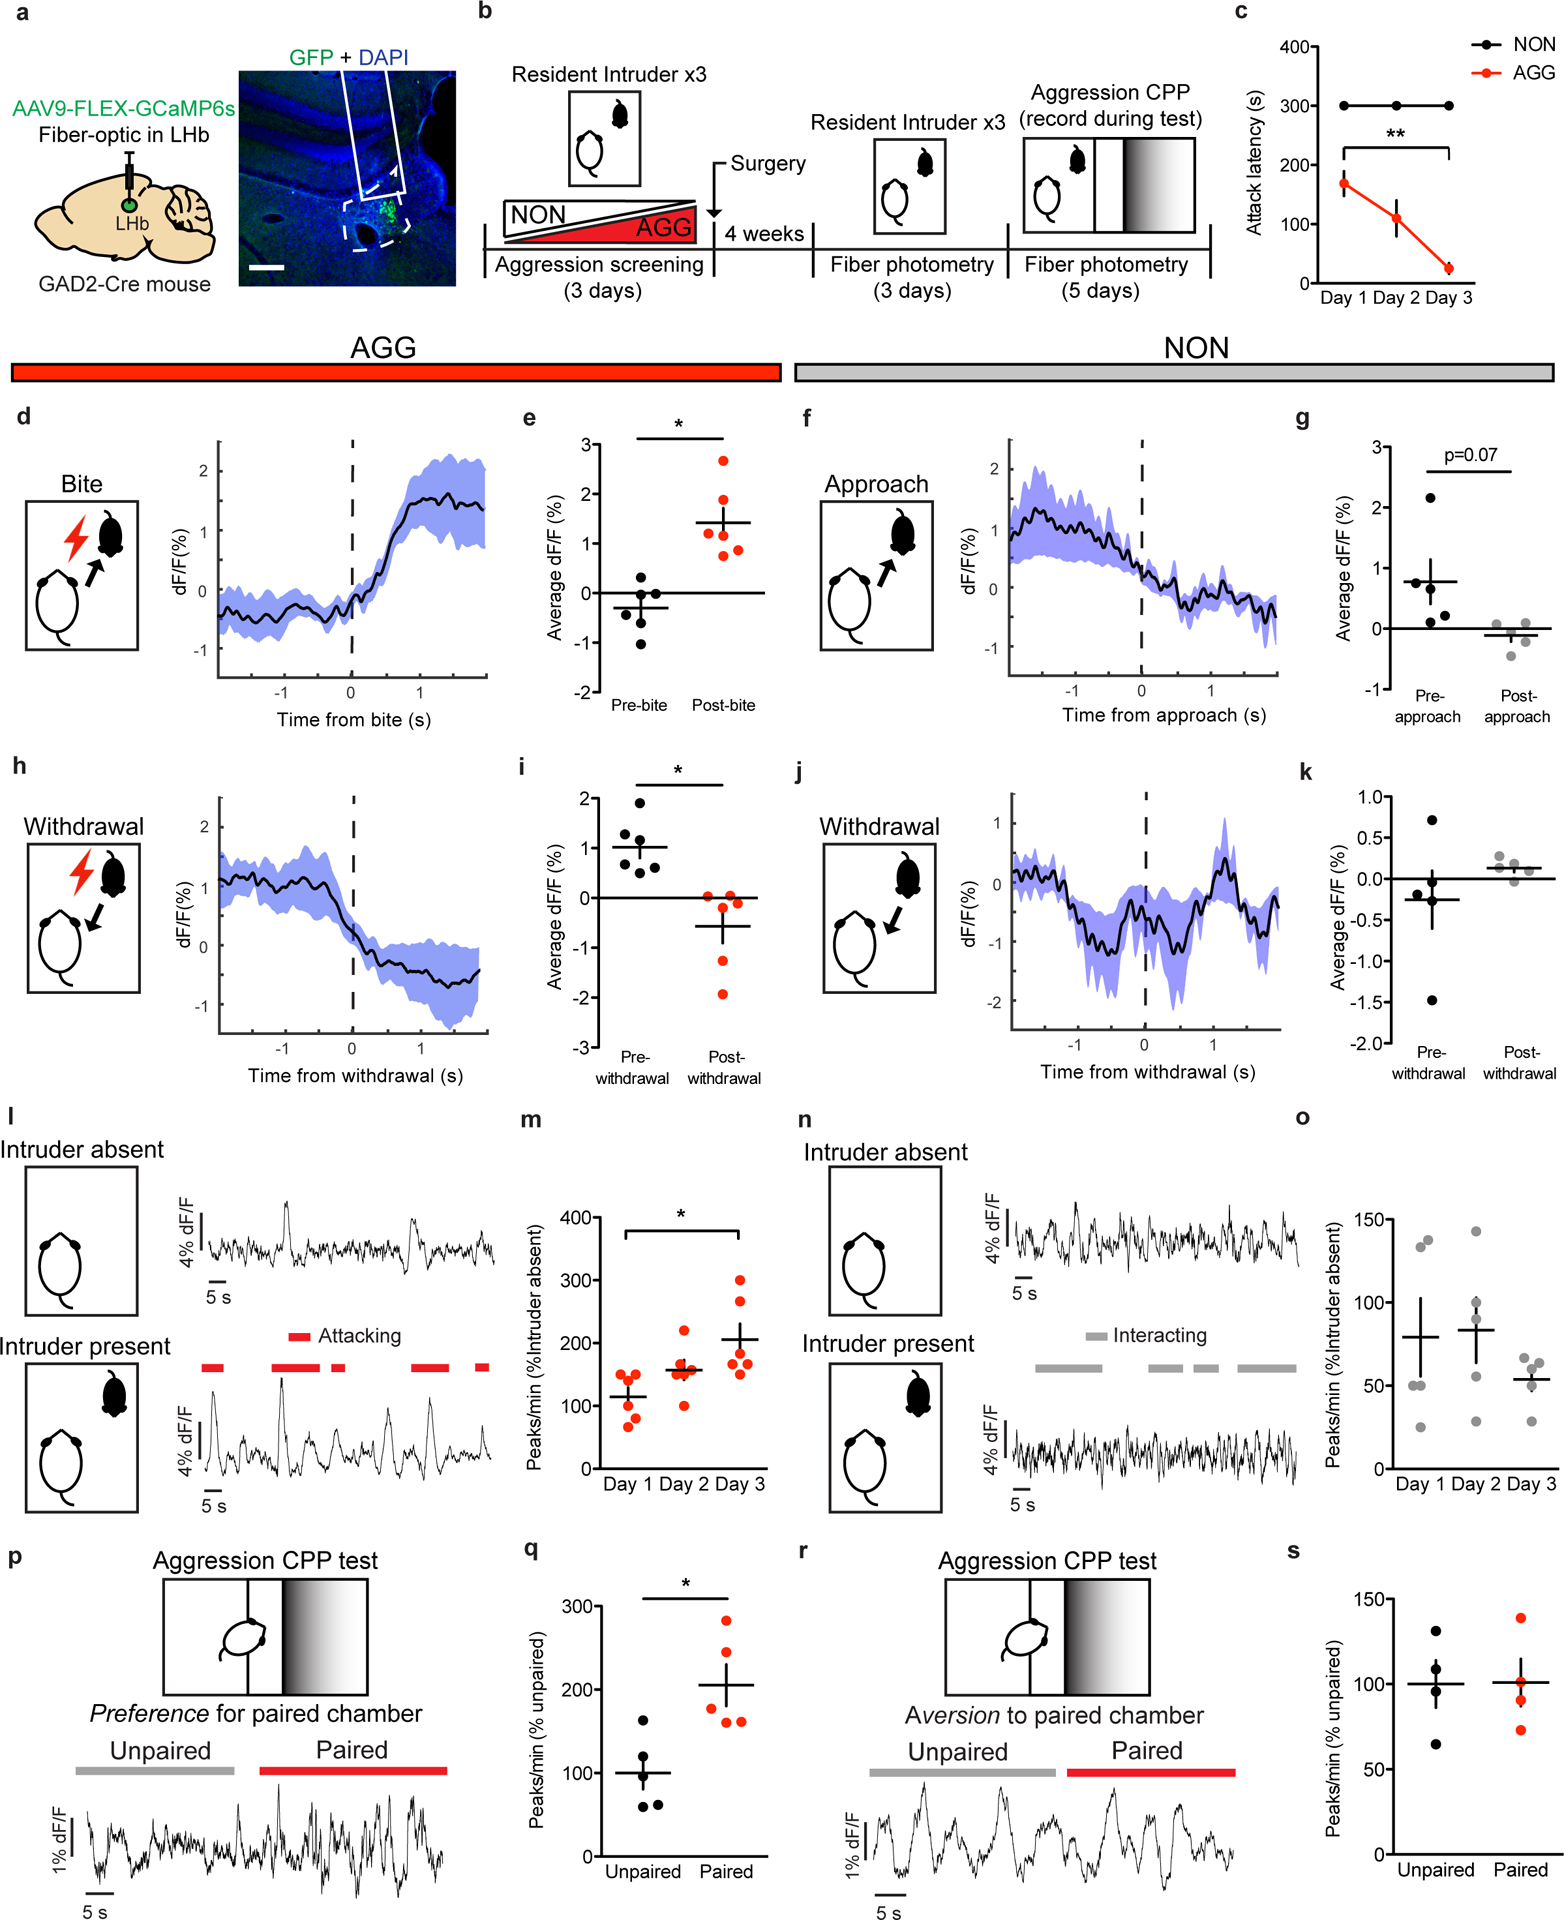
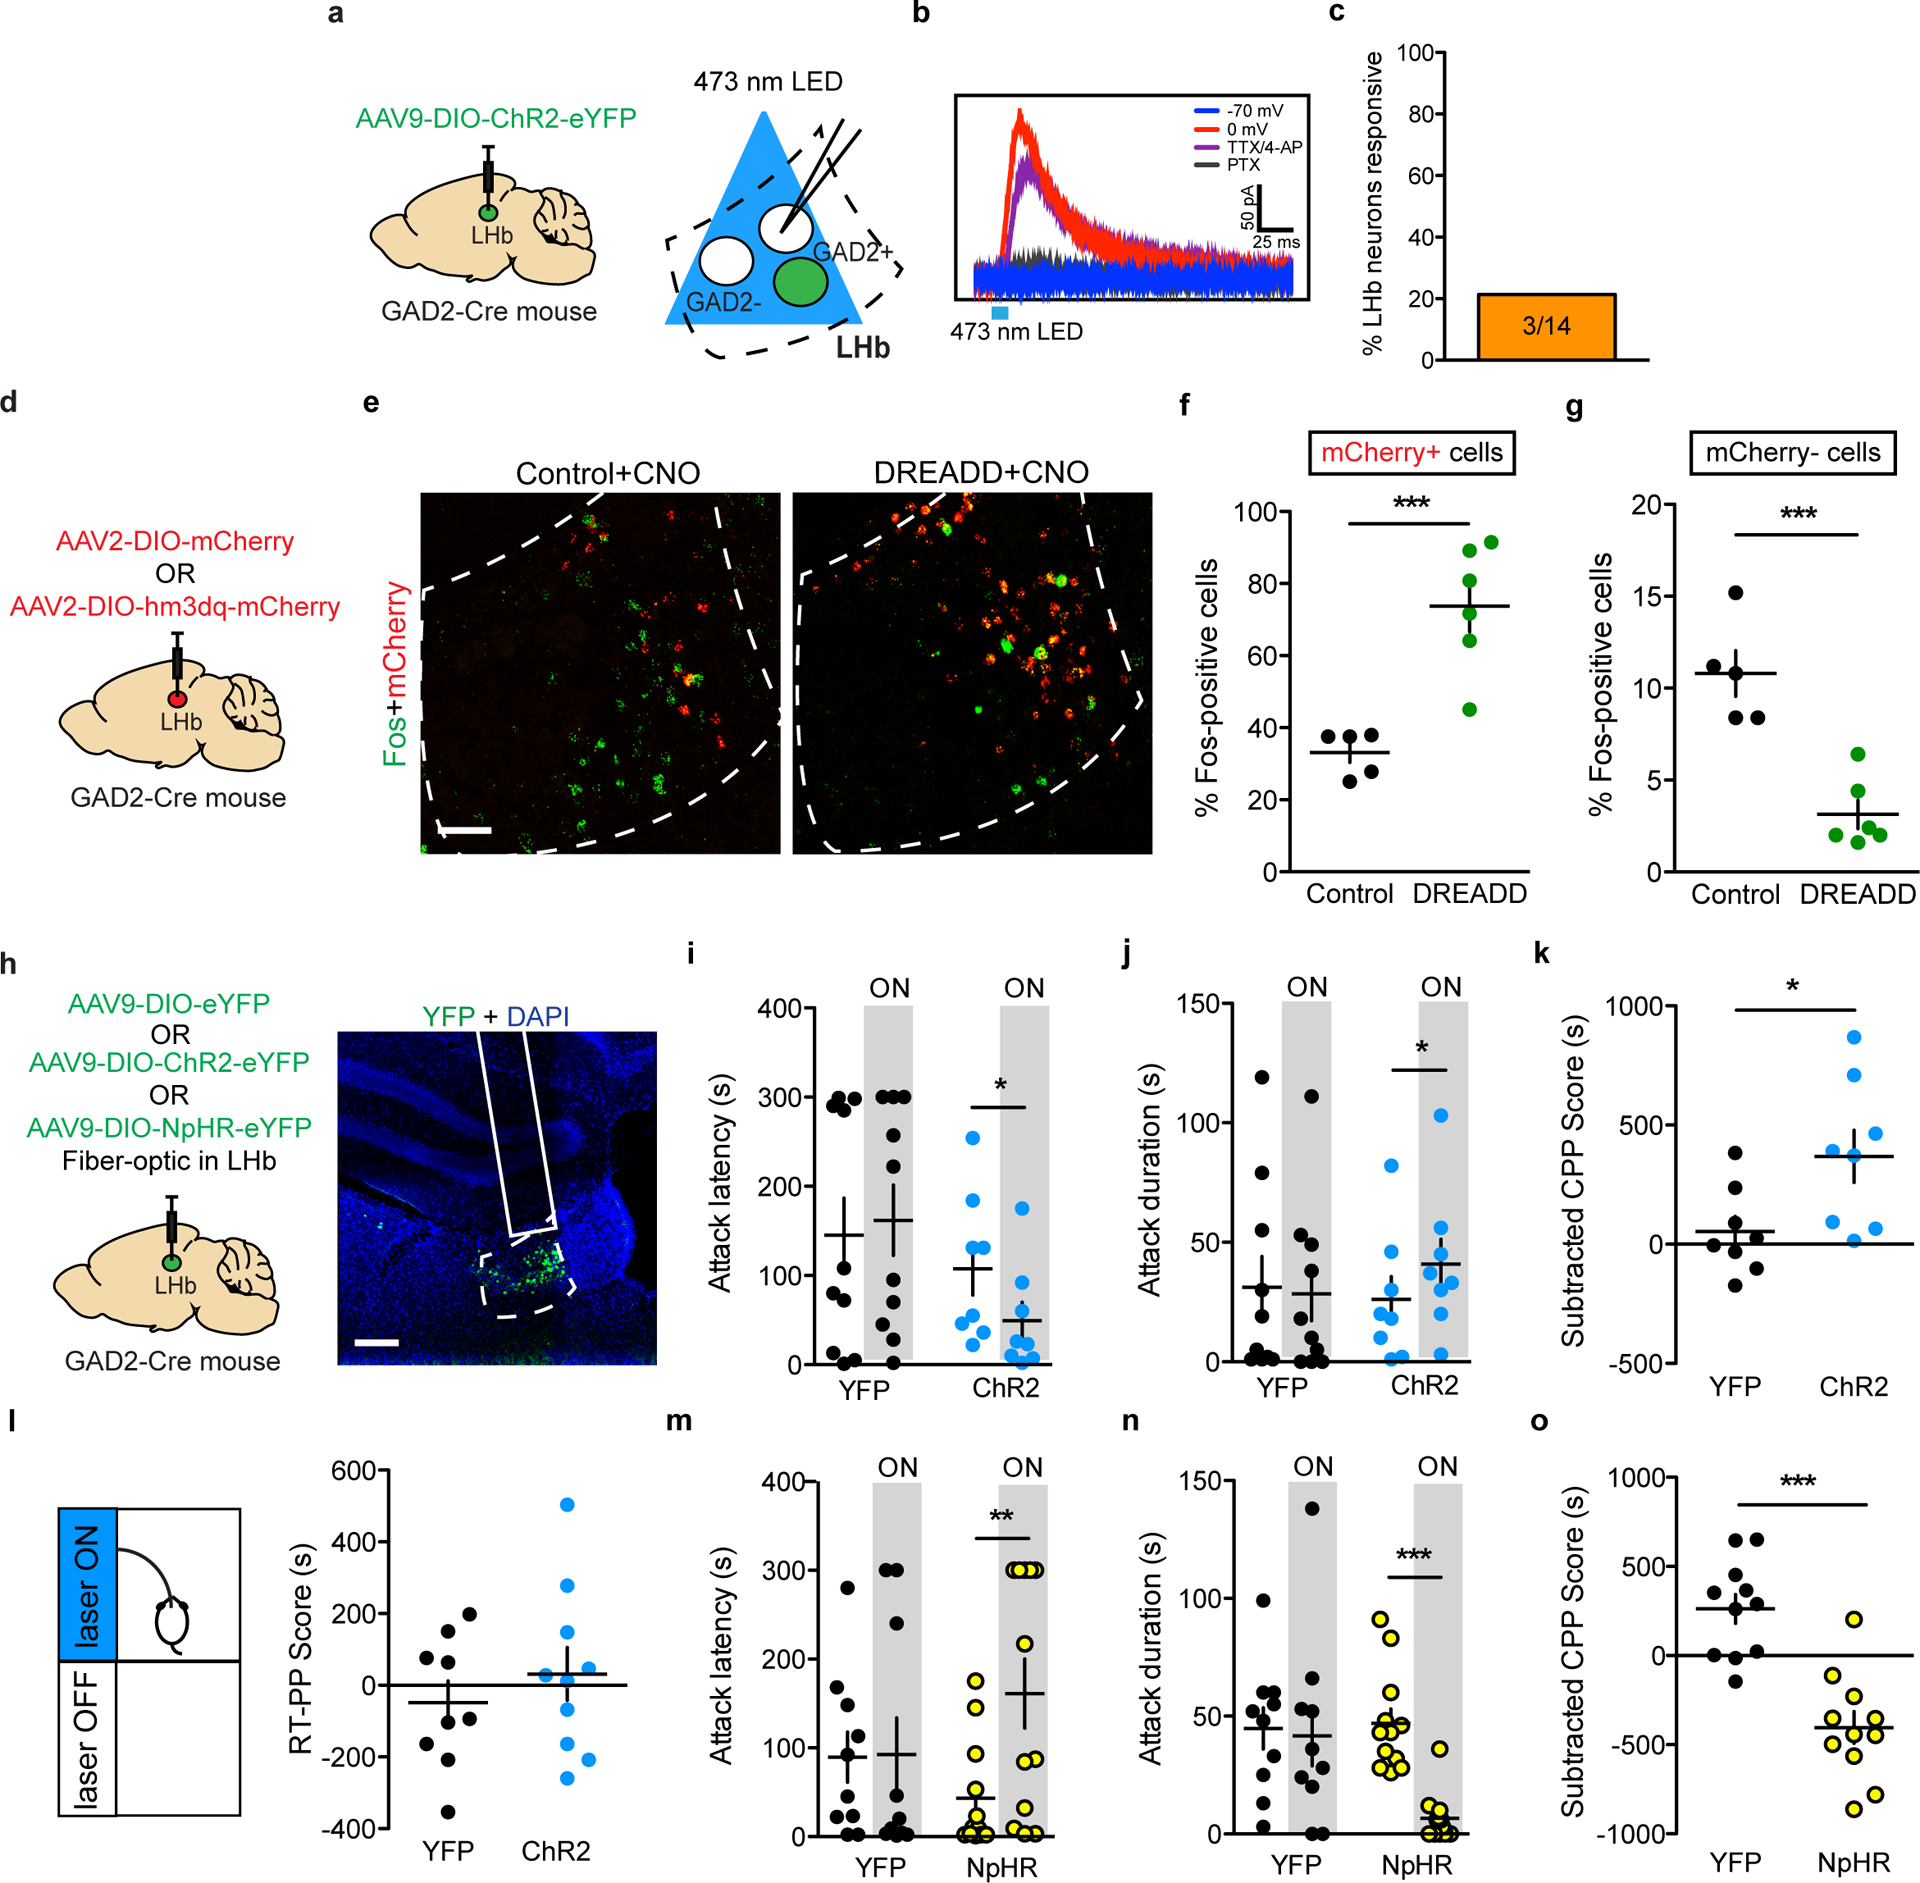
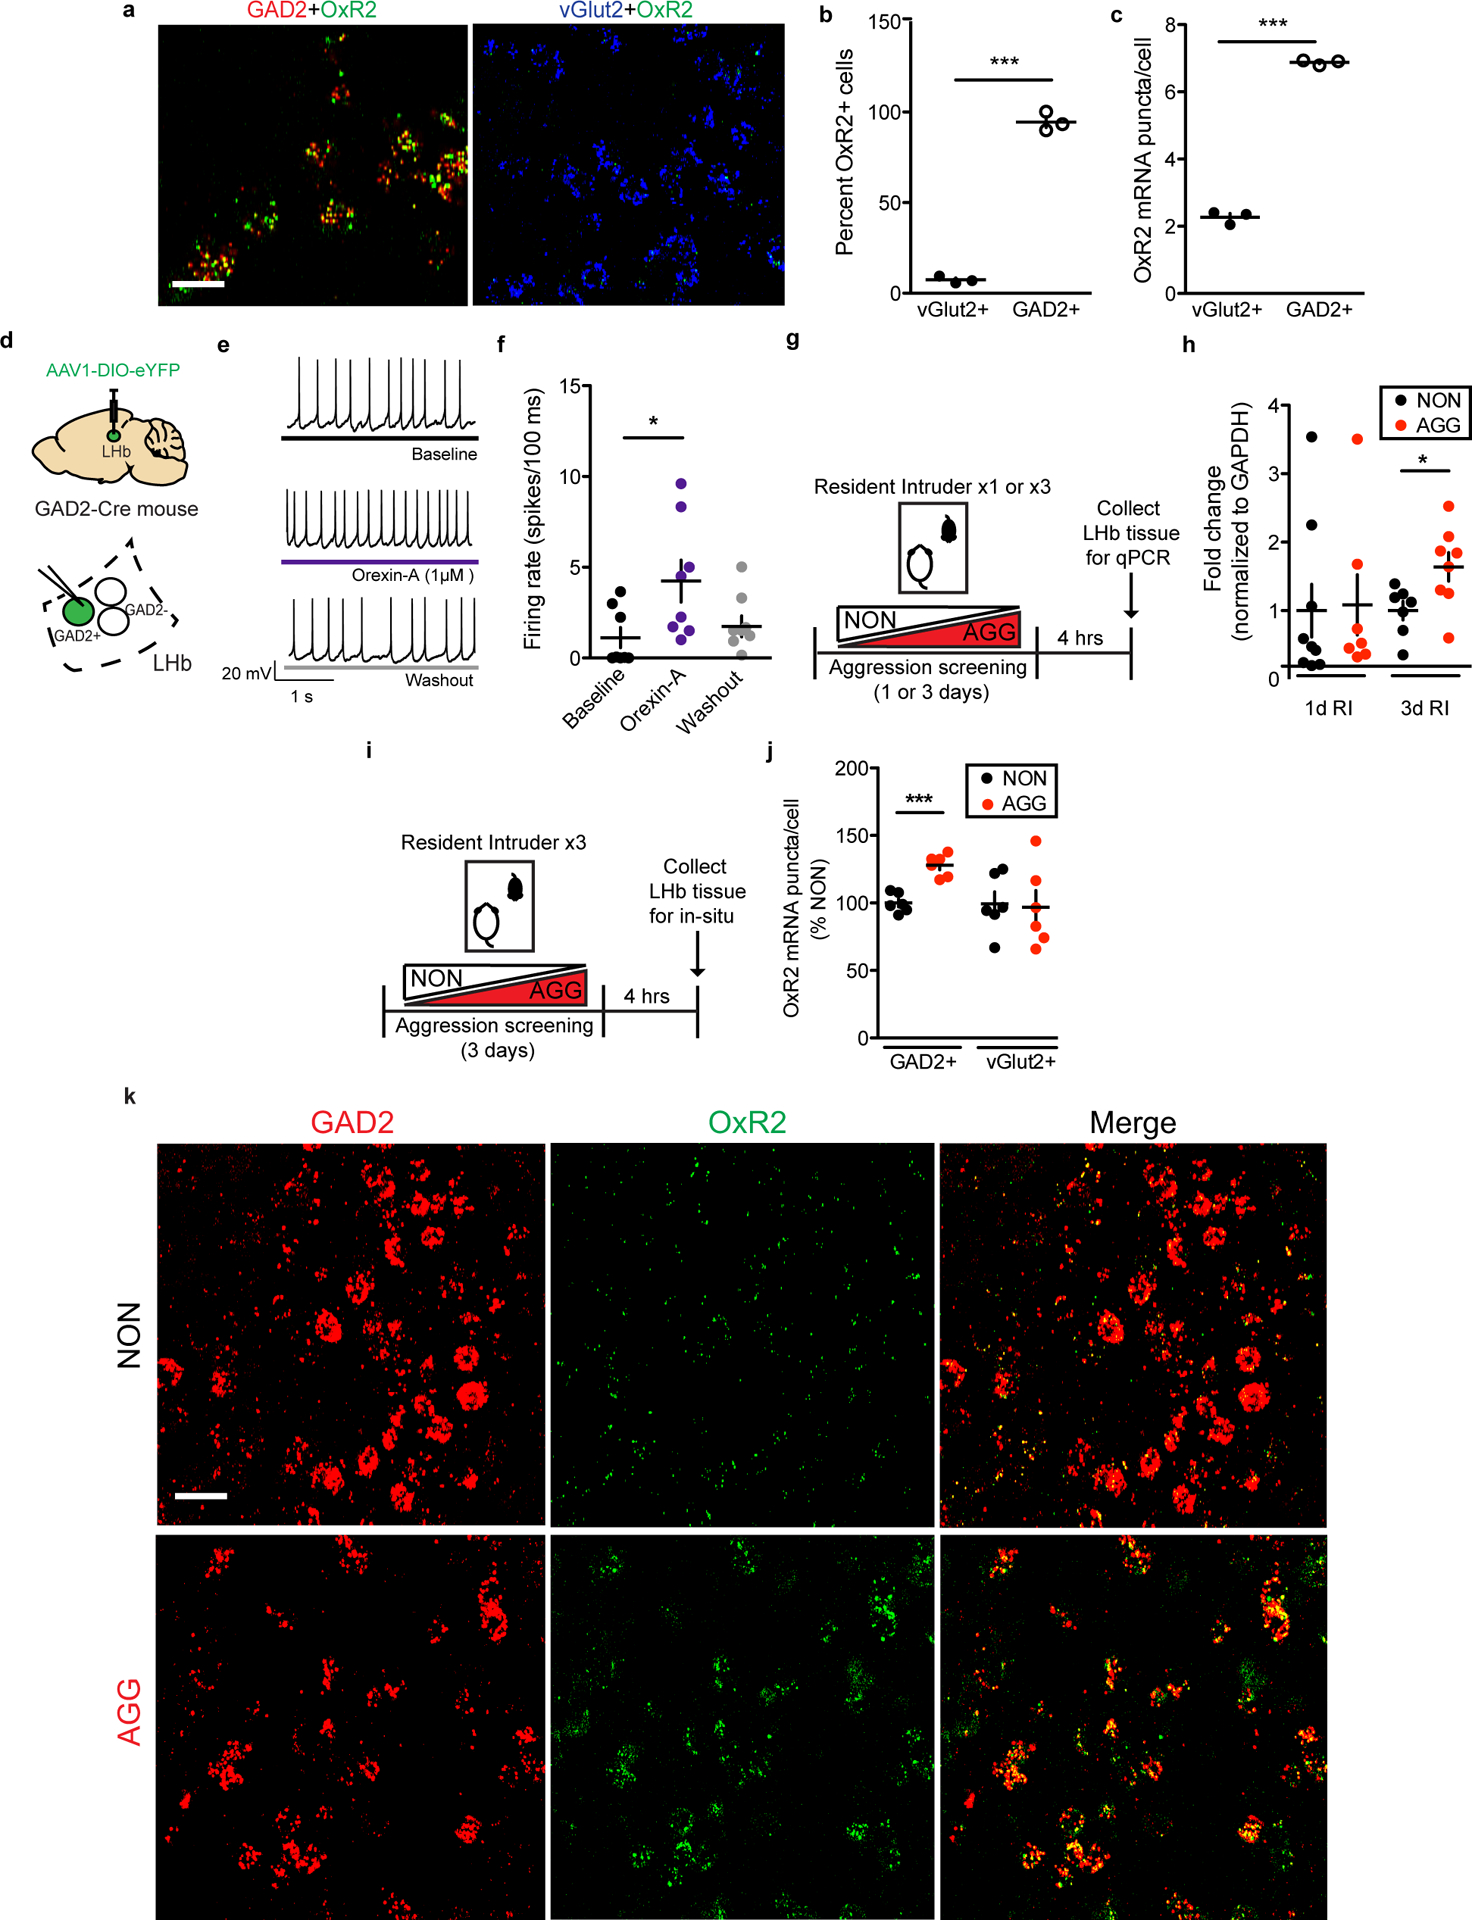
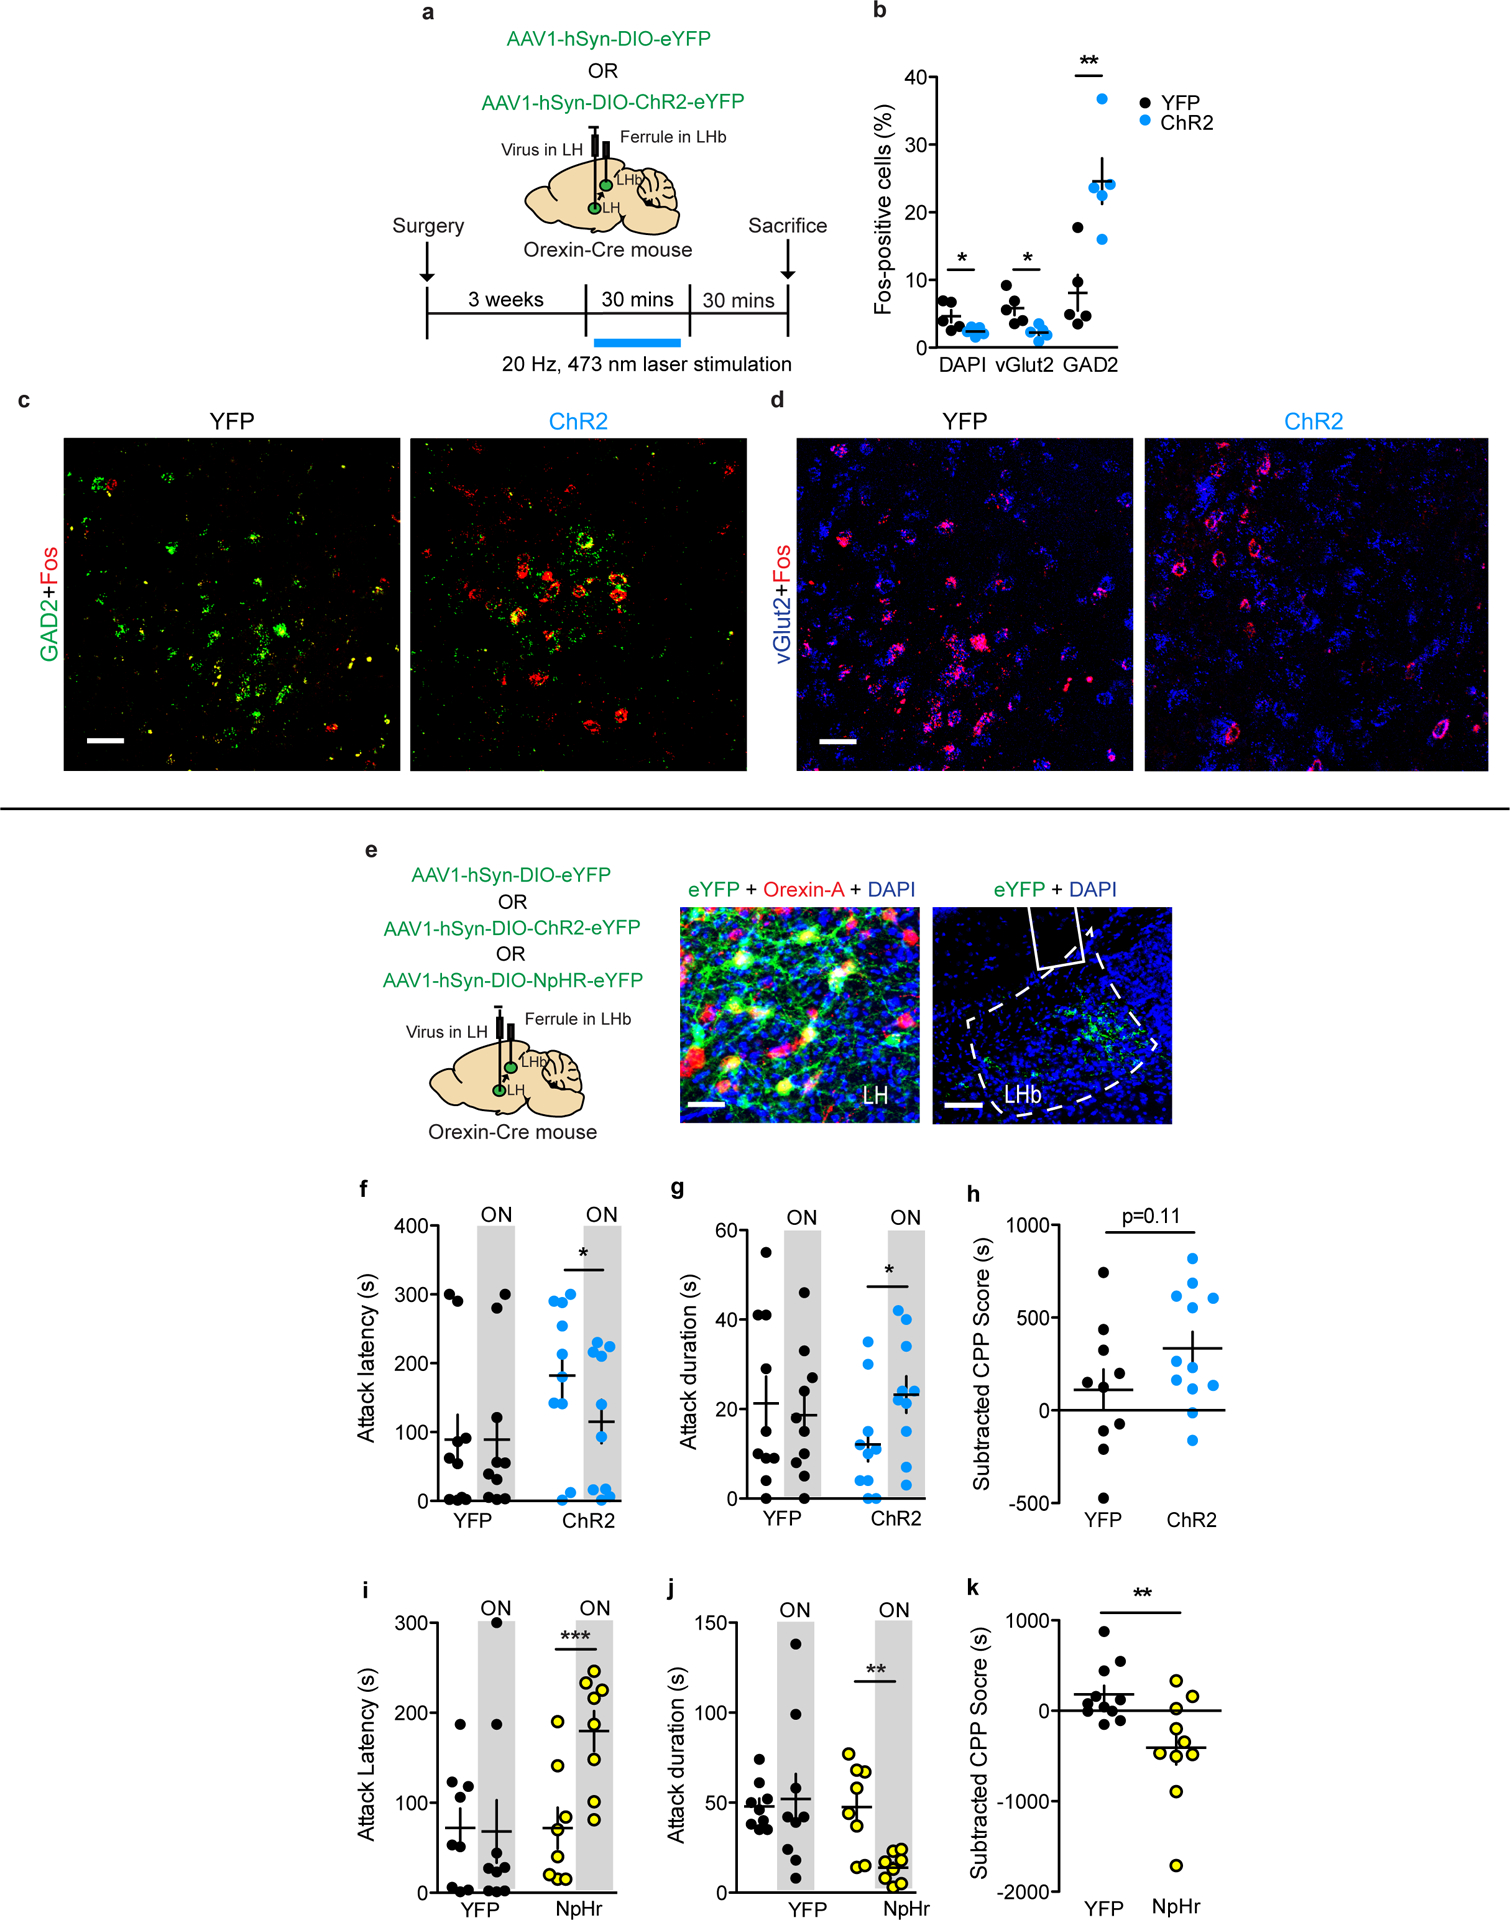
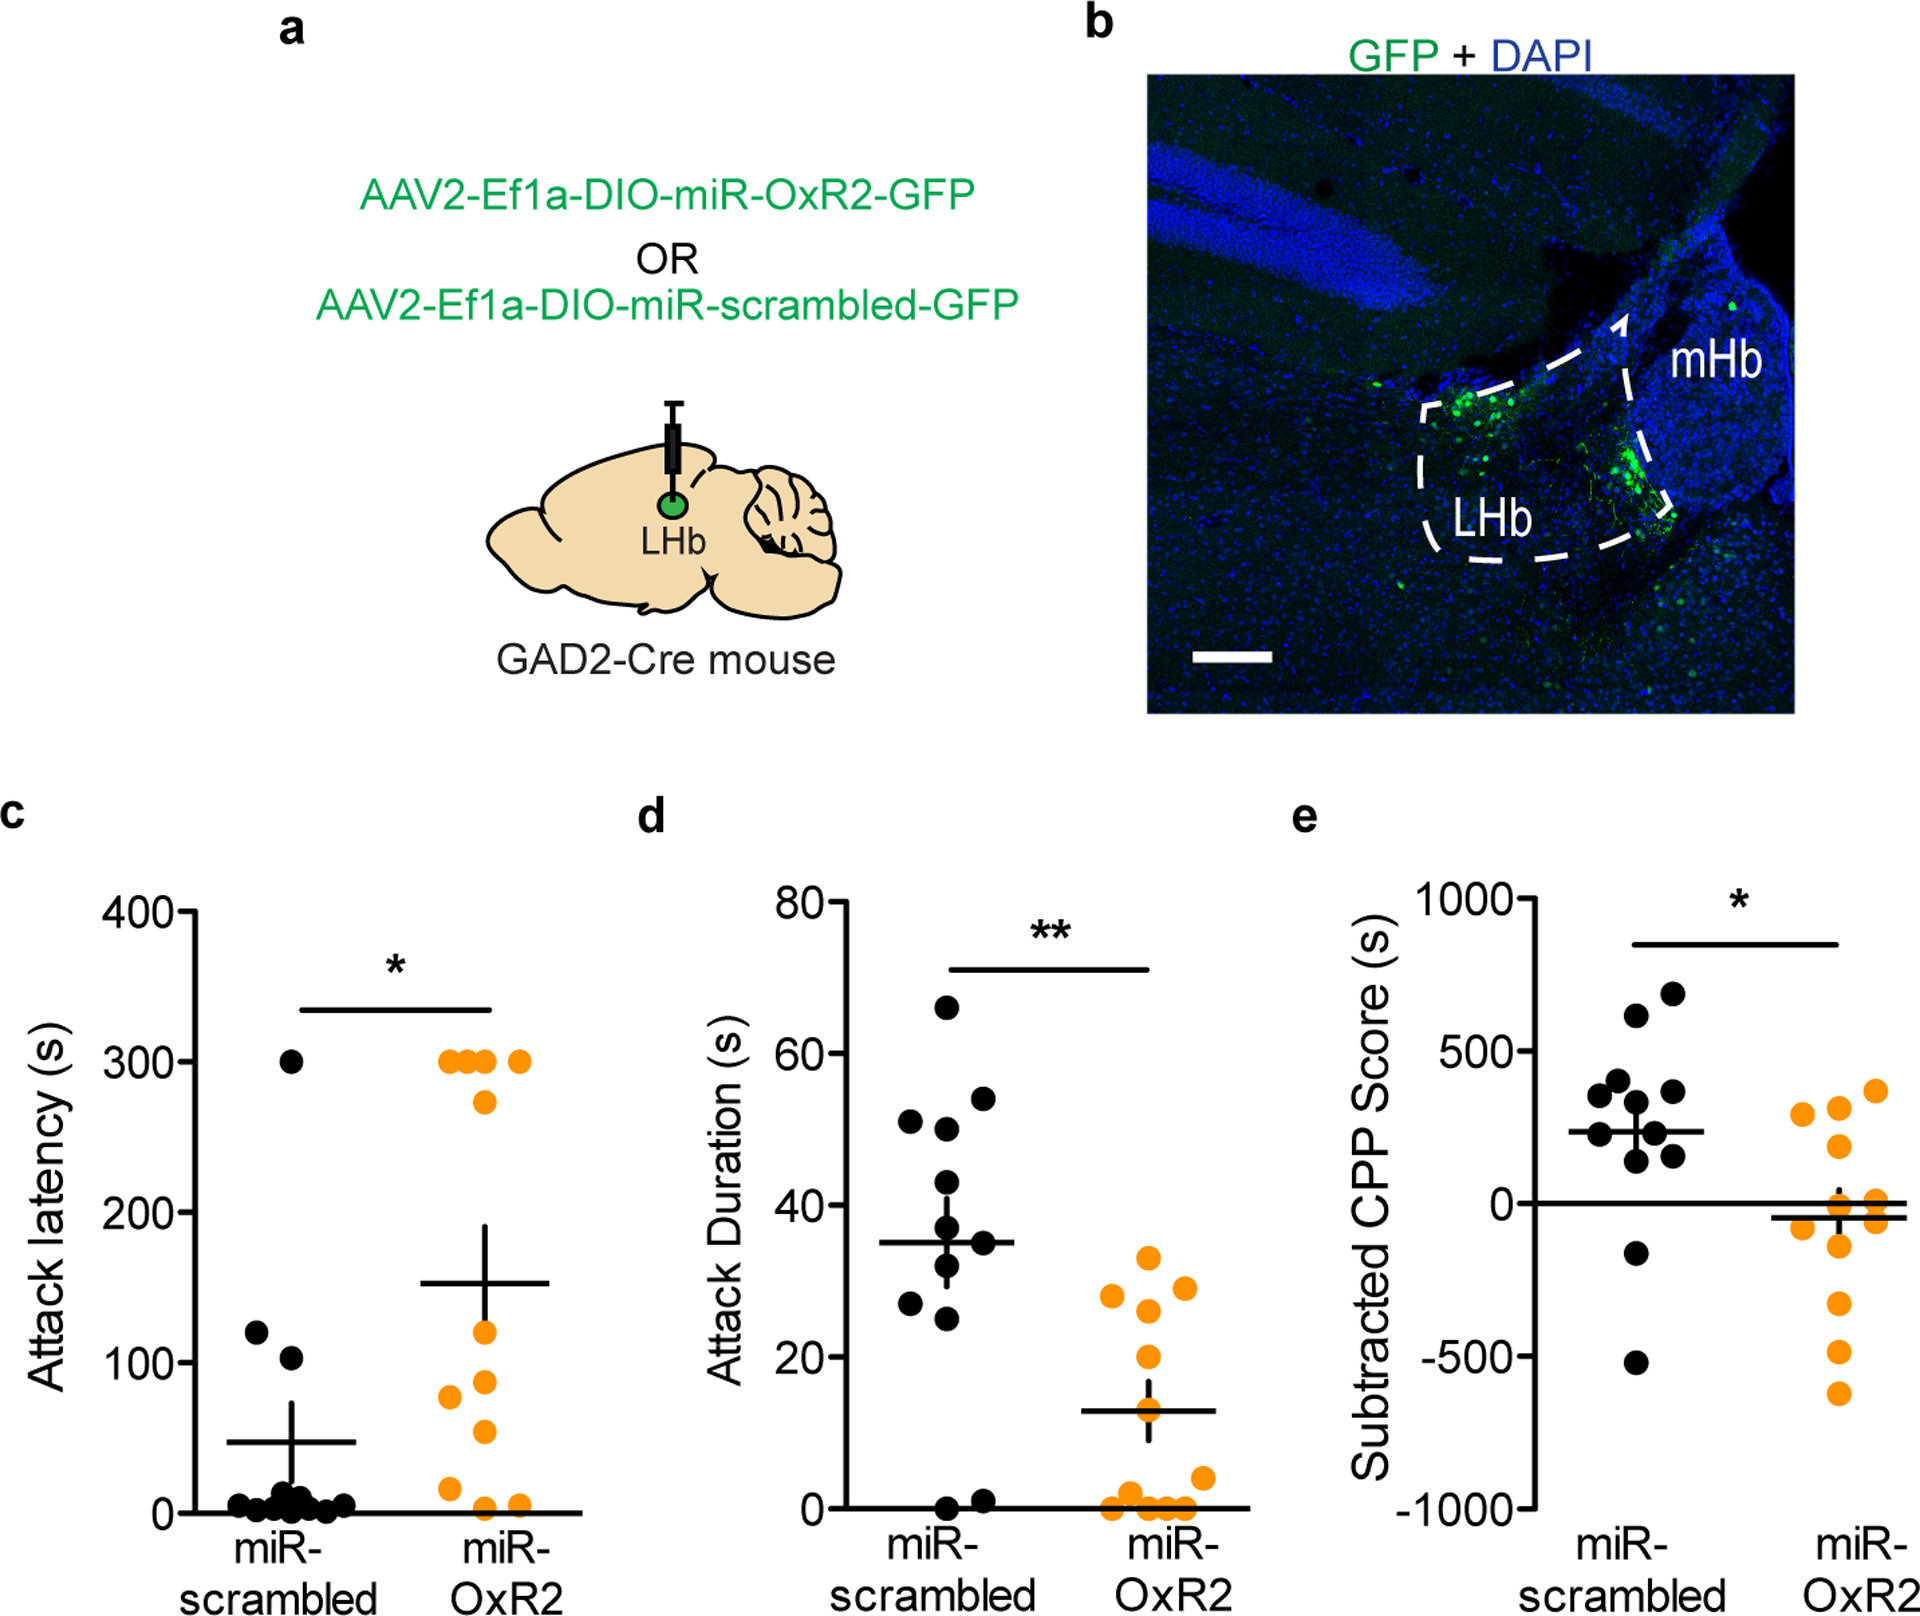
Heightened aggression is characteristic of multiple neuropsychiatric disorders and can have various negative effects on patients, their families and the public. Recent studies in humans and animals have implicated brain reward circuits in aggression and suggest that, in subsets of aggressive individuals, domination of subordinate social targets is reinforcing. In this study, we showed that, in male mice, orexin neurons in the lateral hypothalamus activated a small population of glutamic acid decarboxylase 2 (GAD2)-expressing neurons in the lateral habenula (LHb) via orexin receptor 2 (OxR2) and that activation of these GAD2 neurons promoted male-male aggression and conditioned place preference for aggression-paired contexts. Moreover, LHb GAD2 neurons were inhibitory within the LHb and dampened the activity of the LHb as a whole. These results suggest that the orexin system is important for the regulation of inter-male aggressive behavior and provide the first functional evidence of a local inhibitory circuit within the LHb.


Conflict of interest statement

Competing Interests Statement

S.J.R. and M.E.F. have a patent pending (US Patent Application 62/11,233) for the use of OxR2 antagonists to treat aggression.

Figures

Extended Data Fig. 1
Extended Data Fig. 1. LHb non-conditional fiber photometry supporting data.
a, AGG average LHb activity was reduced following a bite on day 1 of RI (two-tailed paired t-test, n=5 biologically independent mice, 3–5 bites per mouse, t(4)=3.763, p=0.0197). b, AGG average LHb activity was increased following a withdrawal from aggression on day 1 of RI (two-tained paired t-test, n=5 biologically mice, 3–5 withdrawals per mouse, t(4)=3.229, p = 0.03). c, AGG average LHb activity did not differ before and after random time points during RI on day 3 (two-tailed paired t-test, n=5 biologically independent mice, t(4)=0.6545, p = 0.5485). d, NON average LHb activity was not significantly increased following intruder approach on day 1 of RI (two-tailed paired t-test, n=5 biologically independent mice, 3–5 approaches per mouse, t(4)=2.25, p = 0.087). e, NON average LHb activity was not significantly reduced following withdrawal from social interactions on day 1 of RI (two-tailed paired t-test, n=5 biologically independent mice, 3–5 withdrawals per mouse, t(4)=2.353, p = 0.078). f, NON average LHb activity did not differ before and after random time points during RI on day 3 (two-tailed paired t-test, n=5 biologically independent mice, 5 time points per mouse, t(4)=0.553, p = 0.6221). g, AGGs used for fiber photometry experiments displayed significantly higher aggression CPP scores than NONs (two-tailed student’s t-test, n=4 biologically independent mice per group, t(6)=5.591, p = 0.0014). h, LHb peaks in the intruder paired context during the CPP preference test were negatively correlated with CPP score (two-tailed student’s t-test, n=8 biologically independent mice, Pearson correlation coefficient = −0.94, R2 = 0.88, p = 0.0005). *p<0.05, **p<0.01. All data are expressed as mean ± SEM.
Extended Data Fig. 2
Extended Data Fig. 2. LHB GAD2 neuron fiber phohometry supporting data.
a, AGG LHb GAD2 neuron activity was increased following bites on day 1 of RI (two-tailed paired t-test, n=5 biologically independent mice, 2–5 bites per mouse, t(4)=4.008, p=0.016). b, AGG LHb GAD2 neuron activity was reduced following a withdrawal from an aggressive encounter on day 1 of RI (two-tailed paired t-test, n=5 biologically independent mice, 3–5 withdrawals per mouse, t(4)=3.982, p=0.0164). c, AGG LHb GAD2 neuron activity did not differ before and after random times points on day 3 of RI (two-tailed paired t-test, n=5 biologically independent mice, 5 time points per mouse, t(4)=0.493, p=0.6475). d, NON LHb GAD2 neuron activity was not different before and after an approach on day 1 of RI (two-tailed paired t-test, n=5 biologically independent mice, 3–5 approaches per mouse, t(4)=1.843, p=0.1406). e, NON LHb GAD2 neuron activity was not different before and after a withdrawal from a non-aggressive social interaction on day 1 of RI (two-tailed paired t-test, n=5 biologically independent mice, 3–5 withdrawals per mouse, t(4)-1.633, p=0.1777). f, NON LHb GAD2 neuron activity did not differ before and after random time points on day 3 of RI (two-tailed paired t-test, n=5 biologically independent mice, t(4)=1.721, p=0.1634). g, GAD2-cre AGGs used for fiber photometry experiments displayed significantly higher aggression CPP scores than GAD2-cre NONs (two-tailed paired t-test, n=5 biologically independent mice, t(4)=2.885, p=0.0448). h, LHb GAD2 neurons peaks in the intruder paired context during the CPP preference test were positively correlated with CPP score (two-tailed student’s t-test,A n=10 biologically independent mice, Pearson correlation coefficient = 0.761m, R2=0.586, p=0.0161). *p<0.05, **p<0.01. *p<0.05. All data are expressed as mean ± SEM.
Extended Data Fig. 3
Extended Data Fig. 3. Anterograde tracing of LHB GAD2 neuron projections.
a, Schematic of surgical manipulations for anterograde tracing of GAD2 LHb neurons. b, Representative image of viral infection in GAD2 LHb neurons. Experimental images were obtained from 3 biologically independent mice, three slices per mouse, with similar results obtained. c, Representative image of the interpeduncular nucleus (IPN) and ventral tegmental area (VTA) in mice expressing eGFP in GAD2 LHb neurons. Experimental images were obtained from 3 biologically independent mice, three slices per mouse, with similar results obtained. d, Representative image of the rostromedial tegmental nucleus (RMTg) in mice expressing eGFP in GAD2 LHb neurons. Experimental images were obtained from 3 biologically independent mice, three slices per mouse, with similar results obtained. e, Representative image of the RMTg and anterior dorsal and median raphe nuclei (DRN and MRN) in mice expressing eGFP in GAD2 LHb neurons. Experimental images were obtained from 3 biologically independent mice, three slices per mouse, with similar results obtained. f, Schematic of surgical manipulations for non-conditional anterograde tracing of LHb neurons. g, Representative image of viral infection in LHb neurons. Experimental images were obtained from 3 biologically independent mice, three slices per mouse, with similar results obtained. h, Representative image of the interpeduncular nucleus (IPN) and ventral tegmental area (VTA) in mice expressing eGFP in LHb neurons. Experimental images were obtained from 3 biologically independent mice, three slices per mouse, with similar results obtained. i, Representative image of the rostromedial tegmental nucleus (RMTg) in mice expressing eGFP in LHb neurons. Experimental images were obtained from 3 biologically independent mice, three slices per mouse, with similar results obtained. j, Representative image of the RMTg and anterior dorsal and median raphe nuclei (DRN and MRN) in mice expressing eGFP in LHb neurons. Experimental images were obtained from 3 biologically independent mice, three slices per mouse, with similar results obtained. Scale bars= 500 μm.
Extended Data Fig. 4
Extended Data Fig. 4. RI behavior in NONs during optogenetic stimulation of OxR2 over-expression in LHb GAD2 neurons.
a, ChR2-mediated stimulation of GAD2 LHb neurons in NONs did not affect attack latency during RI (two-tailed paired t-test, n=7 biologically independent mice, t(6)=1.0, p=0.3559). b, ChR2-mediated stimulation of GAD2 LHb neurons in NONs did not affect attack duration during RI (two-tailed paired t-test, n=7 biologically independent mice, t(6)=1.0, p=0.3559). c, ChR2-mediated stimulation of orexin terminals in the LHb did not affect attack latency during RI (two-tailed paired t-test, n=6 biologically independent mice, t(5)=1.0, p=0.3632). d, ChR2-mediated stimulation of orexin terminals in the LHb did not affect attack duration during RI (two-tailed paired t-test, n=5 biologically independent mice, t(5)=1.0, p=0.3632). e, Over-expression of OxR2 in GAD2 LHb neurons in NONs did not affect attack latency during RI (two-tailed student’s t-test, n=8 biologically independent GFP mice and n=11 biologically independent OxR2-OE mice, t(17)=0.8338, p=0.4160). f, Over-expression of OxR2 in GAD2 LHb neurons in NONs did not affect attack duration during RI (two-tailed student’s t-test, n=8 biologically independent GFP mice and n=11 biologically independent OxR2-OE mice, t(17)=0.9951. All data are expressed as mean ± SEM.
Extended Data Fig. 5
Extended Data Fig. 5. Histology and 3D rendering of GAD2 LHb neurons and orexin axons.
a, Immunohistochemistry for orexin-A (red), DAPI (blue), and eGFP (green) in a GAD2-Cre mouse injected with AAV-DIO-eGFP, scale bar = 300 μm. Experimental images were taken from 3 biologically independent mice, 3 slices per mouse, with similar results obtained. b, Immunohistochemistry for orexin-A (red), DAPI (blue), and GFP (green) in a GAD2-Cre mouse injected with AAV-DIO-eGFP, scale bar = 10 μm. Experimental images were taken from 3 biologically independent mice, 3 slices per mouse, with similar results obtained. c, 3D rendering of image in b, color of GAD2 neuron coincides with estimated distance from orexin-A axon according to key in lower right corner, scale bar = 5 μm. Experimental images were taken from 3 biologically independent mice, 3 slices per mouse, with similar results obtained.
Extended Data Fig. 6
Extended Data Fig. 6. Attack latencies for AGGs and NONs used in qPCR and ISH experiments.
a, Attack latency for one day of RI in mice used for LHb qPCR, n=9 biologically independent NON mice, n=7 biologically independent AGG mice. b, Average attack latency for three days of RI in mice used for LHb qPCR, n=7 biologically independent NON mice, n=8 biologially independent AGG mice. c, Average attack latency for three days of RI in mice used for LHb OxR2 ISH, n=6 biologically independent NON mice, n=6 biologically independent AGG mice. d, Representative images from OxR2 ISH in AGG and NON LHb vGlut2 neurons following RI, accompanies Fig. 5j, scale bar = 20 μm. Notably, OxR2 expression was barely detectable in these neurons in AGGs or NONs, which is in line with our findings showing low OxR2 expression in vGlut2 neurons in Fig. 5b–c. Experimental images were taken from 12 biologically independent mice, 2 slices per mouse, with similar results obtained. All data are expressed as mean ± SEM.
Extended Data Fig. 7
Extended Data Fig. 7. Effects of systemic antagonism of OxR2 with EMPA on aggression and LHb activity.
a, Experimental scheme for OxR2 systemic antagonism RI experiment. b, RI test attack latency in animals treated with EMPA and vehicle (two-tailed paired t-test, n=11 biologically independent mice per group, t(10)=0.3215, p=0.758). c, RI test attack duration in animals treated with EMPA and vehicle (two-tailed paired t-test, n=11 biologically independent mice per group, t(10)=2.888, p=0.016).d, Experimental scheme for OxR2 systemic antagonism aggression CPP and locomotion experiments. e, Aggression CPP for animals treated with EMPA and vehicle (two-tailed student’s t-test, n=12 biologically independent vehicle mice and n=11 biologically independent EMPA mice, t(21)=2.885, p=0.0086). f, Locomotor activity in the open field for animals treated with EMPA and vehicle (two-tailed student’s t-test, n=12 biologically independent vehicle mice and n=11 biologically independent EMPA mice, t(21)=0.1301, p=0.8991). g, Anxiety-related behavior in the open field for animals treated with EMPA or vehicle (two-tailed student’s t-test, n=11 biologically independent mice per group, t(21)=1.134, p=0.2695) h, Representative fiber photometry traces in an animal treated with vehicle and EMPA. i, LHb GCaMP peaks during RI during vehicle and EMPA treatment (two-tailed paired t-test, n=5 biologically independent mice, t(4)=2.946, p=0.0421). *p<0.05, **p<0.01. All data are expressed as mean ± SEM.
Extended Data Fig. 8
Extended Data Fig. 8. LHb orexin-ChR2 experiments supporting data
a, >90% of neurons infected with AAV1-DIO-YFP were positive for orexin-A protein as determined by immunohistochemistry, n=3 biologically independent mice, 3 slices per mouse. b, Surgical manipulations for ChR2-mediated activation of orexin terminals in the LHb with concurrent knockdown of LHb OxR2. c, Optogenetic stimulation of orexin terminals in the LHb reduced attack latency in mice treated with the miR-scrambed virus, but not the miR-OxR2 virus (two-tailed paired t-test, miR-scrambled: n=11 biologially independent mice, t(10)=2.424, p=0.0358; miR-OxR2: n=9 biologically independent mice, t(8)=0.5281, p=0.6117). d, Optogenetic stimulation of orexin terminals in the LHb increased attack duration in mice treated with the miR-scrambled virus, but not the miR-OxR2 virus (two-tailed paired t-test, miR-scrambled: n=11 biologically independent mice, t(10)=2.260, p=0.0474; miR-OxR2: n=9 biologically independent mice, t(8)=0.8493, p=0.4204). *p<0.05. All data are expressed as mean ± SEM.
Extended Data Fig. 9
Extended Data Fig. 9. In-vitro and in-vivo validation of AAV-DIO-miR-OxR2 virus.
a, N2A cells treated with miR-OxR2 construct selectively reduced OxR2 expression compared to cells treated with miR-scrambled construct, but did not reduce expression of related transcripts (two-tailed student’s t-test, n=3 biologically independent plates per group, 3 replicates per plate; OxR2: t(4)=2.402, p=0.0482; OxR1: t(4)=0.2123, p=0.8423; Avpr2: t(4)=0.3686, p=0.7311; Htr3a: t(4)=1.309, p=0.2607; Drd4: t(4)=0.1925, p=0.8567; Nmur: t(4)=1.672, p=0.1699; Drd1: t(4)=0.9239, p=0.4078; Mchr1: t(4)=1.467, p=0.2163; Glpr1: t(4)=1.785, p=0.1488). b, GAD2-Cre mice injected with AAV-DIO-miR-OxR2 displayed reduced expression of OxR2 compared to mice injected with AAV-DIO-miR-scrambled as determined by ISH (two-tailed student’s t-test, n=3 mice, 2 slices per mouse, t(4)=18.44, p=0.0001). c, Representative image of GFP expression localized to GAD2 LHb neurons in GAD2-Cre mice injected with AAV-DIO-miR-OxR2, scale bar = 25 μm. Experimental images were obtained from 6 biologically independent mice, 2 slices per mouse, with similar results obtained. d, Representative images of OxR2 expression in GAD2 LHb neurons infected with AAV-DIO-miR-OxR2 or AAV-DIO-miR-scrambled, scale bar, 20 μm. *p<0.05, ***p<0.001. All data are expressed as mean ± SEM.
Extended Data Fig. 10
Extended Data Fig. 10. In-vitro and in-vivo validation of AAV-DIO-OxR2 over-expression virus.
a, N2A cells treated with OxR2 over-expression construct selectively increased OxR2 expression compared to controls (two-tailed student’s t-test, n=3 biologically independent plates per group, 3 replicates per plate, OxR2: t(4)=3.939, p=0.0171; OxR1: t(4)=0.1238, p=0.9075). b, GAD2-Cre mice injected with AAV-DIO-OxR2 displayed increased expression of OxR2 compared to mice injected with AAV-DIO-GFP as determined by ISH (two-tailed student’s t-test, n=3 biologically independent mice, 2 slices per mouse, t(4)=4.417, p=0.0069) (left). Representative image of GFP expression localized to GAD2 LHb neurons in GAD2-Cre mice injected with AAV-DIO-OxR2, scale bar = 25 μm (right). Experimental images were obtained from 7 biologically independent mice, 2 slices per mouse, with similar results obtained. c, Representative images of OxR2 expression in GAD2 LHb neurons infected with AAV-DIO-OxR2 or AAV-DIO-GFP, scale bar = 25 μm. *p<0.05, **p<0.01. Experimental images were taken from 7 biologically independent mice, 2 slices per mouse, with similar results obtained. All data are expressed as mean ± SEM.
Figure 1:
Figure 1:. Aggressive behaviors are associated with decreased LHb activity.
a, Surgical manipulations and representative viral infection for LHb photometry experiments, scale bar = 400 μm. b, Experimental timeline for LHb photometry experiments. c, AGGs displayed reduced attack latency on day 3 compared to day 1 of RI (one-way repeated measures ANOVA, n=5 AGGs, F(2,8)=74.832, main effect of day p=0.04832, Dunnett’s multiple comparisons test day 1 vs. day 3 adjusted p=0.0327). d, Peri-event plot of AGG LHb activity before and after a bite on day 3 of RI. For all peri-event plots, black line denotes the mean signals for all animals, while blue shaded region denotes the SEM, n=5 biologically independent mice, 3–5 bites per mouse. e, AGGs displayed a reduction in average LHb activity following a bite (two-tailed paired t-test, n=5 biologically independent mice, 3–5 bites per mouse, t(4)=4.593, p=0.0101). f, Peri-event plot of NON LHb activity before and after an intruder approach on day 3 of RI. Black line denotes the mean signals for all animals, while blue shaded region denotes the SEM, n=.5 biologically independent mice, 3–5 approaches per mouse. g, NONs displayed an increase in average LHb activity following an approach (two-tailed paired t-test, n=5 biologically independent mice, 3–5 approaches per mouse, t(4)=3.450, p=0.0261. h, Peri-event plot of AGG LHb activity before and after a withdrawal from an aggressive bout. Black line denotes mean signals for all animals while blue shaded region denotes the SEM, n=5 biologically independent mice, 3–5 withdrawals per mouse. i, AGGs displayed an increase in average LHb activity following a withdrawal (two-tailed paired t-test, n=5 biologically independent mice, 3–5 withdrawals per mouse, t(4)=3.911, p=0.0174. j, Peri-event plot of NON LHb activity before and after a withdrawal from a non-aggressive social interaction. Black line denotes mean signals for all animals while blue shaded region denotes the SEM, n=5 biologically independent mice, 3–5 withdrawals per mouse. k, NONs displayed a decrease in LHb activity after a withdrawal from a non-aggressive social interaction (two-tailed paired t-test, n=5 biologically independent mice, 3–5 withdrawals per mouse, t(4)=2.838, p=0.0470). l, Representative traces of AGG LHb activity in the absence and presence of an intruder mouse on day 3 of RI. m, AGGs displayed reduced LHb activity across three days of RI (one-way repeated measures ANOVA, n=5 biologically independent mice, F(2,8)=6.294, p=0.0228, Dunnett’s test for multiple comparisons, day 1 vs day 3 adjusted p=0.0228). n, Representative traces of NON LHb activity in the absence and presence of an intruder mouse on day 3 of RI. o, NONs displayed a trend towards increased LHb activity across 3 days of RI (one-way repeated measures ANOVA, n=5 mice, F(2,14)=3.985, p=0.0630). p, Representative trace of AGG LHb activity during the aggression CPP test. q, AGGs displayed reduced LHb activity in the paired context compared to the unpaired context during the aggression CPP test (two-tailed paired t-test, n=4 mice, t(3)=4.080, p=0.0266). r, Representative trace of NON LHb activity during the aggression CPP test. s, NONs displayed no differences in LHb activity in the paired context compared to the unpaired context during the aggression CPP test (paired t-test, n=4 mice, t(3)=2.352, p=0.1001). *p<0.05. All data are expressed as mean ± SEM.
Figure 2:
Figure 2:. Aggressive behaviors are associated with increased expression of Fos mRNA in GAD2 LHb neurons.
a, in-situ hybridization (ISH) for GAD2 in the LHb, left image scale bar=150 μm, right image scale bar=70 μm. Experimental images were taken from 3 biologically independent mice, 2 slices per mouse, with similar results obtained. b, Pie chart depicting percentage of LHb neuons that are positive for GAD2 or vGlut2 mRNA as determined by ISH, n=3 biologically independent mice. c, Experimental timeline for Fos in-situ hybridization (ISH) experiments. d, Average attack latency for NONs and AGGs over three days of RI screening, n=6 biologically independent mice. e, Fos-positive nuclei were lower in AGGs than in NONs for total and vGlut2-positive LHb neurons and higher in GAD2-positive LHb neurons (two-tailed student’s t-test, n=5 biologically independent NON mice, n=6 biologically independent AGG mice, 2 slices per mouse, total: t(9)=2.828, p=0.0198, vGlut2: t(9)=3.421, p=0.0176, GAD2: t(9)=2.686, p=0.025). f, Representative images of ISH in the LHb for Fos (red) and GAD2 (green) in NON and AGG mice following RI screening, scale bar=35 μm. Experimental images were obtained from 11 independent mice with two images taken per mouse, with similar results obtained. g, Representative images of ISH in the LHb for Fos (red) and vGlut2 (blue) in NON and AGG mice following RI screening, scale bars=35 μm. Experimental images were obtained from 11 independent mice with two images taken per mouse, with similar results obtained. *p<0.05. All data are expressed as mean ± SEM.
Figure 3:
Figure 3:. Aggressive behaviors are associated with increased GAD2 LHb neuron activity.
a, Surgical manipulations and representative viral infection for LHb GAD2 neuron photometry experiments, scale bar=400 μm. b, Experimental timeline for LHb GAD2 neuron photometry experiments. c, AGGs displayed reduced attack latency on day 3 of RI compared to day 1 of RI (one-way repeated measures ANOVA, n=5 biologically independent mice, F(2,10)=10.78, p=0.0032, main effect of day, Dunnett’s test for multiple comparisons, d1 vs d3 adjusted p=0.0018). d, Peri-event plot of AGG LHb GAD2 activity 2s before and after a bite on day 3 of RI. For all peri-event plots, black line denotes the mean signals for all animals, while blue shaded region denotes the SEM, n=5 biologically independent mice, 3–5 bites per mouse. e, AGGs displayed an increase in average GAD2 neuron activity following a bite (two-tailed paired t-test, n=5 biologically independent mice, 3–5 bites per mouse, t(5)=4.914, p=0.0044). f, Peri-event plot of NON LHb GAD2 neuron activity 2s before and after an intruder approach on day 3 of RI. Black line denotes mean signals for all animals, while blue shaded region denotes the SEM, n=5 biologically independent mice, 3–5 approaches per mouse. g, NONs displayed no change in average LHb activity following an approach (two-tailed paired t-test, n=5 mice, 3–5 approaches per mouse, t(4)=2.437, p=0.0714. h, Peri-event plot of AGG LHb GAD2 neuron activity 2s before and after a withdrawal from an aggressive bout. Black line denotes mean signals for all animals while blue shaded region denotes the SEM, n=6 biologically independent mice, 3–5 withdrawals per mouse. i, AGGs displayed a decrease in average LHb activity following a withdrawal (two-tailed paired t-test, n=6 mice, 3–5 withdrawals per mouse, t(5)=3.022, p=0.0294. j, Peri-event plot of NON LHb GAD2 neuron activity 2s before and after a withdrawal from a non-aggressive social interaction. Black line denotes mean signals for all animas while blue shaded region denotes the SEM, n=5 biologically independent mice, 3–5 withdrawals per mouse. k, NONs displayed no change in LHb GAD2 neuron activity after a withdrawal from a non-aggressive social interaction (two-tailed paired t-test, n=5 biologically independent mice, 3–5 withdrawals per mouse, t(4)=1.170, p=0.3068). l, Representative traces of AGG LHb GAD2 neuron activity in the absence and presence of an intruder mouse during day 3 of RI. m, AGGs displayed increased GAD2 LHb activity across three days of RI (one-way repeated measures ANOVA, n=6 biologically independent mice, F(2,10)=5.653, p=0.0228, Dunnett’s multiple comparisons test day 1 vs. day 3 adjusted p=0.0133) n, Representative traces of NON LHb GAD2 neuron activity in the absence and presence of an intruder mouse during day 3 of RI. o, NONs did not display changes in LHb GAD2 neuron activity across three days of RI (one-way repeated measures ANOVA, n=5 mice, F(2,14)=0.8904, p=0.4476). p, Representative trace of AGG LHb GAD2 neuron activity during the aggression CPP task. q, AGGs displayed increased LHb GAD2 neuron activity in the paired context compared to the unpaired context during the aggression CPP task (two-tailed paired t-test, t(4)=2.885, p=0.0448). r, Representative trace of NON LHb GAD2 neuron activity during the aggression CPP task. s, NONs did not display differences in LHb GAD2 neuron activity during the aggression CPP task (two-tailed paired t-test, t(3)=0.03591, p=0.9736). *p<0.05, **p<0.01. All data are expressed as mean ± SEM.
Figure 4:
Figure 4:. GAD2 LHb neurons are locally inhibitory and regulate aggressive behaviors in AGGs.
a, Surgical manipulations and experimental schematic for slice optogenetic stimulation of GAD2 LHb neurons. b, Representative trace of GFP-negative neuron in response to optogenetic stimulation of nearby GAD2 neurons when cells are held at 0 mV or −70 mV and in the presence of TTX or the GABA receptor antagonist picrotoxin. c, Percent LHb GFP-negative neurons responding to optogenetic stimulation of GAD2 neurons. d, Surgical manipulations for GAD2 DREADD experiments. e, Representative images of ISH for Fos (green) and mCherry (red) mRNA in control and DREADD mice following treatment with CNO, scale bar= 50μm. f, CNO treatment increased the percent of Fos-expressing mCherry-positive neurons in DREADD mice compared to controls (two-tailed student’s t-test, n=5 biologically independent mice per group, t(9)=4.905, p=0.0008). g, CNO treatment reduced the percent of Fos-expressing mCherry-negative neurons in DREADD mice compared to controls (two-tailed student’s t-test, n=5 biologically independent mice per group, t(9)=5.439, p=0.0004). h, Surgical manipulations and representative viral infection image for in-vivo GAD2 LHb neuron optogenetics experiments, scale bar= 300μm i, ChR2-mediated stimulation of GAD2 LHb neurons reduced attack latency in RI (two-taile paired t-test, n=8 biologically independent mice, t(7)=3.724, p=0.0136). j, ChR2-mediated stimulation of LHb neurons increased attack duration in RI (paired t-test, n=8 mice, t(7)=2.690, p=0.0311). k, ChR2-mediated stimulation of GAD2 LHb neurons increased aggression CPP (two-tailed student’s t-test, n=8 biologically independent mice per group, t(14)=2.482, p=0.0264). l, Stimulation of GAD2 LHb neurons did not induce a real-time place preference (two-tailed student’s t-test, n=9 biologically independent mice per group, t(17)=0.8271, p=0.4196). m, NpHr-mediated inhibition of GAD2 LHb neurons increased attack latency in RI (two-tailed paired t-test, n=12 biologically independent mice, t(11)=3.242, p=0.0078). n, NpHr-mediated inhibition of GAD2 LHb neurons reduced attack duration in RI (two-tailed paired t-test, n=12 mice, t(11)=5.504, p=0.002). o, NpHr-mediated inhibition of GAD2 LHb neurons reduced aggression CPP (two-tailed student’s t-test, n=11 mice per group, t(20)=5.517, p<0.0001). *p<0.05, **p<0.01, ***p<0.001. All data are expressed as mean ± SEM.
Figure 5:
Figure 5:. Characterization of an LHb orexin circuit.
a, Representative in-situ hybridization (ISH) images showing OxR2 expression in GAD2 and vGlut2 LHb neurons, scale bar=20 μm. b, OxR2 is expressed primarily in GAD2 neurons compared to vGlut2 neurons (two-tailed student’s t-test, n=3 biologically independent mice, 1–2 slices per mouse, t(4)=15.67, p<0.0001). c, GAD2 neurons express more OxR2 mRNA than vGlut2 neurons (two-tailed student’s t-test, n=3 biologically independent mice, 1–2 slices per mouse, t(4)=15.67, p<0.0001). d, Surgical manipulations and experimental schematic for orexin bath application experiments. e, Representative traces from a GFP-positive neuron (GAD2 neuron) during baseline (top), orexin-A (middle), and washout (bottom) conditions. f, Orexin bath application increased the firing rate of GFP-positive neurons (Kruskal-Wallis one-way ANOVA with repeated measures, n=6 biologically independent mice, n=9 cells, Kruskall-Wallis statistic=7.115, p=0.0285, Dunn’s multiple comparisons baseline vs. orexin-A, adjusted p=0.0456). g, Experimental timeline for LHb qPCR experiments. h, Following 3 days of RI, AGGs expressed significantly more LHb OxR2 mRNA than NONs (3 days RI: two-tailed student’s t-test, n=7 biologically independent NON mice, n=8 biologically independent AGG mice, t(13)=2.496, p=0.0268; 1 day RI: two-tailed student’s t-test, n=9 biologically independent NON mice, n=7 biologically independent AGG mice, t(14)=0.1433, p=0.881). i, Experimental timeline for OxR2 ISH experiments. j, Following 3 days of RI, AGGs displayed increased GAD2 neuron OxR2 mRNA compared to NONs (two-tailed student’s t-test, n=5 biologically independent NON mice, n=6 biologically independent AGG mice, GAD2 neurons: t(9)6.039, p=0.0002; vGlut2 neurons: t(9)=0.6735, p=0.5175). k, Representative images of ISH for OxR2, GAD2, in AGGs and NONs following 3 days of RI, scale bar=20 μm. Experimental images were obtained from 11 independent mice with two slices imaged per mouse, with similar results obtained. *p<0.05, ***p<0.001 All data are expressed as mean ± SEM.
Figure 6:
Figure 6:. Optogenetic manipulation of orexin inputs to the LHb modulates aggressive behavior in AGGs.
a, Surgical manipulations and experimental timeline for optogenetic stimulation of orexin terminals in the LHb followed by in-situ hybridization (ISH) for Fos, GAD2, and vGlut2. b, Optogenetic stimulation of orexin terminals in the LHb increased Fos in GAD2 neurons and decreased Fos in vGlut2 neurons and DAPI positive cells (two-tailed student’s t-test, n=5 biologically independent mice per group, 2 slices per mouse; GAD2: t(8)=3.854, p=0.0048; vGlut2: t(8)=3.236, p=0.0120; DAPI: t(8)=2.340, p=0.0475). c, Representative images of Fos expression in LHb GAD2 neurons from YFP and ChR2 mice, scale bar=40 μm. Experimental images were obtained from 10 mice, 2 slices per mouse, with similar results obtained. d, Representative images of Fos expression in LHb vGlut2 neurons from YFP and ChR2 mice, scale bar=40 μm. Experimental images were obtained from 10 mice, 2 slices per mouse, with similar results. e, Surgical manipulations and representative viral infection images for optogenetic manipulation of orexin terminals in the LHb, scale bar=150 μm. f, Optogenetic stimulation of orexin terminals reduced attack latency in RI (NpHr, two-tailed paired t-test, n=10 biologically independent mice, t(9)=2.354, p=0.043). g, Optogenetic stimulation of LHb orexin terminals increased attack duration in RI (NpHr, two-tailed paired t-test, n=10 biologically independent mice, t(9)=2.335, p=0.0444). h, Optogenetic stimulation of LHb orexin terminals did not significantly increase aggression CPP (two-tailed student’s t-test, n=10 biologically independent mice per group, t(18)=1.642, p=0.1140). i, Optogenetic inhibition of LHb orexin terminals increased attack latency in RI (NpHr, two-tailed paired t-test, n=8 biologically independent mice, t(7)=6.671, p=0.0003). j, Optogenetic inhibition of LHb orexin terminals reduced attack duration in RI (NpHr, two-tailed paired t-test, n=8 biologically independent mice, t(7)=4.252, p=0.0038). k, Optogenetic inhibition of LHb orexin terminals reduced aggression CPP (two-tailed student’s t-test, n=11 YFP, n=10 NpHr, t(19)=2.993, p-0.0085). * p<0.05, ** p<0.01, ***p<0.001. All data are expressed as mean ± SEM.
Figure 7:
Figure 7:. Knockdown of OxR2 in GAD2 LHb modulates aggressive behavior in AGGs.
a, Surgical manipulations for GAD2 neuron-specific knockdown of OxR2 in the LHb. b, Representative viral infection for GAD2 neuron-specific knockdown of OxR2 in the LHb, scale bar=300 μm. c, OxR2 knockdown in GAD2 LHb neurons increased attack latency in RI (two-tailed student’s t-test, n=12 biologically independent mice per group, t(22)=2.322, p=0.0299). d, OxR2 knockdown in GAD2 LHb neurons reduced attack duration in RI (two-tailed student’s t-test, n=12 biologically independent mice per group, t(22)=3.183, p=0.0043). e, OxR2 knockdown in GAD2 LHb neurons reduced aggression CPP (two-tailed student’s t-test, n=12 biologically independent mice per group, t(22)=2.155, p=0,0424). * p<0.05, **p<0.01. All data are expressed as mean ± SEM.

Comment in

References

    1. Hill AP, et al. Aggressive Behavior Problems in Children with Autism Spectrum Disorders: Prevalence and Correlates in a Large Clinical Sample. Research in autism spectrum disorders 8, 1121–1133 (2014). - PMC - PubMed
    1. Cha J, et al. Neural Correlates of Aggression in Medication-Naive Children with ADHD: Multivariate Analysis of Morphometry and Tractography. Neuropsychopharmacology 40, 1717–1725 (2015). - PMC - PubMed
    1. Anderson NE & Kiehl KA Psychopathy and aggression: when paralimbic dysfunction leads to violence. Curr Top Behav Neurosci 17, 369–393 (2014). - PMC - PubMed
    1. Miles SR, Menefee DS, Wanner J, Teten Tharp A & Kent TA The Relationship Between Emotion Dysregulation and Impulsive Aggression in Veterans With Posttraumatic Stress Disorder Symptoms. J Interpers Violence 31, 1795–1816 (2016). - PubMed
    1. May ME Aggression as positive reinforcement in people with intellectual disabilities. Research in developmental disabilities 32, 2214–2224 (2011). - PubMed

Publication types

LinkOut - more resources