. 2020 Apr;26(4):535-541.
doi: 10.1038/s41591-020-0790-y. Epub 2020 Mar 16.

Therapeutic base editing of human hematopoietic stem cells

Affiliations

Therapeutic base editing of human hematopoietic stem cells

Jing Zeng et al. Nat Med. 2020 Apr.

Abstract

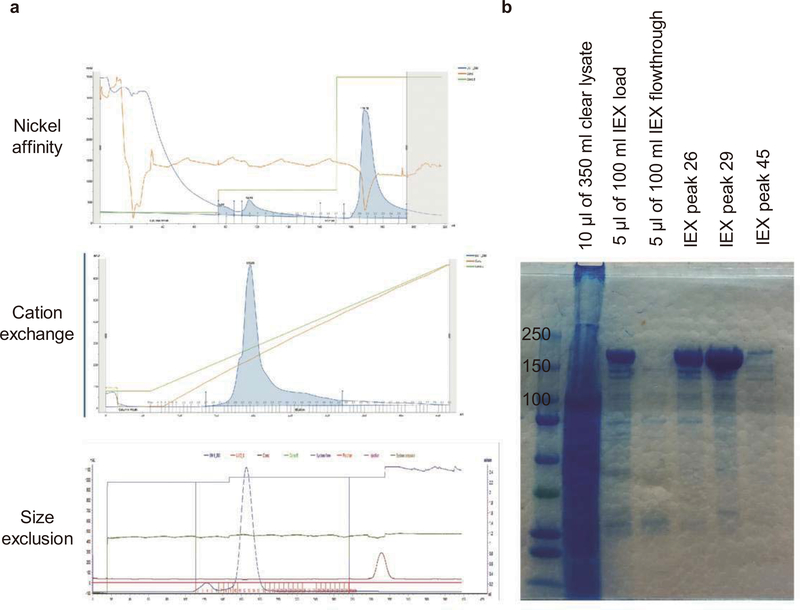
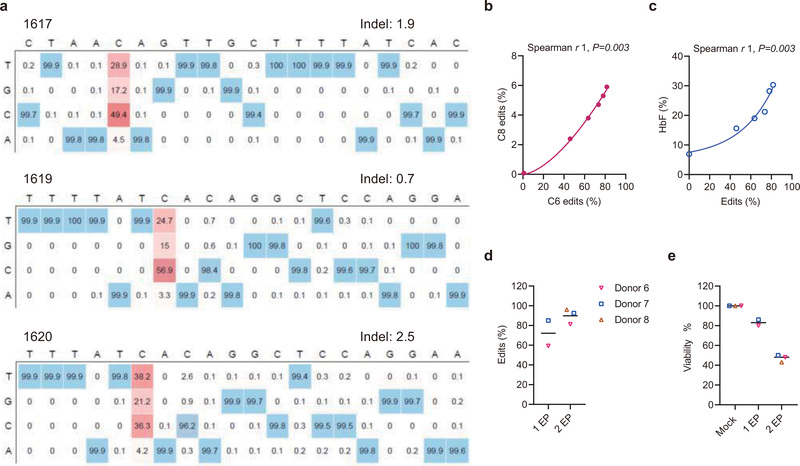
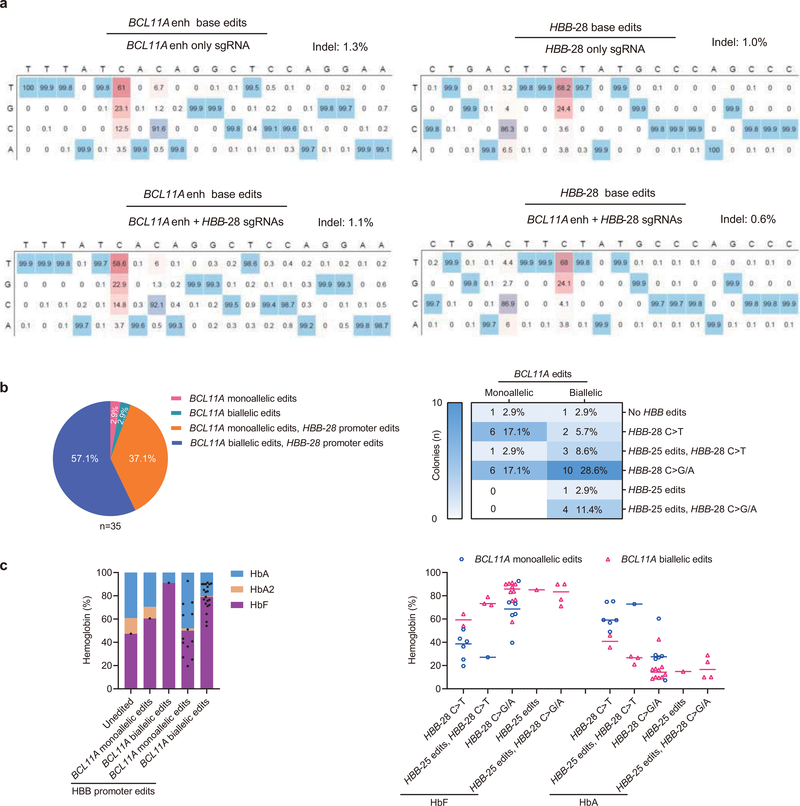
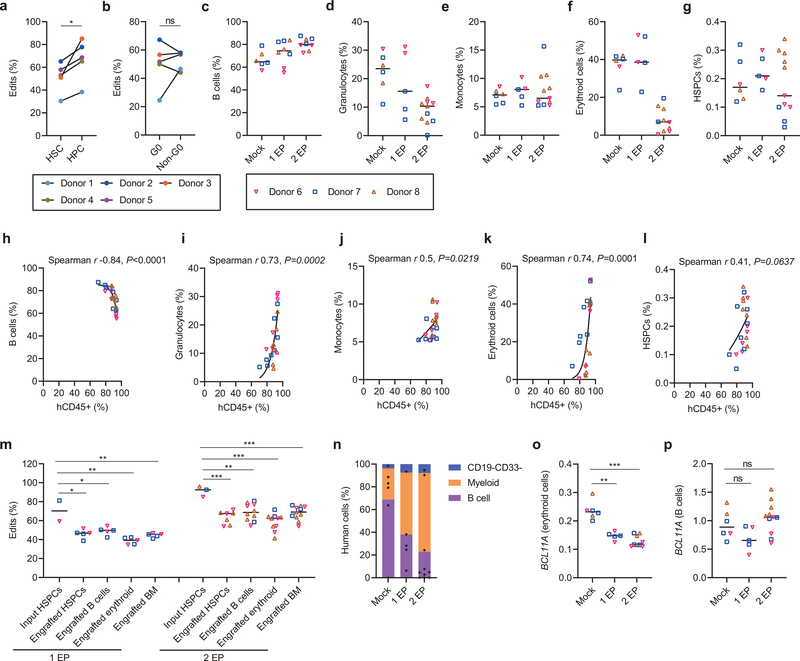
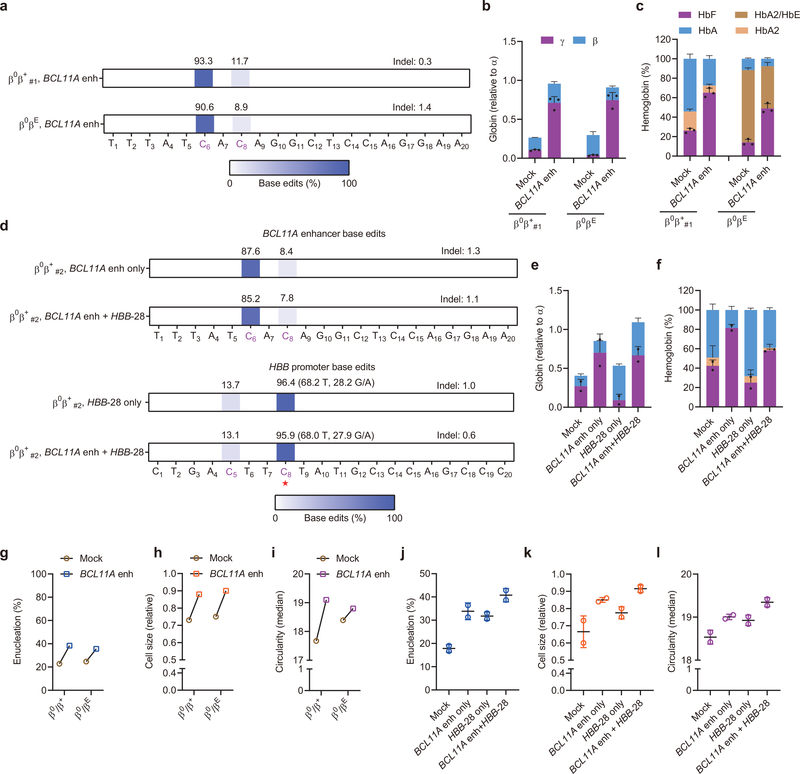
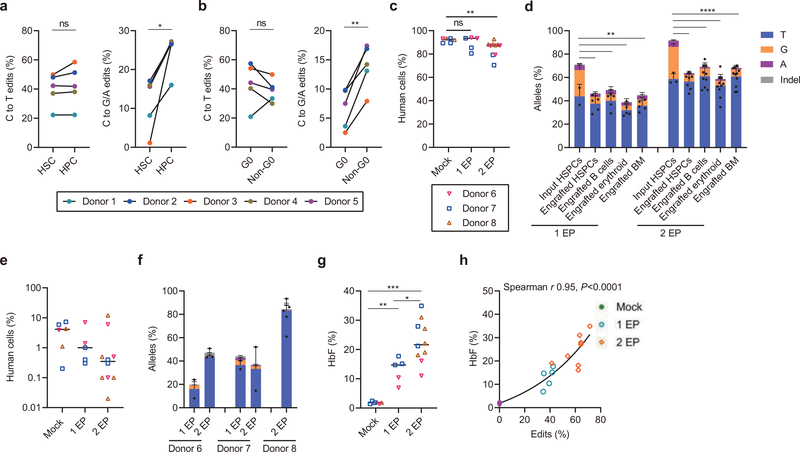
Base editing by nucleotide deaminases linked to programmable DNA-binding proteins represents a promising approach to permanently remedy blood disorders, although its application in engrafting hematopoietic stem cells (HSCs) remains unexplored. In this study, we purified A3A (N57Q)-BE3 base editor for ribonucleoprotein (RNP) electroporation of human-peripheral-blood-mobilized CD34+ hematopoietic stem and progenitor cells (HSPCs). We observed frequent on-target cytosine base edits at the BCL11A erythroid enhancer at +58 with few indels. Fetal hemoglobin (HbF) induction in erythroid progeny after base editing or nuclease editing was similar. A single therapeutic base edit of the BCL11A enhancer prevented sickling and ameliorated globin chain imbalance in erythroid progeny from sickle cell disease and β-thalassemia patient-derived HSPCs, respectively. Moreover, efficient multiplex editing could be achieved with combined disruption of the BCL11A erythroid enhancer and correction of the HBB -28A>G promoter mutation. Finally, base edits could be produced in multilineage-repopulating self-renewing human HSCs with high frequency as assayed in primary and secondary recipient animals resulting in potent HbF induction in vivo. Together, these results demonstrate the potential of RNP base editing of human HSPCs as a feasible alternative to nuclease editing for HSC-targeted therapeutic genome modification.


Conflict of interest statement

Competing Interests Statement

The authors declare competing financial interests: details are available in the online version of the paper. J.K.J. has financial interests in Beam Therapeutics, Editas Medicine, Excelsior Genomics, Pairwise Plants, Poseida Therapeutics, Transposagen Biopharmaceuticals, and Verve Therapeutics (f/k/a Endcadia). JKJ’s interests were reviewed and are managed by Massachusetts General Hospital and Partners HealthCare in accordance with their conflict of interest policies. J.K.J. is a member of the Board of Directors of the American Society of Gene and Cell Therapy. J.M.G. and J.K.J. are co-inventors on a patent application describing the A3A (N57Q) BE3 variant used in this study. J.K.J. is also a co-inventor on various patents and patent applications that describe gene editing, base editing, and epigenetic editing technologies. J.Z., Y.W., and D.E.B. are co-inventors on various patents related to therapeutic gene editing technologies.

Figures

Extended Data Figure 1 |
Extended Data Figure 1 |. Purification of A3A (N57Q)-BE3 protein.
a, Purification strategy and profiles. A3A (N57Q)-BE3 protein was purified using nickel affinity, mono S cation exchange, and size exclusion columns. Desired fractions from 100% imidazole elution (nickel column tube 20–24), salt gradient elution (tube 25–35), and size exclusion (tube 11–15) were collected respectively. b, Protein purity validation. Protein purity was determined using SDS-PAGE and gel staining. Total clear protein lysate and ion exchange (IEX) samples and fractions were loaded on SDS-PAGE gel and stained with GelCode Blue to check the purity. After immobilized metal affinity chromatography and IEX, the protein purity was estimated to be more than 99%. The protein purification was performed once.
Extended Data Fig. 2 |
Extended Data Fig. 2 |. Base editing the +58 BCL11A erythroid enhancer in human healthy donor CD34+ HSPCs.
a, Heatmaps show the base edit frequencies following A3A (N57Q)-BE3:sgRNA-1617, sgRNA-1619 and sgRNA-1620 editing by deep sequence analysis. b, Correlation of C6 and C8 base edit frequencies following dose-response A3A (N57Q)-BE3:sgRNA-1620 editing. Data are analyzed using two-tailed nonparametric Spearman correlation. The Spearman correlation coefficient (r) is shown, P=0.003, n=3 independent donors. c, Correlation of base edit frequencies and HbF levels following dose-response A3A (N57Q)-BE3:sgRNA-1620 editing. Data are analyzed using two-tailed nonparametric Spearman correlation. The Spearman correlation coefficient (r) is shown, P=0.003, n=3 independent donors. d, Overall base editing frequencies at sgRNA-1620 C6 position in input CD34+ HSPCs following 1 cycle of electroporation (1 EP) and 2 cycles of electroporation (2 EP) by performing the second cycle of electroporation 24 h after first. Data are plotted as grand median, n=2 healthy donors for 1 EP, n=3 healthy donors for 2 EP. e, Viability of CD34+ HSPCs immediately prior to transplantation with 1 or 2 cycles of electroporation (EP) relative to mock. Each dot indicates an independent healthy donor. Data are plotted as grand median, n=3 for mock, n=2 healthy donors for 1 EP, n=3 healthy donors for 2 EP.
Extended Data Fig. 3 |
Extended Data Fig. 3 |. Therapeutic and multiplex base editing in β-thalassemia patient CD34+ HSPCs.
a, Heatmaps show the base edit frequencies of BCL11A enhancer (left two panels) and HBB promoter (right two panels) following single and multiplex editing. b, Left, Distribution of erythroid colonies by editing of BCL11A enhancer and HBB promoter following A3A (N57Q)-BE3:sgRNA-1620 + sgRNA-HBB-28 multiplex base editing. Right, The number and fraction of colonies based on alleles at BCL11A enhancer and HBB promoter. c, Hemoglobin measured by HPLC for A3A (N57Q)-BE3:sgRNA-1620 + sgRNA-HBB-28 multiplex base editing by number of edited loci (left) or by combination of alleles (right) in edited erythroid colonies.
Extended Data Fig. 4 |
Extended Data Fig. 4 |. Efficient base editing following HSPC xenotransplantation.
a, Overall frequencies of C base edits at sgRNA-1620 C6 position in sorted immunophenotypically enriched HSC or HPC populations by deep sequence analysis. n=5 independent donors and analyzed using paired two-tailed Student’s t-test, * P=0.03 compared with HPC. b, Overall frequencies of C base edits at sgRNA-1620 C6 position in Pyronin Y and Hoechst stained and sorted G0 and non-G0 including G1, S and G2/M phase CD34+ HSPCs. ns P>0.05 G0 compared with non-G0, n=5 independent donors and analyzed using paired two-tailed Student’s t-test. c-g, Percentage of engrafted human B cells (c), granulocytes (d), monocytes (e), erythroid cells (f) and HSPCs (g) from mouse BM 16 weeks after primary transplantation. Data are plotted as grand median, n=6 primary recipients from mock, n=5 primary recipients from 1EP, n=11 primary recipients from 2 EP. h-l, Correlation of overall human chimerism to individual lineages after primary transplantation. Data are analyzed using two-tailed nonparametric Spearman correlation. The Spearman correlation coefficients (r) and P values are shown. n=6 primary recipients from mock, n=5 primary recipients from 1EP, n=11 primary recipients from 2 EP. m, Overall frequencies of C base edits in input CD34+ HSPCs and engrafted HSPCs, B cells, erythroid and BM by deep sequence analysis. Data are plotted as grand median and analyzed using unpaired two-tailed Student’s t-test. * P=0.016 engrafted HSPCs compared with input HSPCs, * P=0.02 engrafted B cells compared with input HSPCs, ** P=0.004 engrafted erythroid compared with input HSPCs, ** P=0.008 engrafted BM compared with input HSPCs following one cycle of electroporation. *** P=0.0003 engrafted HSPCs compared with input HSPCs, ** P=0.002 engrafted B cells compared with input HSPCs, *** P=0.0001 engrafted erythroid compared with input HSPCs, *** P=0.0003 engrafted BM compared with input HSPCs following two cycles of electroporation. n=2 independent healthy donors HSPCs with 1 EP, n=5 primary recipients with 1 EP. n=3 independent healthy donors HSPCs with 2 EP, n=7 primary mice for engrafted HSPCs, n=10 primary mice for engrafted B cells and erythroid, n=11 primary mice for engrafted BM. n, Percentage of engrafted human B cells, myeloid cells and CD19- CD33- cells 16 weeks after secondary transplantation from donors 6, 7 and 8. o-p, BCL11A expression by RT-qPCR in engrafted bone marrow human erythroid cells (o) and B cells (p) with 1 EP or 2 EP as compared to mock. Data are plotted as grand median and analyzed using Kolmogorov-Smirnov test, ns for nonsignificant, **P=0.004, *** P=0.0002, n=6 primary recipients from mock, n=5 primary recipients from 1 EP, n=9 primary recipients from 2 EP engrafted erythroid, n=11 primary recipients from 2 EP engrafted B cells.
Extended Data Fig. 5 |
Extended Data Fig. 5 |. Representative xenografted bone marrow flow cytometry analysis.
a-d, Live cells from engrafted mouse BM. e, Human cells gated from hCD45+ population, mouse cells gated from mCD45+ population. f, B cells gated from hCD45+CD19+ population. g, Granulocytes gated from hCD45+CD19-CD33dim with SSC high population. Monocytes gated from hCD45+CD19-CD33+ with SSC low population. h, CD34+Lin- (HSPCs) gated from hCD45+CD19-CD33-CD34+ population. T cells gated from hCD45+CD19-CD33-CD3+ population. i, Erythroid cells gated from hCD45-mCD45-hCD235a+ population. 21 primary recipients and 21 secondary recipients analyzed by flow cytometry.
Extended Data Fig. 6 |
Extended Data Fig. 6 |. Guide RNA-dependent off-target potential of HSPC base editing.
a, Using the CasOFFinder tool, 59 potential genomic off-target sites with 3 or fewer mismatches to the on-target BCL11A enhancer sequence were identified. Each site was evaluated by amplicon deep sequencing. The samples include input HSPCs from donors 6, 7, and 8 with 1 or 2 cycles of RNP electroporation (1 EP or 2 EP) and corresponding engrafted bone marrow samples after primary transplantation (1° engrafted) and secondary transplantation (2° engrafted). Each dot represents the median edit frequency for the condition (with 2–11 samples per condition). Each input sample is from an independent donor. Each engraftment sample is from an independent mouse. * indicates off-target sites with difference in edit frequency between mock and edited samples of at least 0.1% and P<0.05. b, Allele frequency tables of OT1 and OT2 illustrate the condition with the highest off-targets edits, input HSPCs with 2 cycles of electroporation (2 EP) from donor 8. Base editing position indicated by arrow. c, On-target and off-target edits of OT1 and OT2 in individual samples from input HSPCs and engrafted bone marrow from primary and secondary recipients. d, Left, correlation of dose-dependent 1620 on-target edits and OT1 or OT2 off-target edits at RNP concentrations of 0, 10, 20, 30, 40, 50 μM with concentration proportional to fill color opacity. Data are analyzed using two-tailed nonparametric Spearman correlation. The Spearman correlation coefficients (r) and P values are shown. n=1 healthy donor with 5 RNP concentration. Right, on-target to off-target edit ratios of OT1 or OT2 at RNP concentrations of 10–50 μM.
Fig. 1 |
Fig. 1 |. Base editing the +58 BCL11A erythroid enhancer in human CD34+ HSPCs.
a, Five sgRNAs targeting the core +58 BCL11A erythroid enhancer TGN7–9WGATAR half E-box/GATA binding motif (shown in box) with predominant base editing position indicated by arrowhead and PAM shaded. b, Base editing by A3A (N57Q)-BE3 (20 μM) complexed with five sgRNAs at 20 μM each in human CD34+ HSPCs from three independent healthy donors by deep sequence analysis. Cytosines with measurable base editing labeled in purple. Heatmap displays base edit frequency. c, HbF levels by HPLC analysis following in vitro erythroid maturation of HSPCs from three healthy donors edited by each of the five indicated sgRNAs complexed with A3A (N57Q)-BE3 as RNP (20 μM). Data are plotted as mean±s.d. and analyzed using unpaired two-tailed Student’s t-test, ns for nonsignificant, * P=0.015 HbF levels following 1619 base editing compared with mock, n=3 individual donors, * P=0.007 HbF levels following 1620 base editing compared with mock, n=3 individual donors. d, HbF levels of erythroid progeny following dose response of RNP electroporation of HSPCs. Each color represents an individual healthy donor. e, Dose-dependent C base editing by A3A (N57Q)-BE3:sgRNA-1620 RNP electroporation of HSPCs. Base edits quantified by deep sequence analysis. f, Targeting same core +58 BCL11A erythroid enhancer TGN7–9WGATAR half E-box/GATA binding motif (shown in box) by A3A (N57Q)-BE3:sgRNA-1620 and 3xNLS-SpCas9:sgRNA-1617 with predominant base editing or cleavage position respectively indicated by arrowhead and PAM shaded. HbF levels by HPLC and genotype by Sanger sequencing from erythroid colonies derived from single HSPCs sorted 24 h after RNP electroporation. Data are plotted as grand median, n=14 unedited colonies, n=22 BE:1620 monoallelic base edited colonies, n=22 BE:1620 biallelic base edited colonies, n=20 Cas9:1617 biallelic edited colonies.
Fig. 2 |
Fig. 2 |. Therapeutic base editing in SCD patient CD34+ HSPCs.
a, Base editing in two plerixafor-mobilized SCD CD34+ HSPC donors by A3A (N57Q)-BE3:sgRNA-1620. Two cycles of HSPC electroporation with 40 μM RNP were performed, separated by 24 hours. Base edits were measured by deep sequence analysis. b, HbF induction by HPLC analysis of edited erythroid progeny. Data are plotted as grand median. n=3 technical replicates from each SCD patient. c, Phase-contrast microscope representative image of Hoechst 33342 negative sorted enucleated erythroid progeny 30 minutes after sodium metabisulfite (MBS) treatment from unedited and A3A (N57Q)-BE3:sgRNA-1620 base edited SCD #2 CD34+ HSPCs. Yellow arrows indicate sickle forms. Scale bar 10 μm. Three technical replicates were performed. d, Quantification of sickle forms from unedited and base edited enucleated erythroid cells at 30 minutes following MBS treatment. Data are plotted as grand median. n=3 technical replicates from each SCD patient.
Fig. 3 |
Fig. 3 |. Therapeutic and multiplex base editing in β-thalassemia patient CD34+ HSPCs.
a, Base editing in β-thalassemia donors β0β+ #1 and β0βE CD34+ HSPCs by A3A (N57Q)-BE3:sgRNA-1620. Two cycles of HSPC electroporation with 40 μM RNP were performed, separated by 24 hours. Base edits were measured by deep sequence analysis. b, β-like globin expression by RT-qPCR normalized by α-globin, measured from edited erythroid progeny. Data are plotted as mean±s.d. n=3 replicates from independent differentiation cultures. c, Hemoglobin levels by HPLC analysis. Data are plotted as mean±s.d. n=3 replicates from independent differentiation cultures. d, Base editing by A3A(N57Q)-BE3 at BCL11A +58 enhancer with sgRNA-1620 (top two rows) and HBB promoter by sgRNA-HBB-28 (bottom two rows) following single or multiplex editing in β-thalassemia donor β0β+#2 with HBB-28A>G β+ mutation. At the HBB-28A>G mutation position (noted with red asterisk, on opposite strand to spacer), alleles are divided into corrective C>T edits and alternative C>G/A edits. Because the donor is heterozygous at position C8, ~50% of alleles are T in unedited cells. e, β-like globin expression by RT-qPCR normalized by α-globin. Data are plotted as mean±s.d. n=2 replicates from independent electroporation. f, Hemoglobin levels by HPLC analysis. Data are plotted as mean±s.d. n=2 replicates from independent electroporations. g, j, Enucleation of in vitro differentiated erythroid cells from BCL11A enhancer only or multiplex editing experiments respectively. Data are plotted as mean±s.d. n=2 replicates from independent electroporations. h, k, Cell size by relative forward scatter intensity of enucleated erythroid cells, normalized to healthy donor, from BCL11A enhancer only or multiplex editing experiments respectively. Data are plotted as mean±s.d. n=2 replicates from independent electroporations. i, l, Circularity of enucleated erythroid cells by imaging flow cytometry, from BCL11A enhancer only or multiplex editing experiments respectively. Data are plotted as mean±s.d. n=2 replicates from independent electroporations.
Fig. 4 |
Fig. 4 |. Efficient C>T base editing in HSCs.
a-b, CD34+ HSPCs were electroporated with A3A (N57Q)-BE3:sgRNA-1620 RNP (40 μM) 24 hours after thawing cryopreserved cells. After an additional two hours cells were sorted by FACS. After 4 days of culture, base edits were evaluated by amplicon deep sequencing. a, Frequencies of C>T base editing (left) and C>G/A base editing (right) at sgRNA-1620 C6 position in sorted immunophenotypically enriched HSC (CD34+ CD38- CD90+ CD45RA-) or HPC (CD34+ CD38+) populations. Data are analyzed using paired two-tailed Student’s t-test, ns for nonsignificant, * P=0.015 C>G/A base edits in HSC compared with HPC, n=5 independent healthy donors. b, Frequencies of C>T base editing (left) and C>G/A base editing (right) at sgRNA-1620 C6 position in Pyronin Y and Hoechst stained and sorted G0 and non-G0 including G1, S and G2/M phase CD34+ HSPCs. Data are analyzed using paired two-tailed Student’s t-test, ns for nonsignificant, * P=0.0025 C>G/A base edits in G0 compared with non-G0, n=5 independent healthy donors. c, Following A3A(N57Q)-BE3:sgRNA-1620 RNP (40 μM) base editing with one or two cycles of electroporation, 800,000 live HSPCs, counted immediately prior to infusion, were infused to NBSGW mice. Human bone marrow chimerism 16 weeks following base edited HSPC infusion. Data are plotted as grand median and analyzed using Kolmogorov-Smirnov test, ns for nonsignificant. ** P=0.0017 comparing human chimerism of mock with 2 EP, n=6 mice from mock, n=5 mice from 1 EP, n=10 mice from 2 EP. d, Base editing at C6 position in engrafting HSPCs, B cells, erythroid cells and unfractionated bone marrow after 16 weeks as compared with input HSPCs following 1 or 2 cycles of electroporation (1 EP, 2 EP). Each dot indicates one mouse recipient. Data are plotted as mean±s.d. and analyzed using unpaired two-tailed Student’s t-test, ** P<0.01, C>G/A base edits in engrafting cells vs. input cells following one cycle of electroporation, P=0.0034 engrafted HSPCs vs. input HSPCs, P= 0.0041 engrafted B cells vs. input HSPCs, P=0.0019 engrafted erythroid cells vs. input HSPCs, P= 0.0015 engrafted BM vs. input HSPCs, n=2 independent healthy donors from input HSPCs, n=5 primary recipients. **** P<0.0001 compared C>G/A base edits in engrafting cells with input cells following two cycles of electroporation, n=3 independent healthy donors from input HSPCs, n=7 primary recipients for engrafted HSPCs, n=10 primary recipients for engrafted B cells and erythroid, n=11 primary recipients for engrafted BM. e, Human bone marrow chimerism 16 weeks after secondary transplantation. Donor 6 and donor 7 with 1 cycle EP and 2 cycles EP, and donor 8 with 2 cycles EP are shown. Data are plotted as grand median, n=6 secondary recipients from mock, n=5 secondary recipients from 1 EP, n=10 secondary recipients from 2 EP. f, Base editing by deep sequence analysis at C6 position in bone marrow 16 weeks after secondary transplantation. Data are plotted as median with range, n=2 secondary recipients from donor 6 with 1 EP, n=3 secondary recipients from donor 6 with 2 EP, n=2 secondary recipients from donor 7 with 1 EP, n=2 secondary recipients from donor 7 with 2 EP, n=5 secondary recipients from donor 8 with 2 EP. g, HbF induction by HPLC in engrafted bone marrow human erythroid cells. Data are plotted as grand median and analyzed using Kolmogorov-Smirnov test, **P=0.004, *** P=0.0002 HbF level in engrafted erythroid cells with 1 EP or 2 EP as compared to mock. *P=0.019 HbF level in engrafted erythroid cells with 2 EP as compared to 1 EP, n=6 primary recipients from mock, n=5 primary recipients from 1 EP, n=10 primary recipients from 2 EP. h, Correlation of base edit frequency and HbF level in engrafted erythroid cells. Data are analyzed using two-tailed nonparametric Spearman correlation. The Spearman correlation coefficient (r) is shown, P<0.0001. n=6 primary recipients from mock, n=5 primary recipients from 1 EP, n=10 primary recipients from 2 EP.

Comment in

References

    1. Holt N et al. Human hematopoietic stem/progenitor cells modified by zinc-finger nucleases targeted to CCR5 control HIV-1 in vivo. Nat. Biotechnol. 28, 839–847 (2010). - PMC - PubMed
    1. Genovese P et al. Targeted genome editing in human repopulating haematopoietic stem cells. Nature 510, 235–40 (2014). - PMC - PubMed
    1. Hoban MD et al. Correction of the sickle-cell disease mutation in human hematopoietic stem/progenitor cells. Blood 125, 2597–604 (2015). - PMC - PubMed
    1. Dever DP et al. CRISPR/Cas9 β-globin gene targeting in human haematopoietic stem cells. Nature 539, 384–389 (2016). - PMC - PubMed
    1. Dewitt MA et al. Selection-free genome editing of the sickle mutation in human adult hematopoietic stem/progenitor cells. Sci. Transl. Med. 8, 1–9 (2016). - PMC - PubMed

Publication types

MeSH terms