. 2020 Apr;26(4):506-510.
doi: 10.1038/s41591-020-0822-7. Epub 2020 Mar 19.

Estimating clinical severity of COVID-19 from the transmission dynamics in Wuhan, China

Affiliations

Estimating clinical severity of COVID-19 from the transmission dynamics in Wuhan, China

Joseph T Wu et al. Nat Med. 2020 Apr.

Erratum in

Abstract

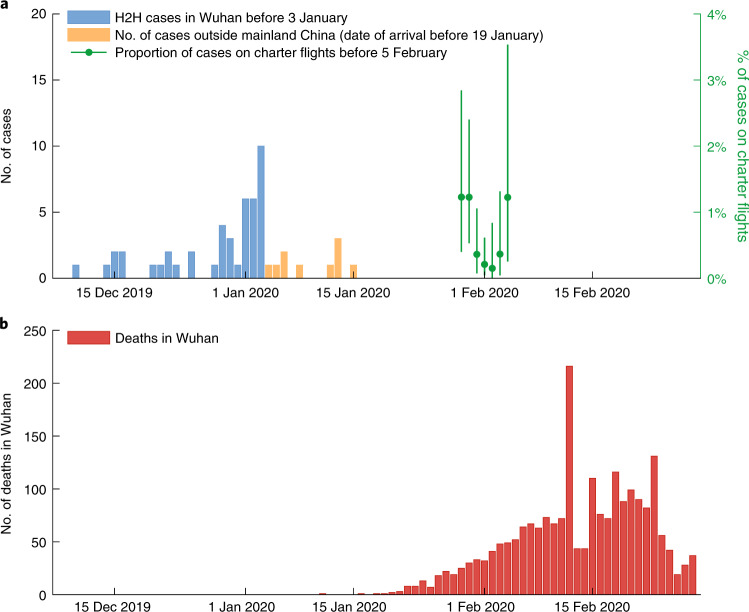
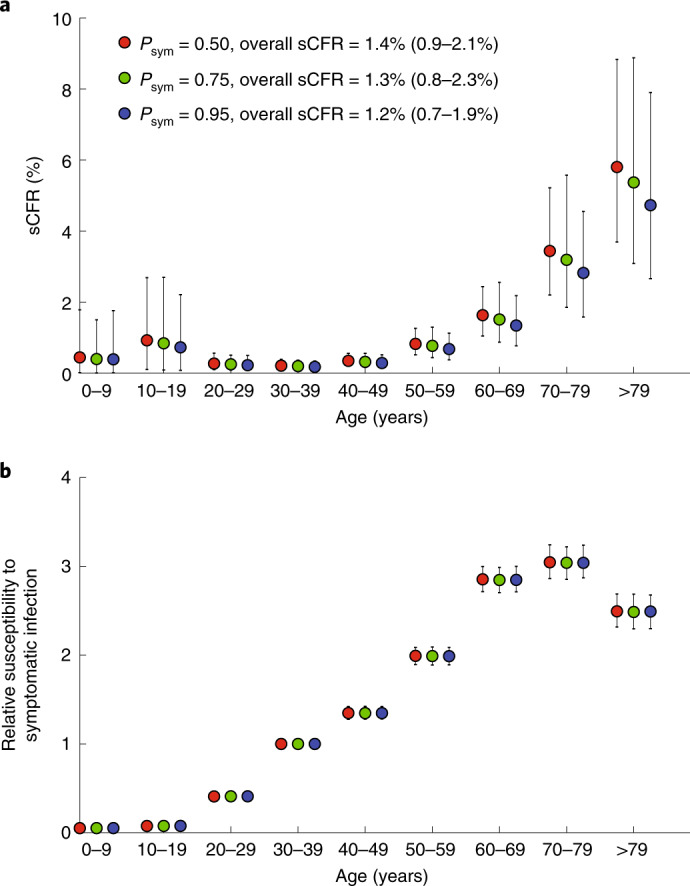
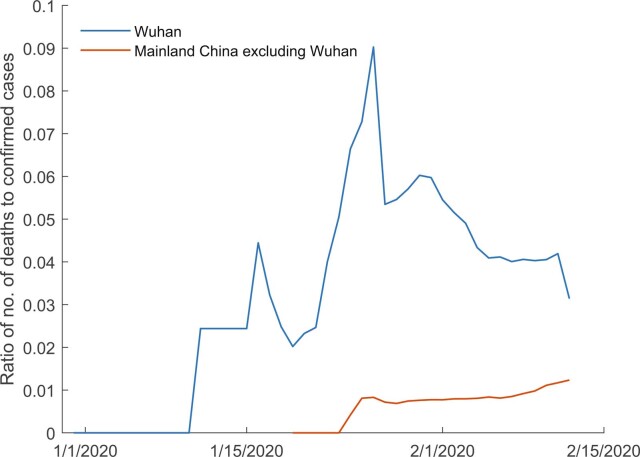
As of 29 February 2020 there were 79,394 confirmed cases and 2,838 deaths from COVID-19 in mainland China. Of these, 48,557 cases and 2,169 deaths occurred in the epicenter, Wuhan. A key public health priority during the emergence of a novel pathogen is estimating clinical severity, which requires properly adjusting for the case ascertainment rate and the delay between symptoms onset and death. Using public and published information, we estimate that the overall symptomatic case fatality risk (the probability of dying after developing symptoms) of COVID-19 in Wuhan was 1.4% (0.9-2.1%), which is substantially lower than both the corresponding crude or naïve confirmed case fatality risk (2,169/48,557 = 4.5%) and the approximator1 of deaths/deaths + recoveries (2,169/2,169 + 17,572 = 11%) as of 29 February 2020. Compared to those aged 30-59 years, those aged below 30 and above 59 years were 0.6 (0.3-1.1) and 5.1 (4.2-6.1) times more likely to die after developing symptoms. The risk of symptomatic infection increased with age (for example, at ~4% per year among adults aged 30-60 years).


Conflict of interest statement

The authors declare no competing interests.

Figures

Fig. 1
Fig. 1. Data used in the inference.
a, The daily number of confirmed cases in Wuhan (with no epidemiologic links to Huanan Seafood Wholesale Market, i.e., cases due to human-to-human (H2H) transmission) between 1 December 2019 and 3 January 2020 (blue), the daily number of cases exported from Wuhan to cities outside mainland China via air travel between 25 December 2019 and 19 January 2020 (orange) and the proportion of expatriates on charter flights between 29 January and 4 February 2020 who were laboratory-confirmed to be infected (green). The numbers of passengers and confirmed cases who returned to their countries from Wuhan on chartered flights are provided in Supplementary Table 3. Bars indicate the 95% confidence intervals (CIs) of the proportion. b, The daily number of deaths in Wuhan reported between 1 December 2019 and 28 February 2020.
Fig. 2
Fig. 2. Estimates of age-specific sCFR and susceptibility to symptomatic infection for COVID-19 in Wuhan.
a, Estimates of age-specific sCFRs assuming Psym is 0.50 (red), 0.75 (green) and 0.95 (blue). b, Estimates of relative susceptibility to symptomatic infection by age assuming Psym is 0.50 (red), 0.75 (green) and 0.95 (blue). The markers in both panels show the posterior means and the bars show 95% credible intervals (CrIs).
Fig. 3
Fig. 3. Estimates of key epidemiologic parameters of the COVID-19 epidemic in Wuhan.
Estimates of basic reproductive number, mean serial interval, initial doubling time, intervention effectiveness, ascertainment rate and the mean time from onset to death, assuming Psym is 0.50 (red), 0.75 (green) and 0.95 (blue). The markers show the posterior means and the bars show 95% CrIs.
Extended Data Fig. 1
Extended Data Fig. 1. Model parameters that were subject to statistical inference.
Epidemiologic parameters fitted in the model.
Extended Data Fig. 2
Extended Data Fig. 2. The ratio of no. of deaths to confirmed cases (crude confirmed case-fatality ratio) in Wuhan and in cities of mainland China other than Wuhan.
Blue line shows the ratio of the number of deaths to the number of confirmed cases in Wuhan and the red line shows the ratio locations within mainland China outside Wuhan.
Extended Data Fig. 3
Extended Data Fig. 3. A summary of severity estimates among pandemic influenza strains and coronaviruses with pandemic potential in the past.
Severity estimates of SARS (2002-3), MERS (2014-), 1918 influenza pandemic (1918-20) and 2009 influenza pandemic (2009-10).
Extended Data Fig. 4
Extended Data Fig. 4. Model parameters that were assumed to be constant.
Assumed constants in the model.

Similar articles

Cited by

References

    1. Ghani A, et al. Methods for estimating the case fatality ratio for a novel, emerging infectious disease. Am. J. Epidemiol. 2005;162:479–486. doi: 10.1093/aje/kwi230. - DOI - PMC - PubMed
    1. Wong JY, et al. Case fatality risk of influenza A (H1N1pdm09): a systematic review. Epidemiology. 2013;24:830–841. doi: 10.1097/EDE.0b013e3182a67448. - DOI - PMC - PubMed
    1. Yu H, et al. Human infection with avian influenza A H7N9 virus: an assessment of clinical severity. Lancet. 2013;382:138–145. doi: 10.1016/S0140-6736(13)61207-6. - DOI - PMC - PubMed
    1. Wu, J. T., Leung, K. & Leung, G. M. Nowcasting and forecasting the potential domestic and international spread of the 2019-nCoV outbreak originating in Wuhan, China: a modelling study. Lancet (2020); 10.1016/S0140-6736(20)30260-9 - PMC - PubMed
    1. Liu, Y., Eggo, R. M. & Kucharski, A. J. Secondary attack rate and superspreading events for SARS-CoV-2. Lancet (2020); 10.1016/S0140-6736(20)30462-1 - PMC - PubMed

Publication types

MeSH terms