. 2020 Apr 3;6(14):eaax0069.
doi: 10.1126/sciadv.aax0069. eCollection 2020 Apr.

The hypertrophic cardiomyopathy mutations R403Q and R663H increase the number of myosin heads available to interact with actin

Affiliations

The hypertrophic cardiomyopathy mutations R403Q and R663H increase the number of myosin heads available to interact with actin

Saswata S Sarkar et al. Sci Adv. .

Abstract

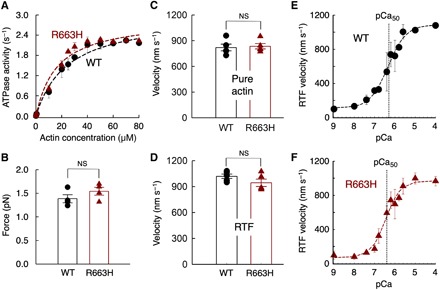
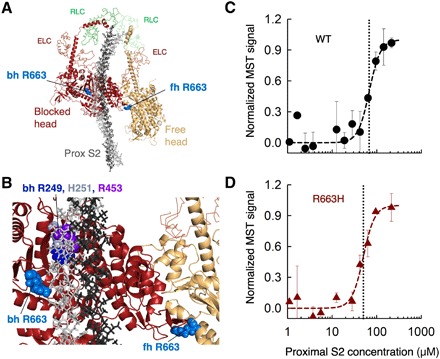
Hypertrophic cardiomyopathy (HCM) mutations in β-cardiac myosin and myosin binding protein-C (MyBP-C) lead to hypercontractility of the heart, an early hallmark of HCM. We show that hypercontractility caused by the HCM-causing mutation R663H cannot be explained by changes in fundamental myosin contractile parameters, much like the HCM-causing mutation R403Q. Using enzymatic assays with purified human β-cardiac myosin, we provide evidence that both mutations cause hypercontractility by increasing the number of functionally accessible myosin heads. We also demonstrate that the myosin mutation R403Q, but not R663H, ablates the binding of myosin with the C0-C7 fragment of MyBP-C. Furthermore, addition of C0-C7 decreases the wild-type myosin basal ATPase single turnover rate, while the mutants do not show a similar reduction. These data suggest that a primary mechanism of action for these mutations is to increase the number of myosin heads functionally available for interaction with actin, which could contribute to hypercontractility.


Figures

Fig. 1
Fig. 1. Fundamental contractile parameters of WT (black) and R663H (dark red) human β-cardiac sS1.
(A) Actin-activated ATPase data for WT and R663H sS1. Fitting the traces yielded kcat values of 3.0 ± 0.2 and 2.9 ± 0.1 s−1 for WT and R663H sS1, respectively. Dashed lines are the fitted lines. Representative data (average of two experiments from single preparations of both proteins) are shown. (B) Intrinsic force measurements of WT (black) and R663H (dark red) human β-cardiac sS1 using an optical trap. The individual force values were averaged from force measurements of four molecules of each motor. (C) Comparison of in vitro motility of actin filaments for WT (black) and R663H (dark red) human β-cardiac sS1 (five different experiments from five independent protein preparations for each of WT and R663H sS1). (D) Comparison of in vitro motility of regulated thin filaments at pCa = 4.0 for WT (black) and R663H (dark red) human β-cardiac sS1 (five different experiments from four independent protein preparations for each of WT and R663H sS1). (E) Ca2+ sensitivity measurements for WT human β-cardiac sS1 (four different experiments were averaged). (F) Ca2+ sensitivity measurements for R663H human β-cardiac sS1 (four different experiments were averaged). The data for (E) and (F) were fitted (dashed lines) to the Hill equation to estimate the pCa50. When each of the four individual experiments was fitted to the Hill equation separately, mean pCa values of 6.3 ± 0.2 and 6.5 ± 0.2 were obtained for WT and R663H, respectively. For all panels, error bars denote SEM. NS, not significant, P > 0.05. (B) P = 0.24; (C) P = 0.78; (D) P = 0.18; (E and F) P = 0.46 (four individual experiments were used for calculation).
Fig. 2
Fig. 2. The affinity of WT and R663H human ß-cardiac sS1 binding to proximal S2.
(A) Structural model of the IHM state for human β-cardiac myosin [human sequestered state model; from Robert-Paganin et al. (14)]. The S1 portion of the heavy chain is shown in cartoon mode (PyMOL), the light chains are in ribbon mode, and the proximal S2 is in stick mode. The positions of the blocked head (bh) and free head (fh) Arg663 residues are shown as spheres in light blue. (B) Blowup of the IHM model showing the relationships between the Arg663 residues and the proximal S2 position and the head-head interaction zone. Bh R249 (blue), H251 (gray), and R453 (purple) are shown for reference. (C) MST binding data for WT human ß-cardiac sS1 and proximal S2 in 100 mM KCl. (D) MST binding data for R663H human ß-cardiac sS1 and proximal S2in 100 mM KCl. Data in (C) and (D) are representative data from two measurements from a single set of protein preparations.
Fig. 3
Fig. 3. Functional assays for ATP turnover by WT, R403Q, and R663H human b-cardiac 25-hep HMM and 2-hep HMM.
(A) Actin-activated ATPase of R403Q 2-hep HMM (light blue) and R403Q 25-hep HMM (dark blue). (B) Actin-activated ATPase of R663H 2-hep HMM (orange) and R663H 25-hep HMM (dark red). For (A) and (B), data are combined from two experiments from one protein preparation. Each point is an average, with the error bar as SEM. (C) Fluorescence decay of mant-nucleotide release from WT human ß-cardiac 25-hep HMM in 25 mM KAc (solid black curve). Fitting the traces (dashed cyan curve) to a double-exponential equation yielded the DRX and SRX rates of 0.030 and 0.0034 s−1. The simulated single-exponential orange dashed curve is the SRX rate (0.0034 s−1), and the simulated single-exponential dashed green curve is the DRX rate (0.030 s−1). The simulated orange and green dashed curves act as visual references for the single exponential fits of slow and fast phases, respectively, that derive from fitting the solid black data curves with the best two exponential fits. Thus, the data (black lines) were fit with a combination of these two single exponentials. (D) Fluorescence decay of mant-nucleotide release from R403Q human ß-cardiac 25-hep HMM in 25 mM KAc, where the fast and slow fitting rates were 0.017 and 0.0017 s−1, respectively. (E) Fluorescence decay of mant-nucleotide release from R663H human ß-cardiac 25-hep HMM in 25 mM KAc, where the fast and slow fitting rates were 0.047 and 0.0031 s−1, respectively. (C) and (E) show representative data from one preparation of each protein. (F) Percentage of myosin heads in the SRX (orange) versus DRX (olive green) states calculated from the amplitudes of the double-exponential fits of the fluorescence decays corresponding to the mant-nucleotide release from the 25-hep HMMs shown in (C) to (E). The data are from nine measurements (from six individual protein preparations done on different days) of WT 25-hep HMM, five measurements of R403Q 25-hep HMM (from four individual protein preparations done on different days), and seven measurements of R663H 25-hep HMM (from five individual protein preparations done on different days). Error bars, SEM. **P ≤ 0.01; ****P ≤ 0.0001. WT versus R403Q, P = 0.01; WT versus R663H, P = 0.00003. (G) Homology model of the IHM state of human β-cardiac 25-hep HMM [human sequestered state model from Robert-Paganin et al. (14)] showing the positions of the blocked head (bh) Arg403 residue (dark blue) and the free head (fh) Arg663 residue (light blue) at a head-head interaction site. (H) Blowup of the IHM model showing the positions of the bh Arg403 and fh Arg663 residues at the interface between the blocked head (dark red) and the free head (light brown).
Fig. 4
Fig. 4. Effect of R403Q and R663H mutations on C0-C7 binding and activity.
(A) Binding of human ß-cardiac 25-hep HMM with the C0-C7 fragment of MyBP-C for WT (black), R663H (dark red), and R403Q (blue). Data points represent the mean at each C0-C7 concentration with the SEM shown. These representative data are the average of five measurements from a single set of protein preparations. (B) Homology model showing the N-terminal residues C0 to C2 of cardiac MyBP-C. (C) Backside view of a structural model of the IHM state for human β-cardiac myosin [human sequestered state model from Robert-Paganin et al. (14)] with C0-C2 bound in the groove between proximal S2 and the mesa of the free head. (D) Fluorescence decay of mant-nucleotide release from WT human b-cardiac 25-hep HMM in the presence of 10 μM C0C7 in 25 mM KAc (solid black curve). Fitting the traces (dashed orange curve) to a single-exponential equation yielded the SRX rate of 0.0052 s−1. (E) Fluorescence decay of mant-nucleotide release from R403Q human ß-cardiac 25-hep HMM in the presence of 10 μM C0C7 in 25 mM KAc, where the fast and slow rates were 0.016 and 0.0027 s−1, respectively. (F) Fluorescence decay of mant-nucleotide release from R663H human b-cardiac 25-hep HMM in the presence of 10 μM C0C7 in 25 mM KAc, where the fast and slow rates were 0.032 and 0.0056 s−1, respectively. The simulated orange and green dashed curves in (E) and (F) act as visual references for the double exponential fits of slow and fast phases, respectively, that derive from fitting the solid black data curves with the best two exponential fits shown in dashed cyan curves. (D) to (F) show representative data from one preparation of each protein. (G) Percentage of myosin heads in the SRX (orange) versus DRX (olive green) calculated from the amplitudes of the double-exponential fits of the fluorescence decays corresponding to the mant-nucleotide release from the 25-hep HMMs in the presence of 10 μM C0C7 shown in (D) to (F). The data are from seven measurements (from four individual protein preparations done on different days) of WT 25-hep HMM, five measurements (from three individual protein preparations done on different days) of R403Q 25-hep HMM, and seven measurements (from three individual protein preparations done on different days) of R663H 25-hep HMM. Error bars, SEM. ****P ≤ 0.0001. WT versus R403Q, P = 0.00006; WT versus R663H, P = 0.00005.

References

    1. Semsarian C., Ingles J., Maron M. S., Maron B. J., New perspectives on the prevalence of hypertrophic cardiomyopathy. J. Am. Coll. Cardiol. 65, 1249–1254 (2015). - PubMed
    1. Harvey P. A., Leinwand L. A., The cell biology of disease: Cellular mechanisms of cardiomyopathy. J. Cell Biol. 194, 355–365 (2011). - PMC - PubMed
    1. Konno T., Chang S., Seidman J. G., Seidman C. E., Genetics of hypertrophic cardiomyopathy. Curr. Opin. Cardiol. 25, 205–209 (2010). - PMC - PubMed
    1. Spudich J. A., Hypertrophic and dilated cardiomyopathy: Four decades of basic research on muscle lead to potential therapeutic approaches to these devastating genetic diseases. Biophys. J. 106, 1236–1249 (2014). - PMC - PubMed
    1. Spudich J. A., The myosin mesa and a possible unifying hypothesis for the molecular basis of human hypertrophic cardiomyopathy. Biochem. Soc. Trans. 43, 64–72 (2015). - PMC - PubMed

Publication types

LinkOut - more resources