. 2020 Apr 3;6(14):eaay3539.
doi: 10.1126/sciadv.aay3539. eCollection 2020 Apr.

Evaluating the fake news problem at the scale of the information ecosystem

Affiliations

Evaluating the fake news problem at the scale of the information ecosystem

Jennifer Allen et al. Sci Adv. .

Abstract

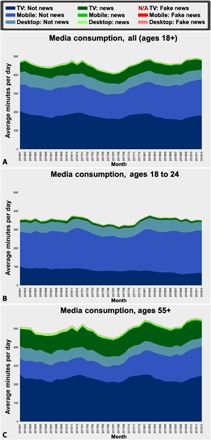
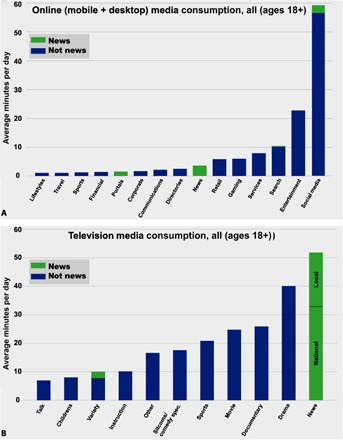
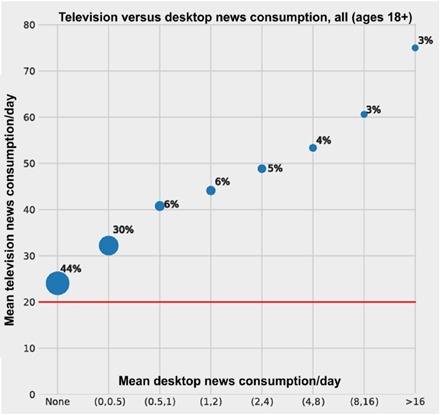
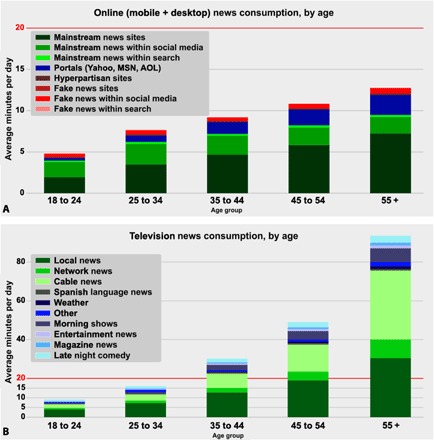
"Fake news," broadly defined as false or misleading information masquerading as legitimate news, is frequently asserted to be pervasive online with serious consequences for democracy. Using a unique multimode dataset that comprises a nationally representative sample of mobile, desktop, and television consumption, we refute this conventional wisdom on three levels. First, news consumption of any sort is heavily outweighed by other forms of media consumption, comprising at most 14.2% of Americans' daily media diets. Second, to the extent that Americans do consume news, it is overwhelmingly from television, which accounts for roughly five times as much as news consumption as online. Third, fake news comprises only 0.15% of Americans' daily media diet. Our results suggest that the origins of public misinformedness and polarization are more likely to lie in the content of ordinary news or the avoidance of news altogether as they are in overt fakery.


Figures

Fig. 1
Fig. 1. Overall information consumption by category and platform over time, from January 2016 to December 2018.
Breakdown of consumption for (A) the entire adult sample, 18 years and older, (B) 18 to 24 years old, and (C) 55 years and older. See table S6 for numerical values.
Fig. 2
Fig. 2. Detailed breakdown of overall media consumption for Online and TV.
(A) Online consumption (including mobile and desktop) for the top 2000 sites per applications on Comscore. (B) TV consumption by program category. Total online consumption is 227 min per person per day, of which 58% is accounted for by the top 2000 sites, while total television consumption is 232 min per person per day. To compute news consumption in search and social media, excluding YouTube, we use the share of referrals from the site in question that redirect to news articles as a proxy for the share of time a user is exposed to news-related content on the platform. For YouTube, which does not redirect users to external sites, we randomly sampled 10,000 videos per month (weighted by viewing time) and computed the percentages that were classified as “news and politics”. Because portals such as MSN, Yahoo, and AOL almost always display some news-related stories on their landing pages, we count 100% of time spent on portals as news consumption. Last, news consumption in the “variety” category of television viewing is computed as 100% of time attributed to late-night comedy programs, such as The Daily Show With Trevor Noah, which are known to contain commentary on politics and current events. For clarity, (A) shows only the top 15 of 28 categories (see table S7 for numerical values).
Fig. 3
Fig. 3. Television versus desktop news consumption aggregated over all age categories 18 to 55+.
For each month, the overlap panelists are separated into groups corresponding to different ranges of web news consumption. For each group, the mean television news consumption and group size as a percentage of all panelists are computed. Overtime averages for the mean television news consumption and size of each group are calculated by computing the mean television news mean and mean group size over all 36 months. Error bars are SEs obtained via bootstrapping for group size and group television news consumption, respectively, and are smaller than the symbols. See fig. S2 for all results broken down by age group, and tables S8 and S9 for numerical values.
Fig. 4
Fig. 4. News-only consumption by age.
Detailed breakdown of news-only consumption by age group for (A) online (including mobile and desktop) and (B) television. See fig. S4 (A and B) for results plotted over time from January 2016 to December 2018. See table S11 for numerical values.

References

    1. Allcott H., Gentzkow M., Social Media and Fake News in the 2016 Election. J. Econ. Perspect. 31, 211–236 (2017).
    1. Shu K., Sliva A., Wang S., Tang J., Liu H., Fake news detection on social media: A data mining perspective. ACM SIGKDD Explor. Newsl. 19, 22–36 (2017).
    1. Lazer D. M. J., Baum M. A., Benkler Y., Berinsky A. J., Greenhill K. M., Menczer F., Metzger M. J., Nyhan B., Pennycook G., Rothschild D., Schudson M., Sloman S. A., Sunstein C. R., Thorson E. A., Watts D. J., Zittrain J. L., The science of fake news. Science 359, 1094–1096 (2018). - PubMed
    1. Vosoughi S., Roy D., Aral S., The spread of true and false news online. Science 359, 1146–1151 (2018). - PubMed
    1. Shao C., Hui P.-M., Wang L., Jiang X., Flammini A., Menczer F., Ciampaglia G. L., Anatomy of an online misinformation network. PLOS ONE 13, e0196087 (2018). - PMC - PubMed

Publication types

LinkOut - more resources